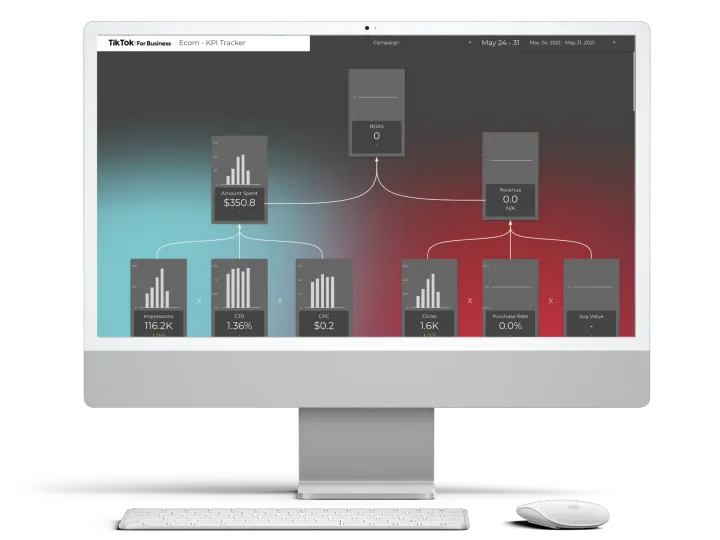
Facebook Ads Root-cause Tree Desktop Dashboard for E-commerce
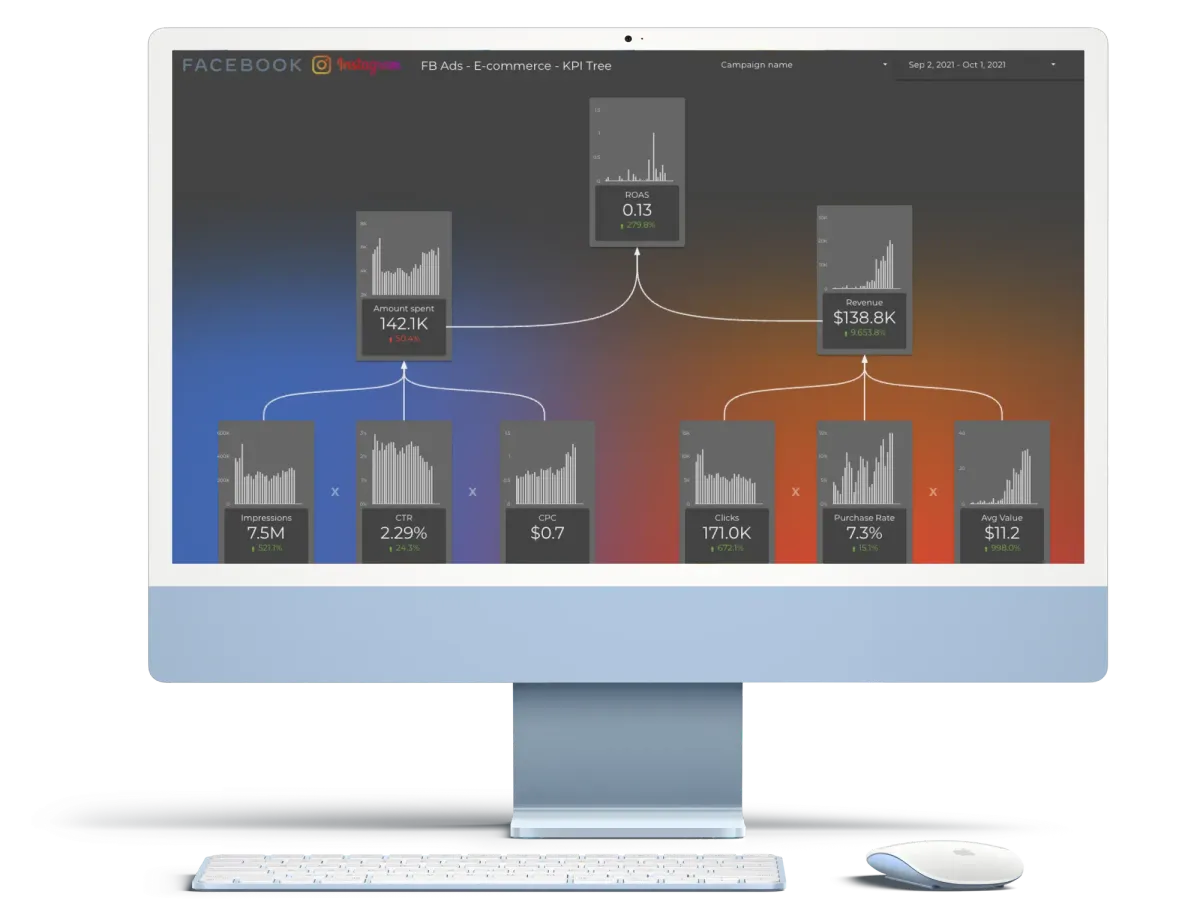
This is a Google Data Studio dashboard which works with Facebook Ads account or accounts. This dashboard visualise steps of ROAS calculation in a smart and intuitive way.
For Whom?
The Facebook Ads Root-cause Tree Desktop Dashboard for E-commerce is for agencies, digital marketing professionals and social media advertising experts whose goals are
- making smart presentations to clients or executives,
- reviewing each step which in the end effects a good or bad ROAS of your Facebook Ad campaigns,
What You Will Get?
You will get ownership of Facebook Ads Root-cause Tree Desktop Dashboard for E-commerce. After connecting Facebook Ads accounts, you can start to reviewing ads performance and KPIs right away. Charts and visual elements will be dynamic and reflect all historic Facebook Ads data within the account you will connect.
💡 Google Data Studio does not come with a native data connector like with Google Ads or Google Analytics. A 3rd party community connector subscription will be needed and should be purchased separately.
Possible Usage
This is a unique dashboard to understand ongoing performance of Facebook Ads focusing on your ROAS and elements which effect your ROAS.
- Breaking down reasons and causes which might effect a good or bad ROAS.
- Observing changes in the values respected in time series line chart.
- Presenting progress or change in time, focusing ROAS.
Included Dimensions and Metrics
This dashboard includes all the important dimensions and metrics, such as:
- ROAS
- Cost
- Revenue
- Impressions
- Click thru rate (CTR)
- Average cost per click (CPC)
- Clicks
- Purchase Rate
- Average Value
- Conversions
- Cost / Purchase
Design
This dashboard comes up with a very unique "tree layout". Arrows and placement of each scorecard, gives user a very easy to ready path analysis experience. Just follow the arrows!
💡 This simple tree layout is actually refined version of more than 5 different reports from+3 different platforms. Users will save tremendous amount of time to achieve same result and will be able to allocate this valuable time on developing better strategies for a better ROAS!