Project Management Spreadsheet Template
Introducing our Project Management Spreadsheet Template, designed to streamline your project management processes and drive efficiency.
With this comprehensive tool, you can easily track tasks, set deadlines, allocate resources, and monitor progress all in one place. Say goodbye to scattered information and welcome a centralized solution for effective project management.
Whether you're a small team or a large organization, our template provides the structure and flexibility needed to stay organized and deliver successful projects on time.
Experience enhanced collaboration, improved communication, and simplified project tracking with our Project Management Spreadsheet Template. Boost productivity, eliminate guesswork, and achieve project success with ease.
You can watch the YouTube video below if you don't want to read the whole page. Let's start.
Our template includes dashboards prepared with two sample project scenarios.
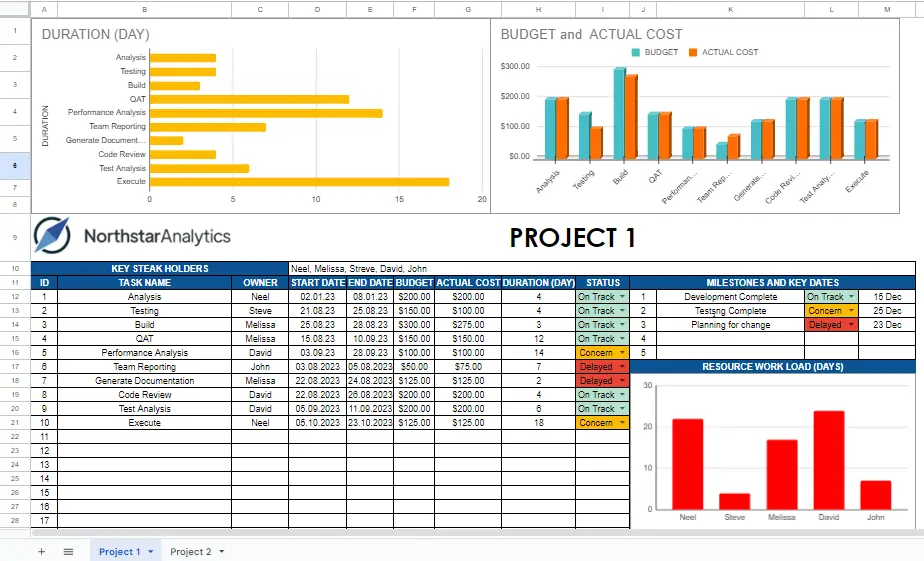
Duration(Day) Bar Chart
The bar chart titled "DURATION (DAY)" displays the distribution of durations (in days) based on the TASK NAME. The data for TASK NAME and DURATION (DAY) are derived from the table below. If you add or remove data in this table, you will observe that the bar chart updates accordingly.
Budget and Actual Cost Column Chart
The column chart titled "BUDGET and ACTUAL COST" displays the distribution of BUDGET and ACTUAL COST based on TASK NAME. All the data for this chart is derived from the table below. If any changes are made to the data used in this chart, you will observe that the chart updates accordingly.
Key Steak Holders Table
- TASK NAME: The TASK NAME column represents the names or titles of the tasks involved in the project. Each task is uniquely identified by its name, allowing for easy tracking and assignment.
- OWNER: The OWNER column specifies the individuals or teams responsible for each task. It helps assign accountability and ensures that tasks are properly delegated and managed.
- START DATE: The START DATE column indicates the planned or actual start date for each task. It helps establish the timeline and sequencing of tasks within the project.
- END DATE: The END DATE column represents the planned or actual completion date for each task. It provides a clear target for task completion and helps track progress against deadlines.
- BUDGET: The BUDGET column specifies the allocated budget for each task. It helps estimate and monitor the financial resources required for task execution.
- ACTUAL COST: The ACTUAL COST column tracks the actual expenses or costs incurred for each task. It helps compare the actual costs against the allocated budget, providing insights into project financials.
- DURATION (DAY): The DURATION (DAY) column calculates the duration of each task in days. It can be automatically filled by subtracting the start date from the end date.
- STATUS: The STATUS column indicates the current status or progress of each task. It helps track whether a task is in progress, completed, or delayed, providing a quick overview of task statuses.
- SUPERVISOR: The SUPERVISOR column identifies the supervisors or managers overseeing each task. It helps ensure proper guidance, support, and coordination throughout the project.
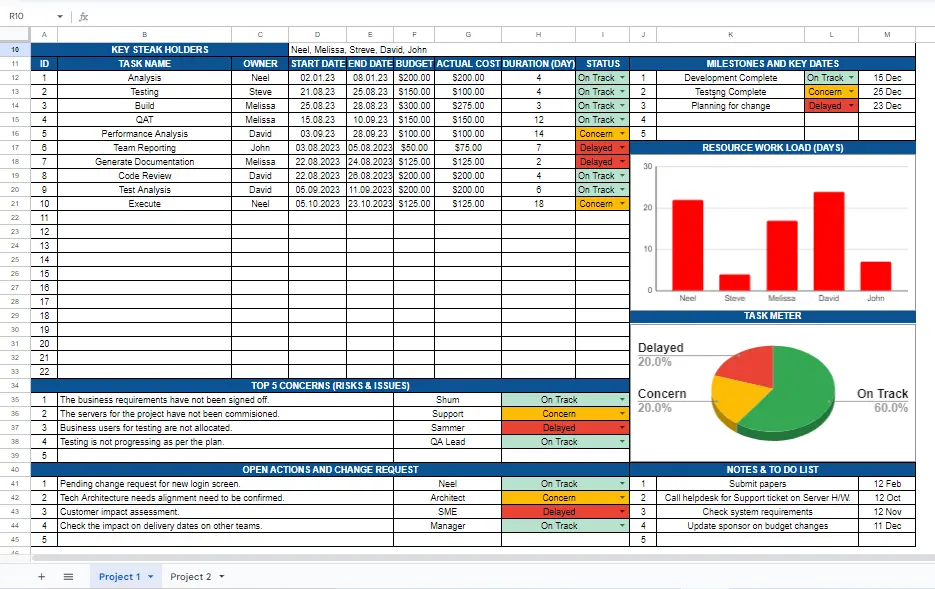
Milestones and Key Dates Table
The MILESTONES AND KEY DATES table is one of the tables prepared for the Project Management System. This table includes key milestones and deadlines for a particular project. These milestones and deadlines help project managers and team members to stay on track and meet the project goals within the expected time frame.
Top 5 Concerns (Risks & Issues) Table
The purpose of this table is to provide a consolidated overview of the top concerns or risks faced by the project. By regularly reviewing and updating this table, project managers can prioritize their efforts and allocate resources accordingly. Additionally, it allows stakeholders to stay informed about potential risks and track the progress of issue resolution throughout the project lifecycle.
Open Actions and Change Request Table
The "Open Actions and Change Request" table is a component of a Project Management System. This table is designed to track pending change requests, tasks, and action items related to the project. Each row of the table represents an individual action item or change request and contains relevant information such as the task or request description, the person responsible for completing the task, and the status of the task (e.g., On Track, Delayed, Completed, etc.).
Resource Work Load(Days) Column Chart
The column chart titled "RESOURCE WORK LOAD (DAYS)" illustrates the distribution of the total duration (in days) for each owner.
Task Meter 3D Pie Chart
The "TASK METER" is a 3D pie chart that illustrates the distribution of project statuses.
Notes & To-do List Table
The purpose of this table is to help you keep track of important tasks and deadlines related to your project.
The first column, "Task/Item," lists the specific task or item that needs to be completed. The second column, "Due Date," specifies the deadline for completing the task or item. By entering this information, you can ensure that you stay on track and complete everything in a timely manner.
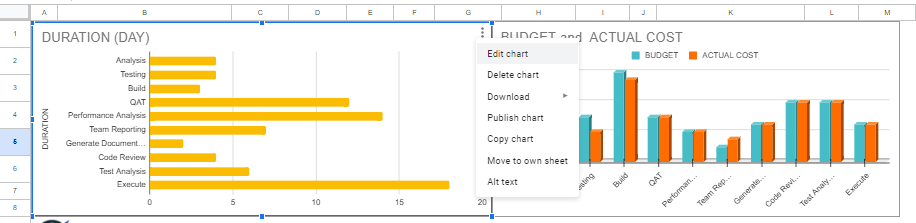
How to edit a chart?
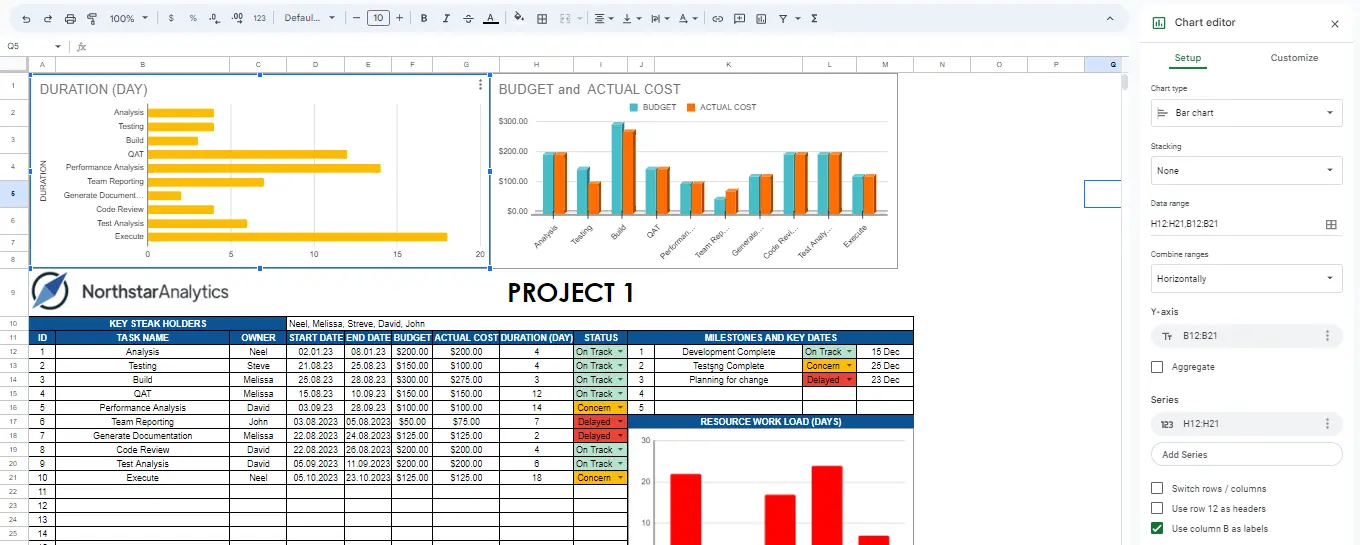
Click on the chart you want to edit. Once clicked, you will see three dots in the top-right corner. After clicking the dots, select 'Edit chart' from the options that appear.
Once clicked, the chart editor will open, allowing you to make edits to the chart.
What are colored cells?
Colored cells have conditional formatting, which makes it easy for you to focus on the data.
After hovering over the colored column and right-clicking, a list will appear. When you hover over the 'view more cell actions' option in that list, you can access a submenu where you can select 'conditional formatting'.
Alternatively, you can click on the Conditional Formatting option from the Format tab.
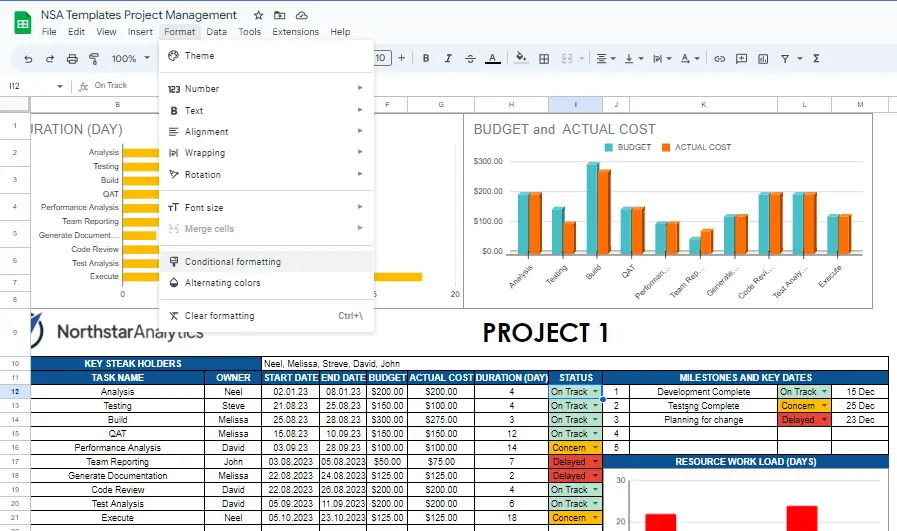
By clicking on this option, you can make necessary adjustments (Add rule, edit rule, delete rule) or explore the features of conditional formatting
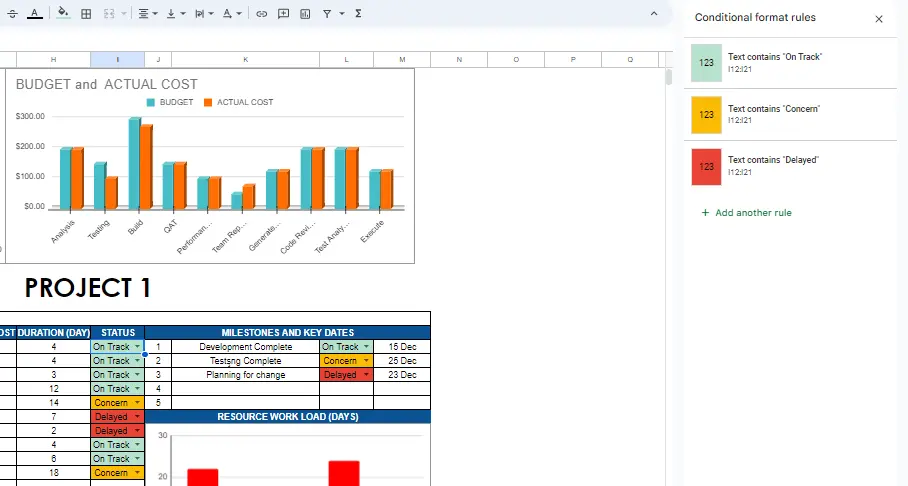
For the "Status" column values, It appears that there is a conditional formatting rule that sets the background color of a cell to green if the value contains rows I2:I21 is 'On track', yellow if it is " Concern" and red if it is 'Delayed'.