Financial Management System Spreadsheet Template
Efficient financial management is crucial to the success of any business, regardless of its size or industry.
Keeping track of your financial data and making informed decisions based on that information can be a daunting task, especially for small businesses with limited resources. However, with the help of a comprehensive financial management system spreadsheet template, managing your finances can become a breeze.
This comprehensive spreadsheet is designed to provide you with a clear and concise overview of your Financial data, allowing you to make informed decisions about your business.
You can watch the YouTube video below if you don't want to read the whole page. Let's start.
HOME PAGE
The Home page is an overview of your financial situation. It provides a snapshot of your income, expenses, savings, debt, and budget.
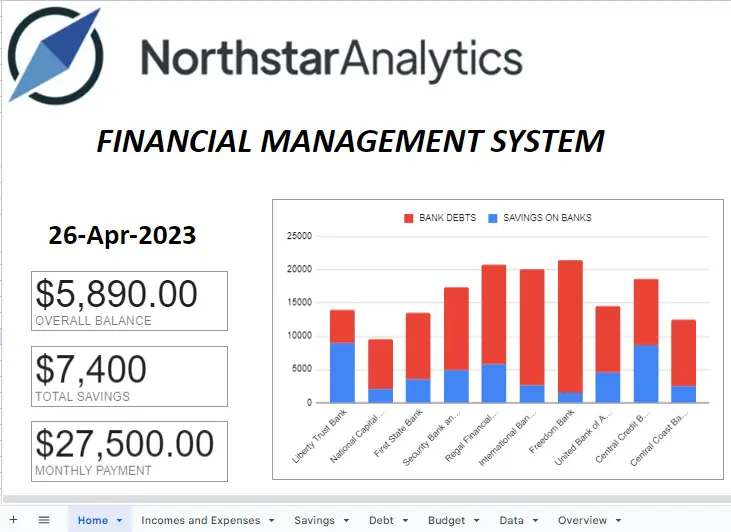
To get today's date on this page, simply type =TODAY() in the formula bar on the left top side of the page. You can customize the appearance of the cell by merging cells and using formatting tools. To view the formula and formatting options, click on the cell.
The "OVERALL BALANCE" scorecard chart shows the sum of data from the "OVERALL BALANCE" column in the table located on the Incomes and Expenses page.
The "TOTAL SAVINGS" scorecard chart shows the sum of data from the "TOTAL SAVINGS" column in the table located on the Savings page.
The "MONTHLY PAYMENT" scorecard chart shows the sum of data from the "MONTHLY PAYMENT" column in the table located on the Debt page.
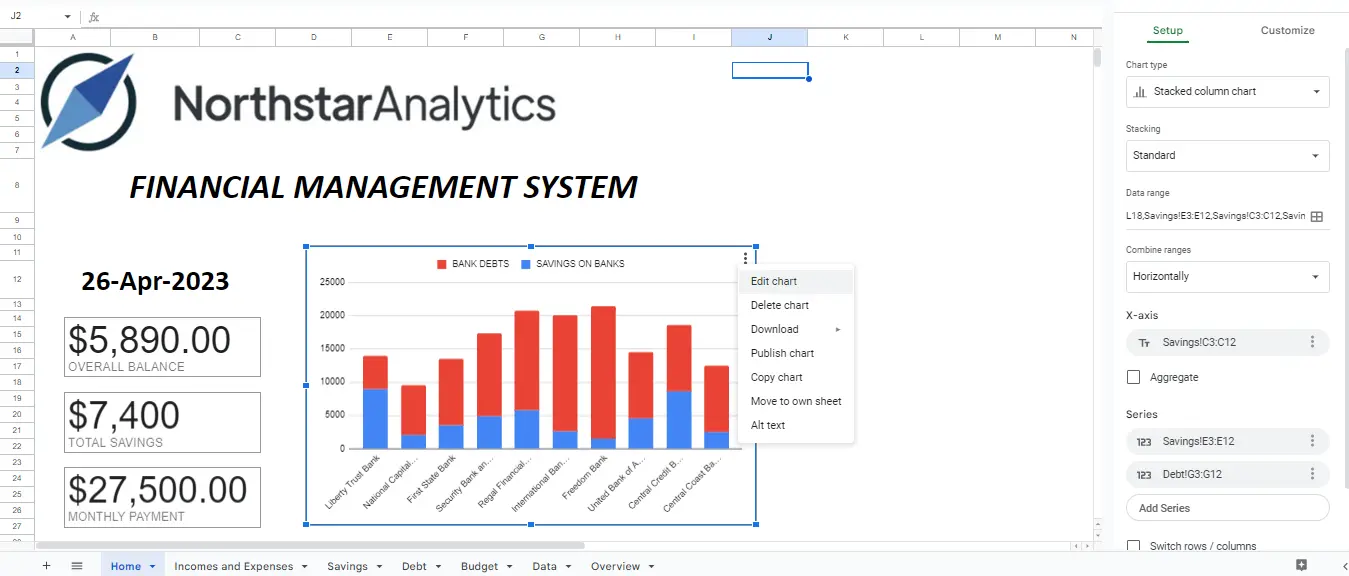
The stacked column chart displays the total amount of BANK DEBTS and the SAVINGS ON BANK's values of the bank. The names of the bank come from the BANK NAME column on the Savings page, the BANK DEBTS values come from the TOTAL AMOUNT DUE column on the Debt page, and the SAVINGS ON BANK's values come from the ACCOUNT BALANCE column on the Savings page.
When you click on the graph, three dots will appear, and by clicking on them, you can access the editing options by selecting 'Edit chart.' This allows you to make any desired changes to the graph.
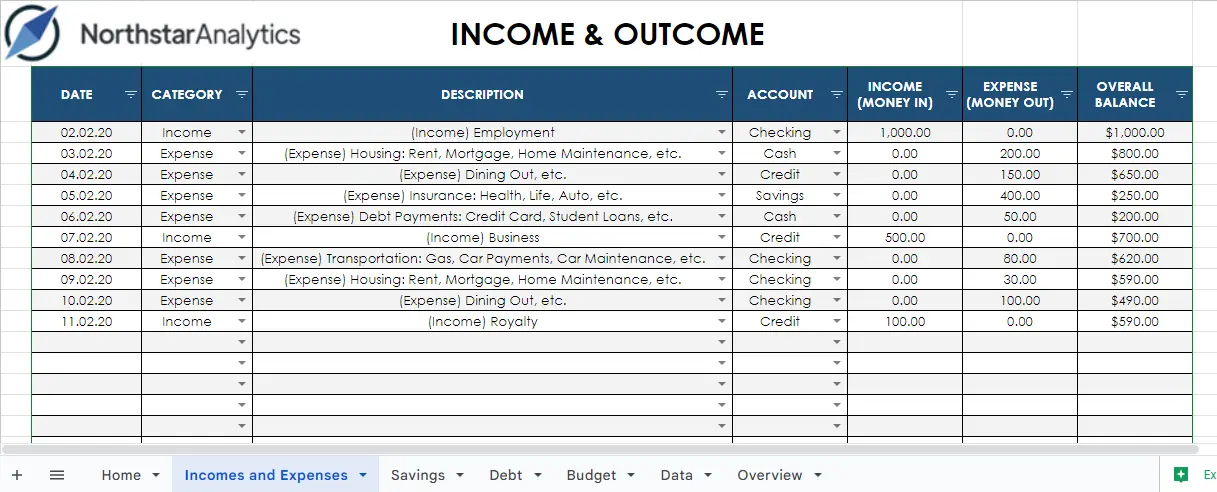
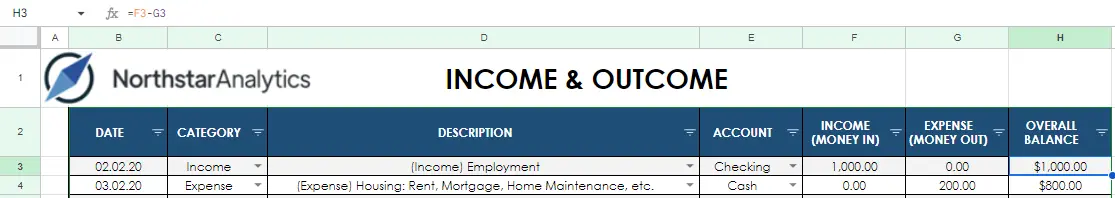
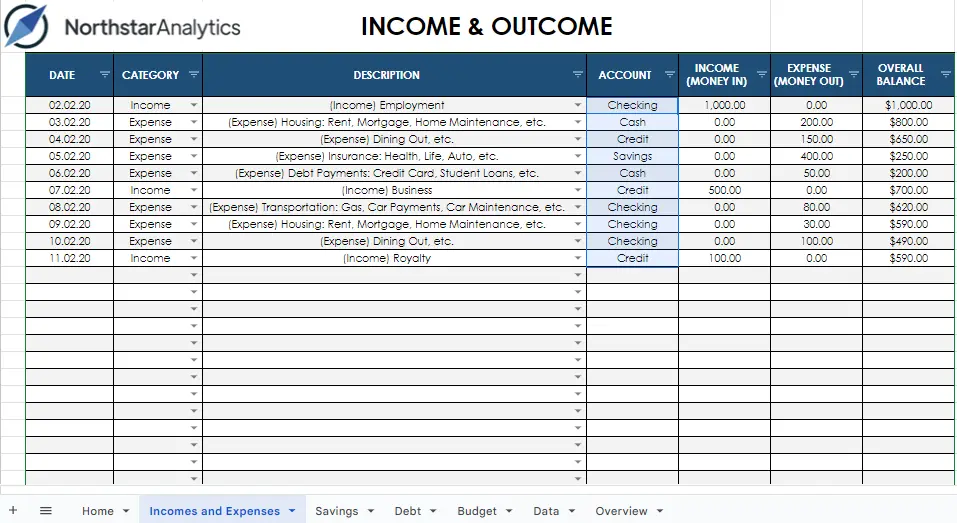
Incomes and Expenses Page
This sheet allows you to track all of your income and expenses in one place. You can enter your income and expenses for a given period.
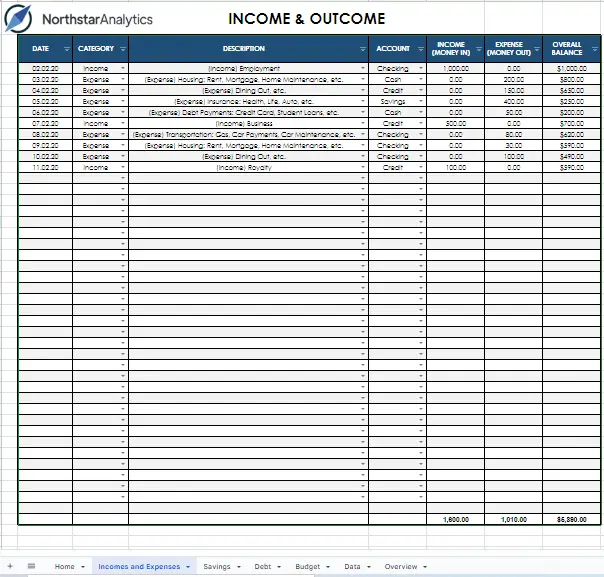
- DATE: This column is used to record the date of each income or expense transaction.
- CATEGORY: This column is used to categorize the transactions as either income or expense.
- DESCRIPTION: This column is used to provide a brief description of each transaction.
- ACCOUNT: This column is used to record the account name that the transaction is associated with, such as a bank account or credit card.
- INCOME (MONEY IN): This column is used to record the amount of money received as income.
- EXPENSE (MONEY OUT): This column is used to record the amount of money spent as an expense.
- OVERALL BALANCE: This column is used to calculate the overall balance of the account by subtracting the total expenses from the total income.
Savings Page
The Savings sheet helps you to keep track of your savings goals and progress. You can enter the amount of money you want to save and track your progress over time.
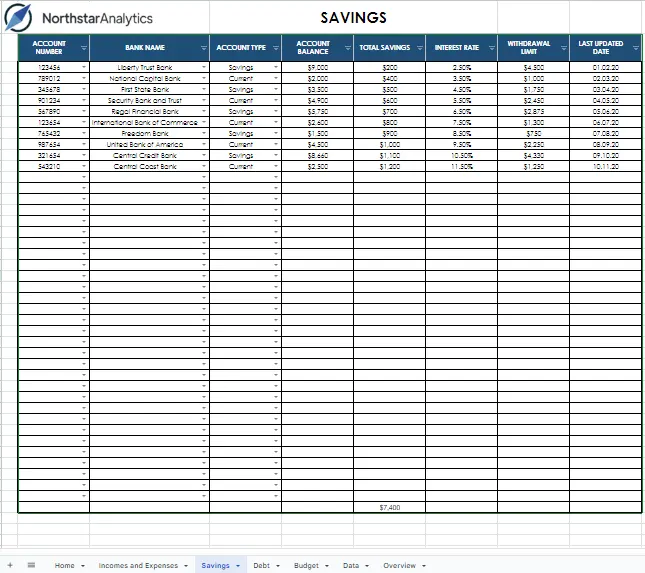
- ACCOUNT NUMBER: This column represents the unique identification number assigned to each bank account.
- BANK NAME: This column displays the name of the bank where the account is held.
- ACCOUNT TYPE: This column provides a selectable data value for the type of account (i.e., Checking, Cash, Credit, Savings, and Current).
Checking: A checking account is a bank account that is used to deposit and withdraw money frequently. It typically offers check-writing privileges, debit card access, and may or may not earn interest on the balance.
Cash: A cash account is a simple bank account used for the deposit and withdrawal of physical cash. It usually does not come with any interest-earning benefits.
Credit: A credit account is a type of loan account that allows the account holder to borrow money from the bank and pay it back with interest over time.
Savings: A savings account is a bank account designed to help account holders save money by earning interest on the balance. It generally has fewer withdrawal options than a checking account.
Current: A current account is a type of bank account that is primarily used for business transactions. It typically has higher fees and minimum balance requirements than other account types, but offers a wider range of services and more flexible withdrawal options.
- ACCOUNT BALANCE: This column shows the current balance available in the account.
- TOTAL SAVINGS: This column displays the total savings amount in the account.
- INTEREST RATE: This column represents the interest rate applied to the account balance.
- WITHDRAWAL LIMIT: This column displays the maximum amount that can be withdrawn from the account within a specific period.
- LAST UPDATED DATE: This column shows the most recent date on which the account information was updated.
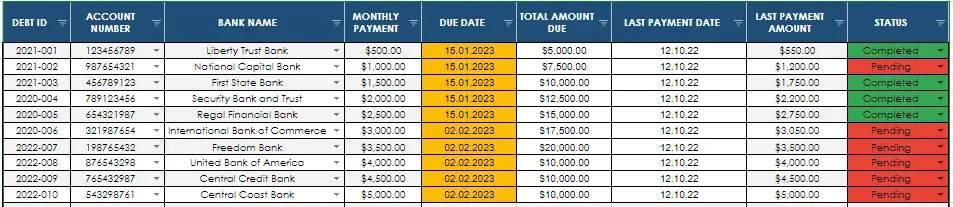
Debt Page
The Debt sheet allows you to track your current debts and payments. You can enter your current debts, interest rates, and payment amounts.
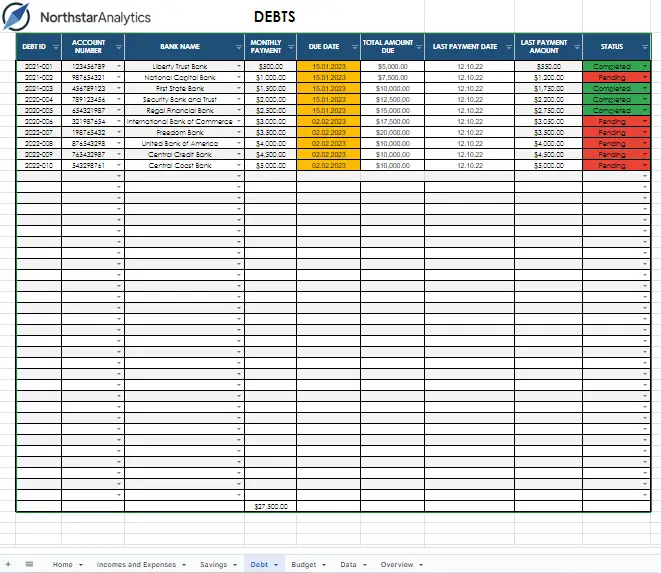
- This column stores unique identifiers for each debt, following the format of YYYY-XXX (e.g., 2021-001, 2020-005). It helps to distinguish and track individual debts.
- ACCOUNT NUMBER: In this column, you can find the account numbers associated with each debt. It serves as a reference for identifying the specific account related to the debt.
- BANK NAME: The "Bank Name" column indicates the name of the financial institution or bank that issued the debt. It helps identify the creditor responsible for the debt.
- MONTHLY PAYMENT: This column displays the amount of money that needs to be paid each month towards the debt. It represents the regular installment or payment required by the debtor.
- DUE DATE: The "Due Date" column specifies the date by which the monthly payment for the debt should be made. It indicates the deadline or the last day to pay the installment.
- TOTAL AMOUNT DUE: In this column, you can find the total outstanding balance or the total amount owed for each debt. It represents the cumulative debt amount that needs to be paid off.
- LAST PAYMENT DATE: This column records the date of the most recent payment made towards the debt. It helps track the timeline of payments and provides an overview of the payment history.
- LAST PAYMENT AMOUNT: The "Last Payment Amount" column shows the specific amount that was paid during the most recent payment made towards the debt. It provides information about the recent payment transaction.
- STATUS: The "Status" column indicates the current state or condition of the debt. It can include categories such as "Completed" "Overdue," "Pending," or "Defaulted," reflecting the status of the debt at a given point in time.
Colored cells have conditional formatting, which makes it easy for you to focus on the data.
After hovering over the colored column and right-clicking, a list will appear. When you hover over the 'view more cell actions' option in that list, you can access a submenu where you can select 'conditional formatting'.
Alternatively, you can click on the Conditional Formatting option from the Format tab.
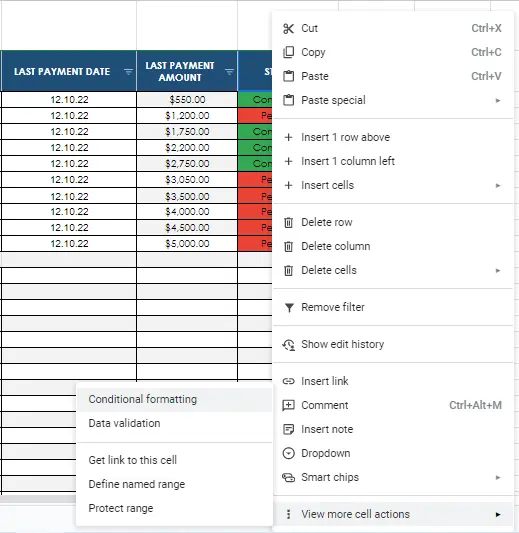
By clicking on this option, you can make necessary adjustments (Add rule, edit rule, delete rule) or explore the features of conditional formatting
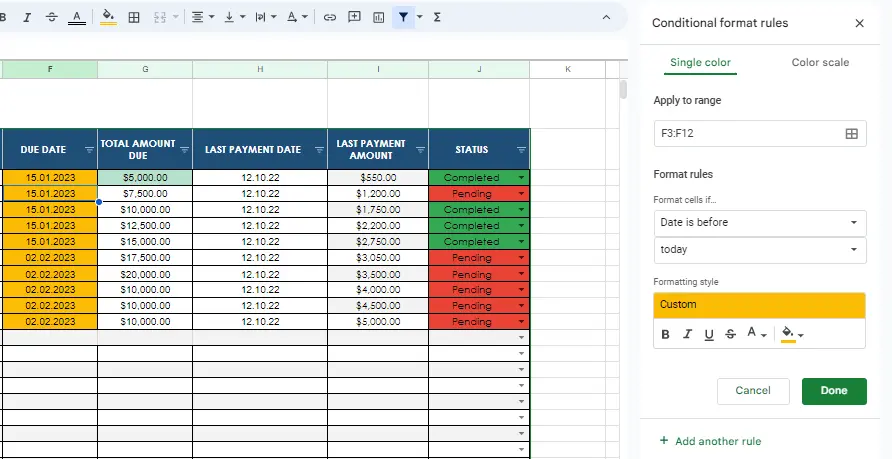
For the "Due Date" column values, It appears that there is a conditional formatting rule that sets the background color of a cell to yellow if the date value in column F, between rows F3:F12, is a date before today.
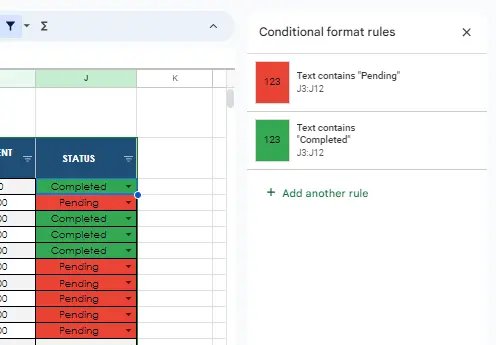
For the "Status" column values, It appears that there is a conditional formatting rule that sets the background color of a cell to green if the value between rows J3:J12 is 'completed' and red if it is 'pending'
Budget Page
The Budget sheet allows you to create a budget for yourself. You can enter your income, expenses, and savings goals.
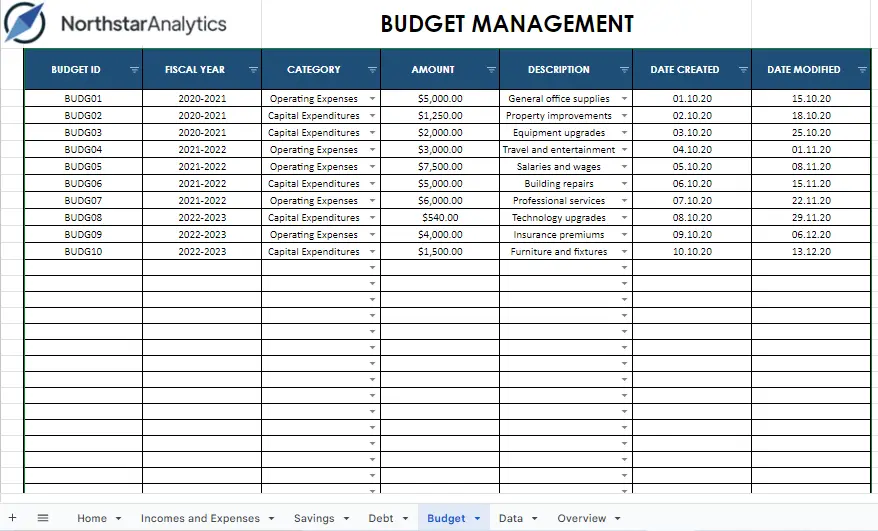
- BUDGET ID: This column represents the unique identifier or code assigned to each budget entry. It helps in identifying and organizing different budget items within the financial management system.
- FISCAL YEAR: The fiscal year column denotes the specific period for which the budget is allocated or being tracked. It provides a reference to the financial year during which the budget is applicable.
- CATEGORY: The category column categorizes the budget entries into different groups or classifications based on their nature or purpose. It helps in organizing and analyzing budget data according to specific categories such as marketing, operations, research, etc.
- AMOUNT: The amount column indicates the monetary value allocated or associated with each budget entry. It represents the allocated budget for a specific category or expense.
- DESCRIPTION: The description column provides a brief explanation or summary of each budget entry. It allows for additional details or context to be included, such as the purpose of the budget allocation or any specific instructions or notes related to the entry.
- DATE CREATED: The date created column indicates the date when each budget entry was initially created or added to the system. It helps in tracking the timeline and maintaining a record of when the budget entries were established.
- DATE MODIFIED: The date modified column represents the date when any modifications or changes were made to a particular budget entry. It enables tracking the history of modifications, ensuring transparency and accountability in budget management.
Data Page
The Data sheet allows you to view all of your financial information in a single place. You can view your income, expenses, savings, debt, and budget.
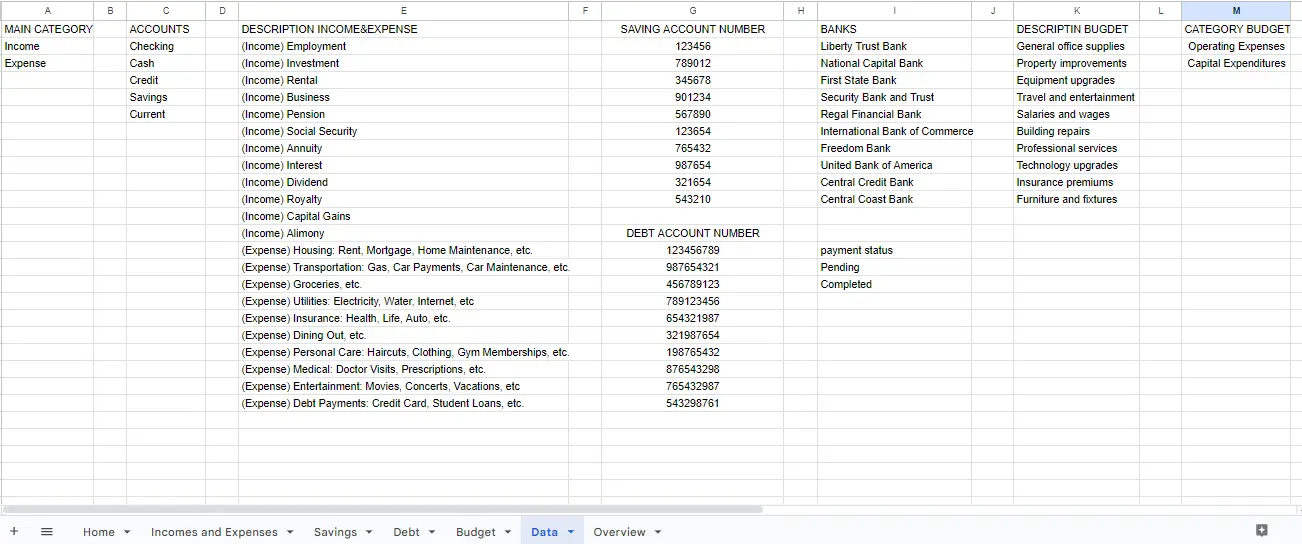
- MAIN CATEGORY: This column represents the main categories of income and expenses. It helps classify and organize different types of financial transactions into broader categories.
- ACCOUNTS: The ACCOUNTS column contains various types of accounts such as Checking, Cash, Credit, Current, and Savings. These accounts are used to track and manage different financial resources or instruments.
- DESCRIPTION INCOME&EXPENSE: This column provides a description or additional information related to the income and expense transactions. It helps provide context or details about each transaction recorded in the table.
- SAVING ACCOUNT NUMBER: This column is specifically used to record the account numbers associated with savings accounts. It allows for easy reference and tracking of savings-related transactions.
- DEBT ACCOUNT NUMBER: The DEBT ACCOUNT NUMBER is used to record the account numbers linked to debt accounts. It helps monitor and manage financial obligations, such as loans or credit card debts.
- BANKS: The BANK contains information about the banks or financial institutions associated with the accounts mentioned in the table. It helps identify the institutions where the accounts are held.
- PAYMENT STATUS: This indicates the payment status of each transaction, distinguishing between "Pending" and "Completed." It allows for easy tracking of pending and completed payments.
- DESCRIPTION BUDGET: This provides descriptions or details related to budgeting. It can include information about specific budget categories, financial goals, or any other relevant details related to the budgeting process.
- CATEGORY BUDGET: The CATEGORY BUDGET represents the categories or classifications used for budgeting purposes. It helps allocate and track expenses according to specific budget categories, allowing for better financial planning and control.
The sheets contain an excessive number of dropdown cells, which offer the same data as related cells without the need for rewriting, thus saving you time. The data in the dropdown lists can be easily deleted, added, or edited directly from the DATA sheets in each file.
How to create dropdown cells?
Let's assume that you want to add your customer data to the customer table and make it selectable in the customer name column.
Create the ACCOUNTS header and paste your account data.
Note: If the data includes formatting, you can select "paste values only " from the paste options.

Navigate to the table you want to connect your data to and select the cells you want to connect.
Choose data validation from the data tab.
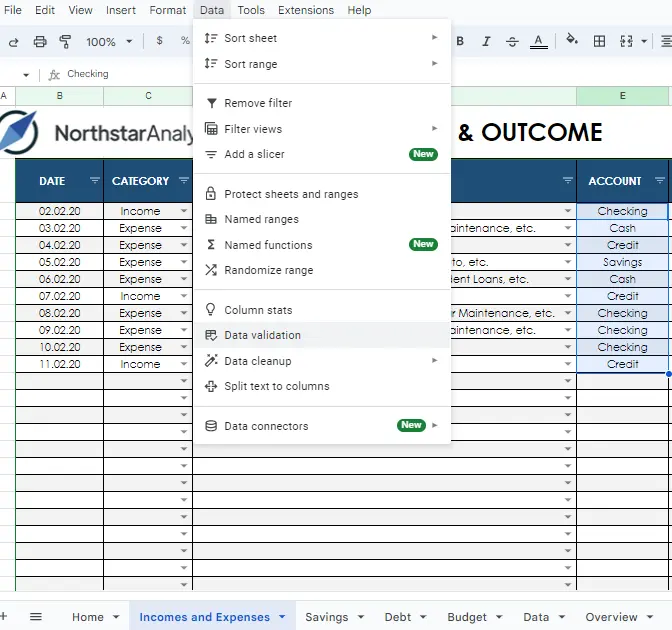
Select "add a rule" from the window that pops up.
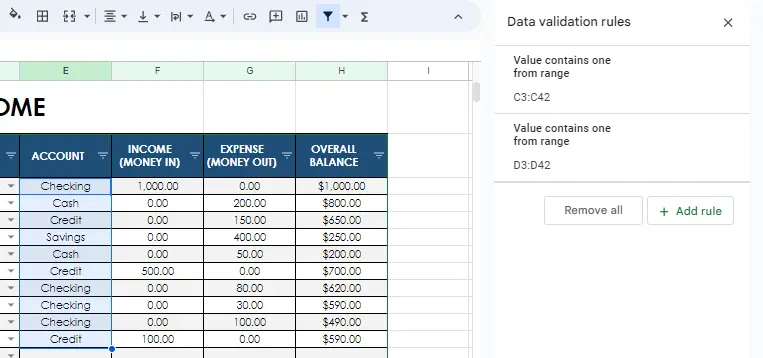
The applied field automatically appears as the field we selected. Under "criteria", select "from a range" from the dropdown menu. Hover over the box and click "Select data range".
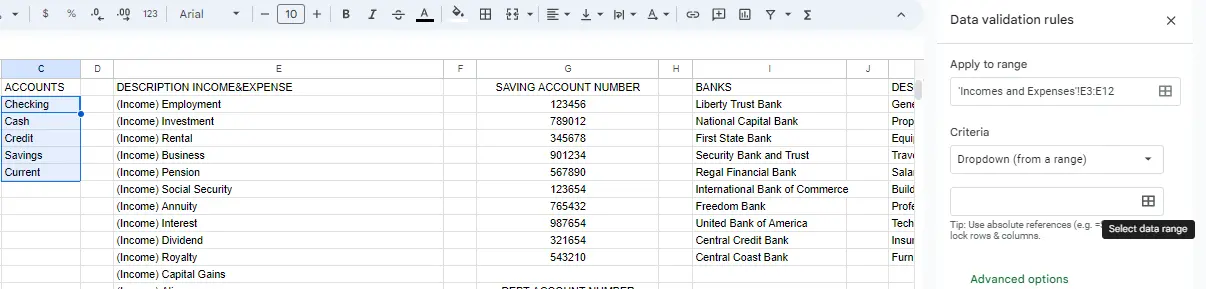
Go to the data page and select your source data.
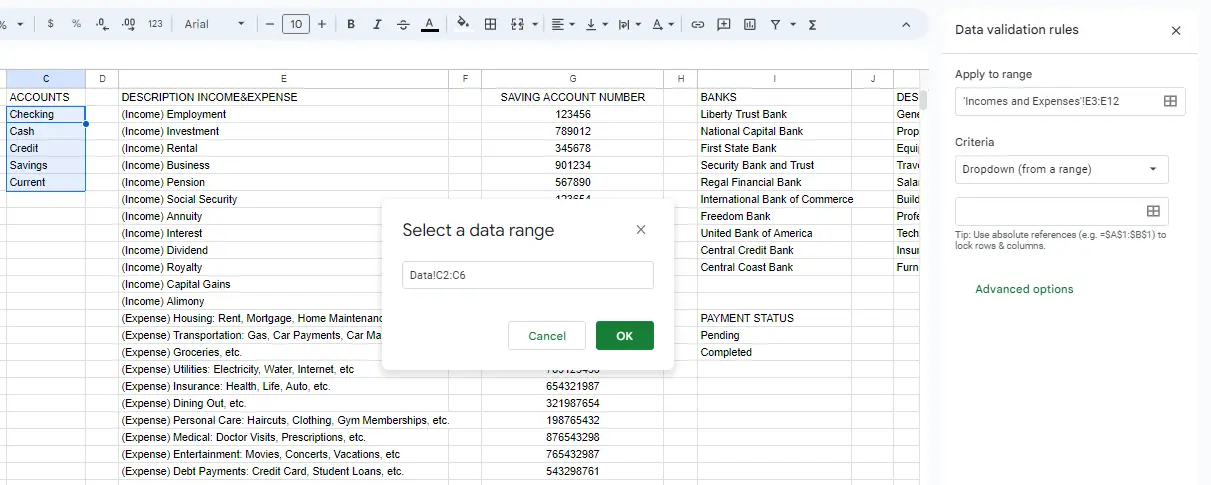
The window that pops up will be automatically filled based on the cells you selected. Then click OK.
Advanced options allow you to make adjustments. I chose to display it as an arrow in the Display Style because I wanted it to look like the others.
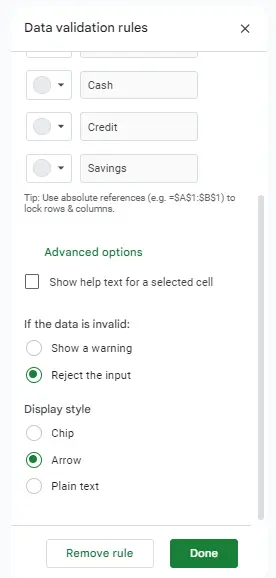
After making the necessary adjustments, click Done. It's ready now.