How to use Klaviyo Analytics Dashboard?

Klaviyo is one of the great email marketing software in the globe. Also, it provides a great feature under "Dashboard" section. This section's aim is only to give you insight into your email marketing efforts.
Creating a new view
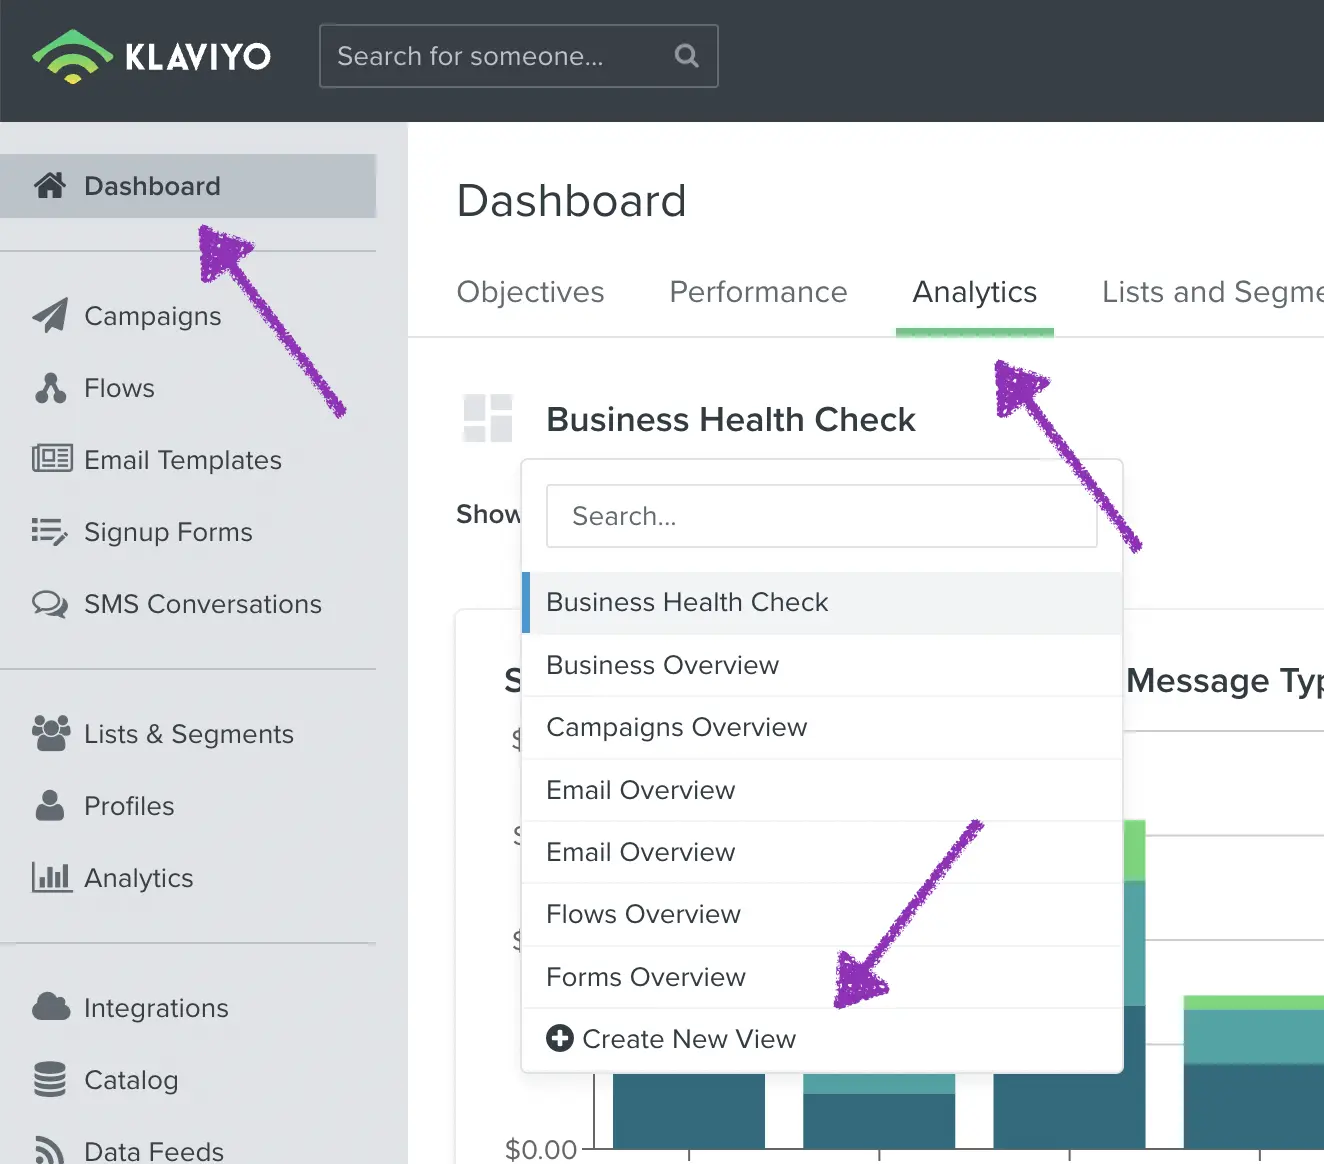
We will start with creating a view. Please click Dashboard → Analytics → Create a New View
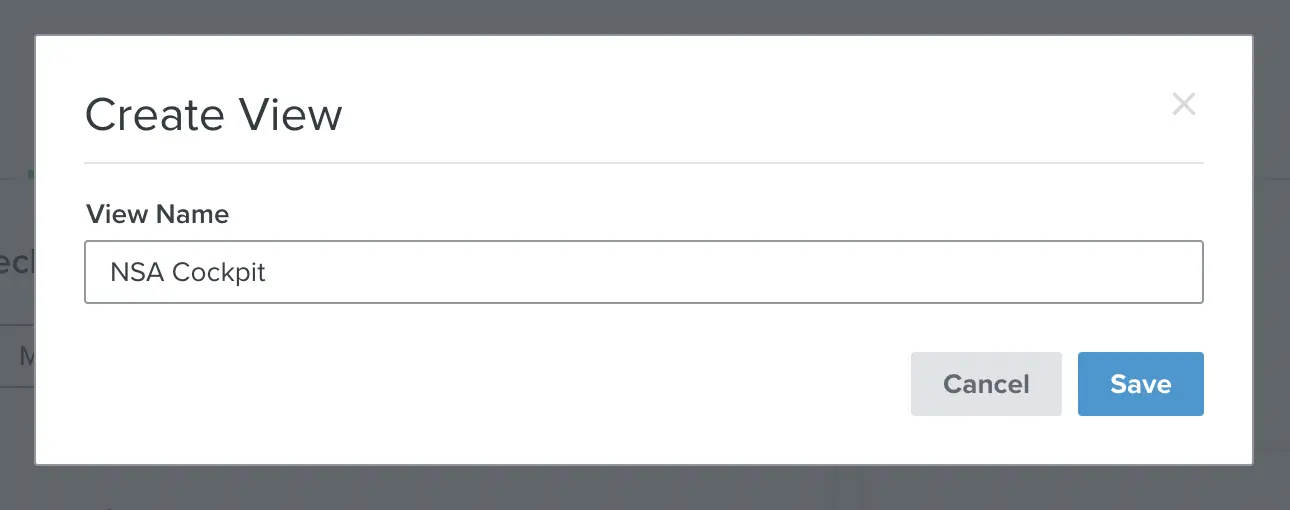
Please consider that this dashboard may be used by other colleagues or departments in your company. That is because you should give a proper name for later access.
Add a new card
Widgets are "Cards" in Klaviyo's terminology. Please have a look at the top right part of the dashboard to add a new card. You should see the blue button.
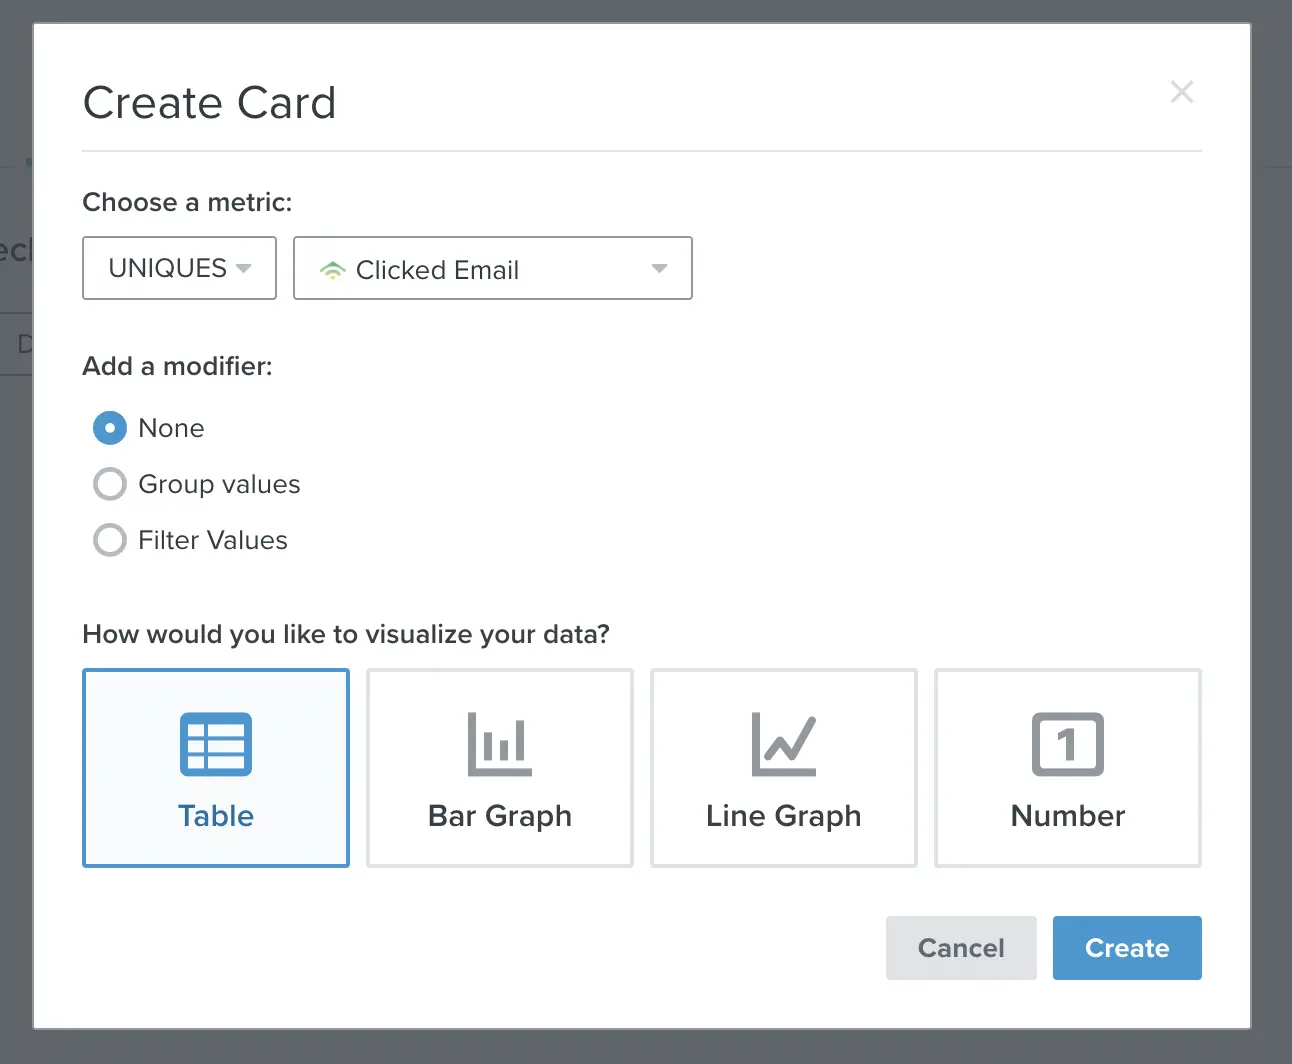
You'll see the below popup. Let's look at every part of this popup to cover all the capabilities of the Klaviyo dashboard feature.
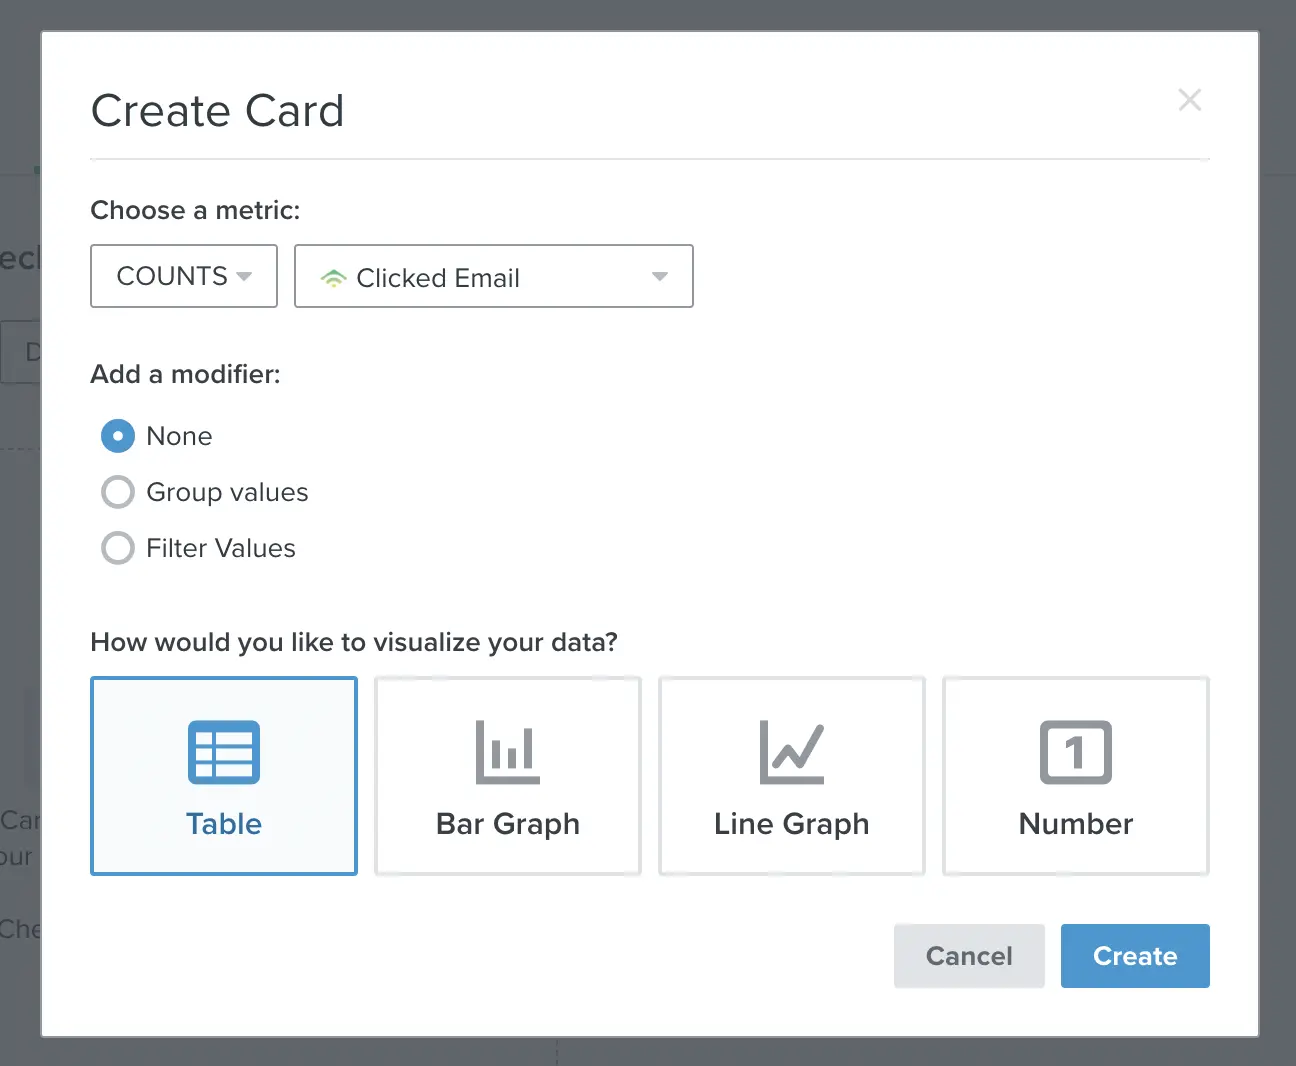
Choosing a metric
Klaviyo has standard email marketing metrics as other emailing tools such as:
- When an email soft or hard bounced → Bounced Email
- When a recipient clicked an email → Clicked Email
- When a recipient marks an email as spam → Marked Email as Spam
- When a recipient opens an email → Opened Email
- When a recipient receives an email → Received Email
- When someone opts in to a list → Subscribed to a List
- When someone unsubscribes from emails globally → Unsubscribed
- When someone unsubscribes from a specific list → Unsubscribed from List
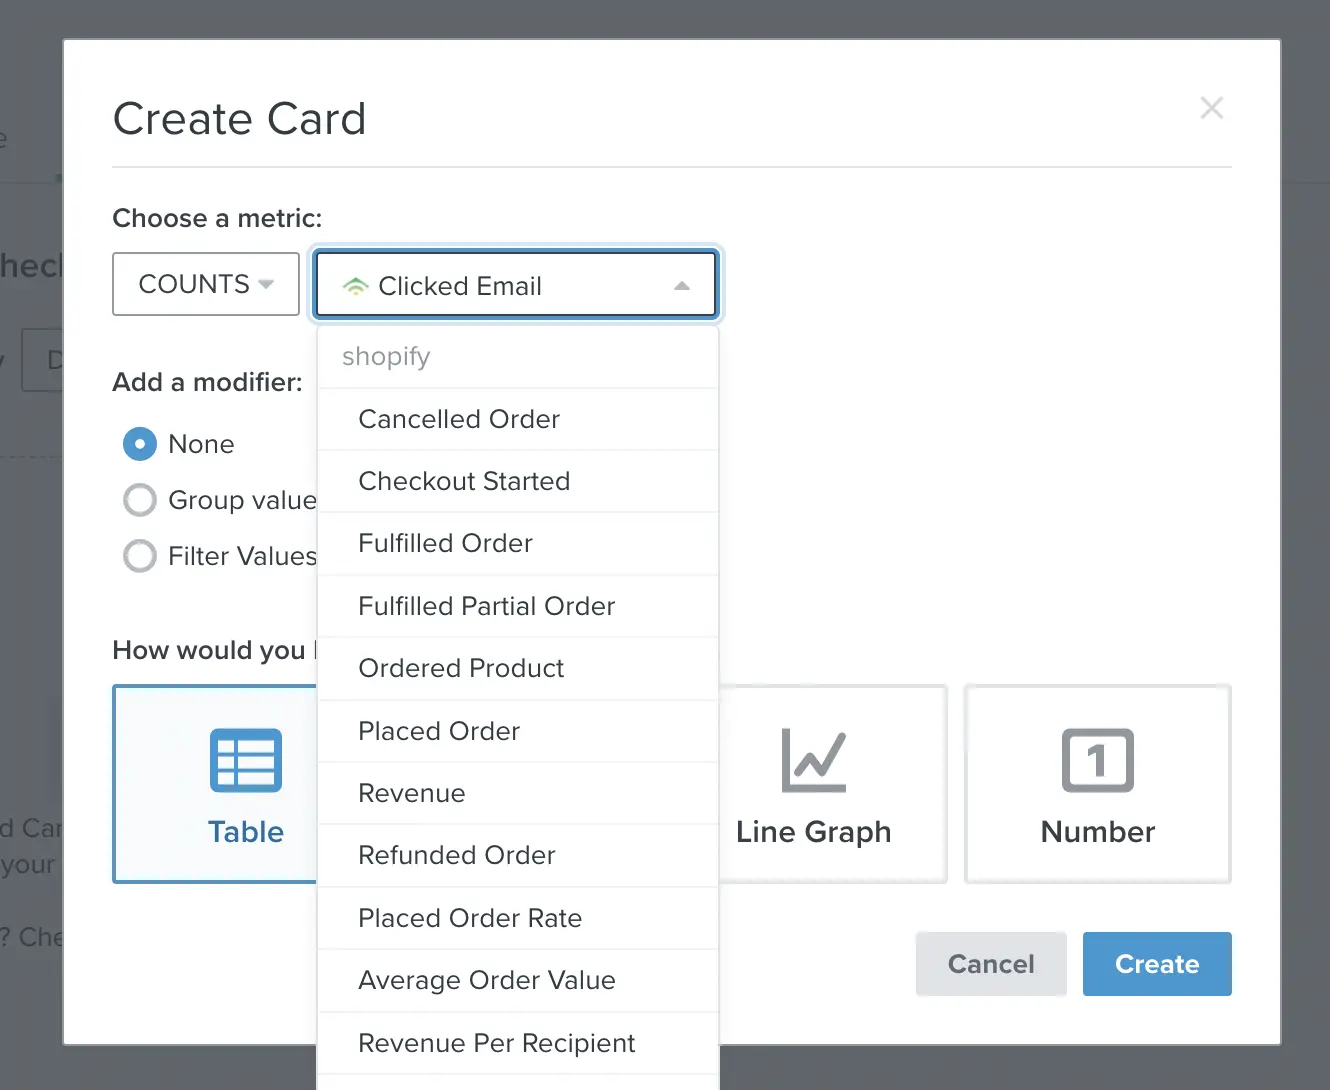
Also, you can access other tools' metrics if they are linked with Klaviyo. The below metrics are coming from Shopify linking:
- Checkout Started: This event is tracked when a customer enters his/her contact and shipping information on the first page of the Shopify checkout process and clicks continue.
- Placed Order: This event is tracked when a customer completes the checkout process and creates an order in your Shopify store.
- Ordered Product: This event is also tracked when a customer places an order, but a separate event is tracked for each item someone purchases.
- Fulfilled Order: This event is tracked when an order is marked as "fulfilled" in your Shopify store.
- Canceled Order: This event is tracked when a customer creates an order in your Shopify store but then cancels the order before fulfillment.
- Refunded Order: This event is tracked when a customer completes the checkout process in your Shopify store and payment is made, but the customer requests the payment to be returned.
Aggregation
We may need to adjust how to present metrics on the dashboard.
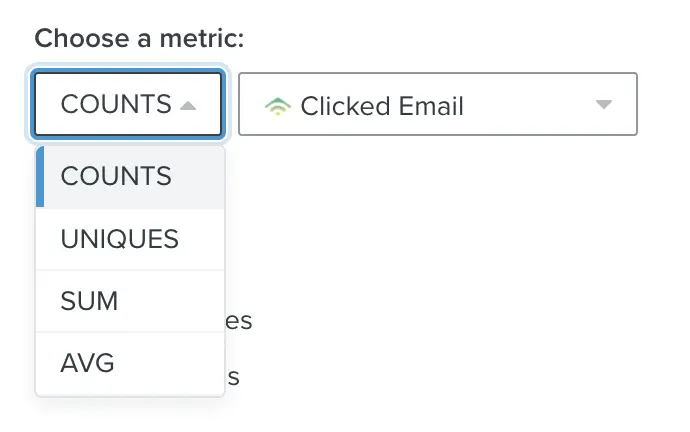
We have 4 basic options here:
- Counts: a count of all events for your selected metric.
- Uniques: a count of all unique events for your selected metric.
- Sum: a summed up value total for all monetary events
- Average: Average number of occurrences in given date granularity (day/week/month/year)
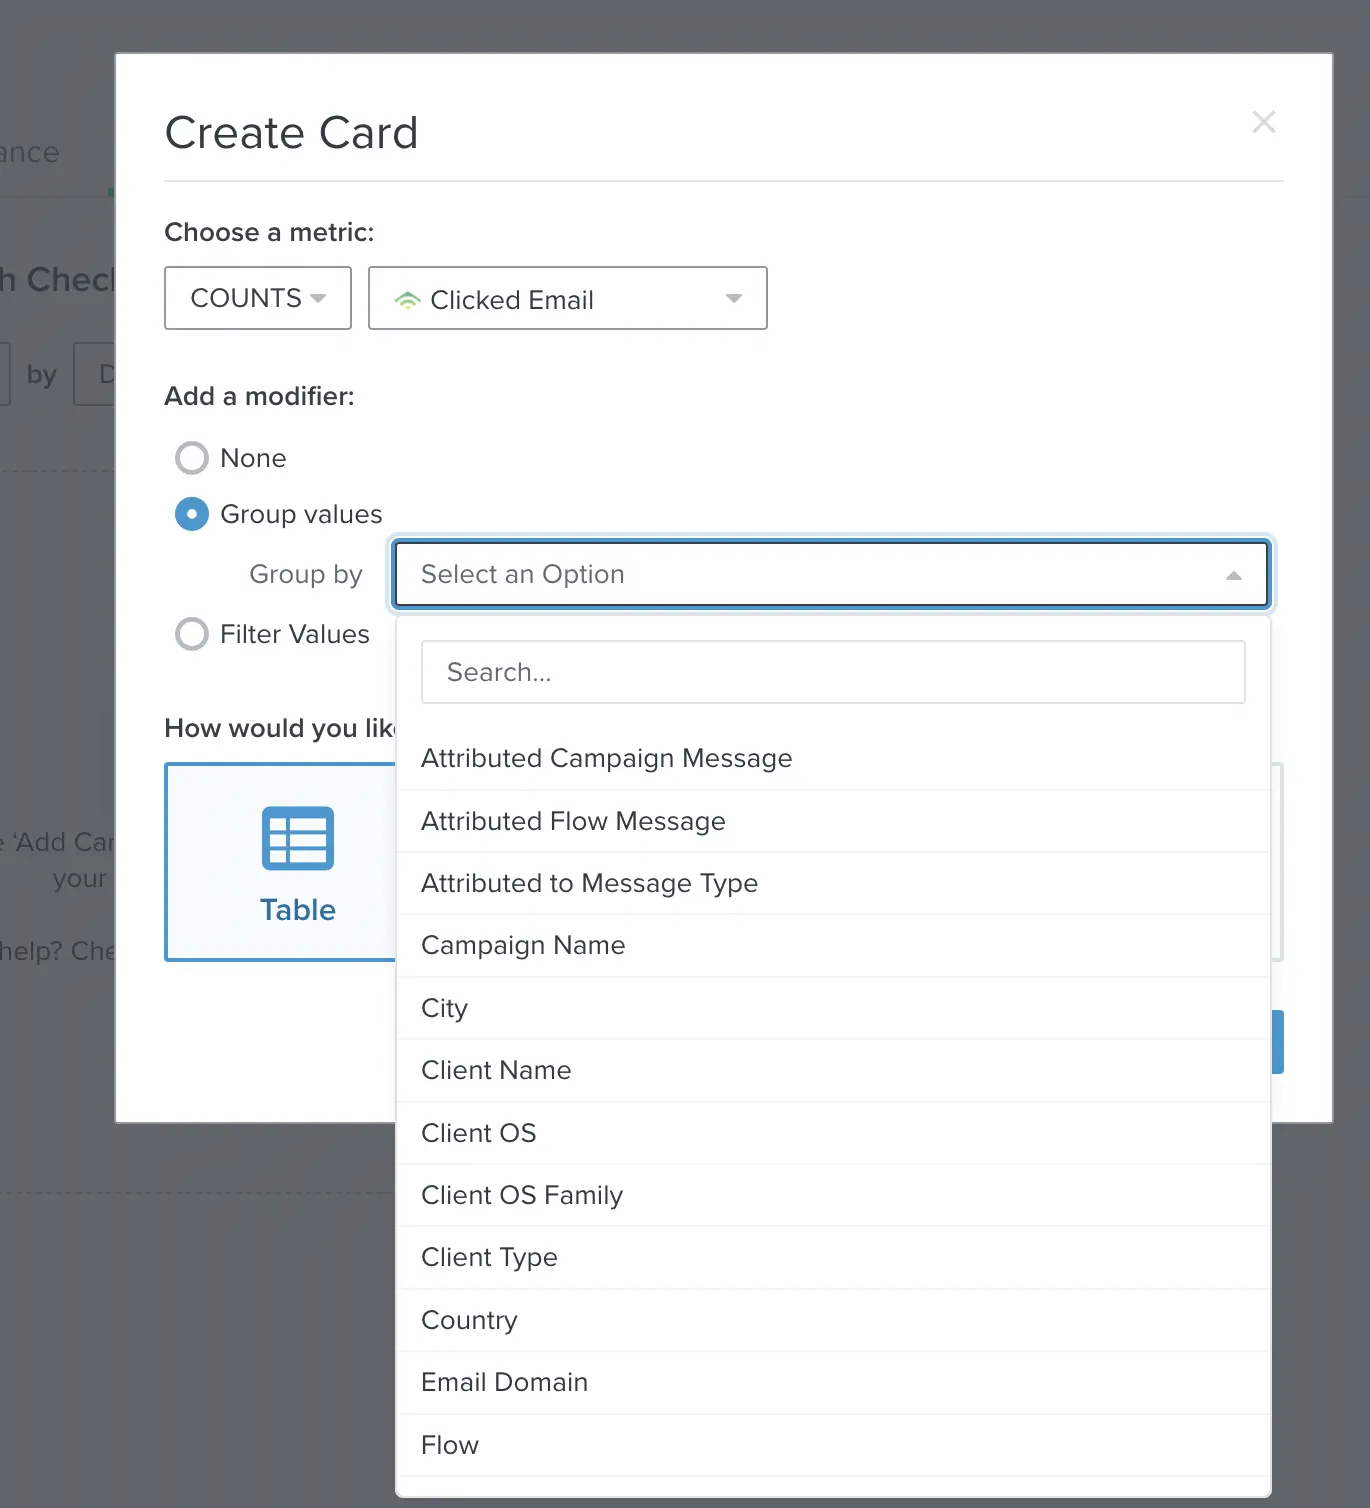
Group and filter metrics
Group data based on a breakdown such as:
- Attributed Campaign Message: Campaign name
- Attributed Flow Message: Flow name
- Attributed to Message Type: Flow, Campaign or not attributed
- City/Country are self-explanatory I believe.
- Campaign/Flow Name: Name of the attributed medium (not message name)
- Message Variation: If you are running A/B testing then, you should see values here.
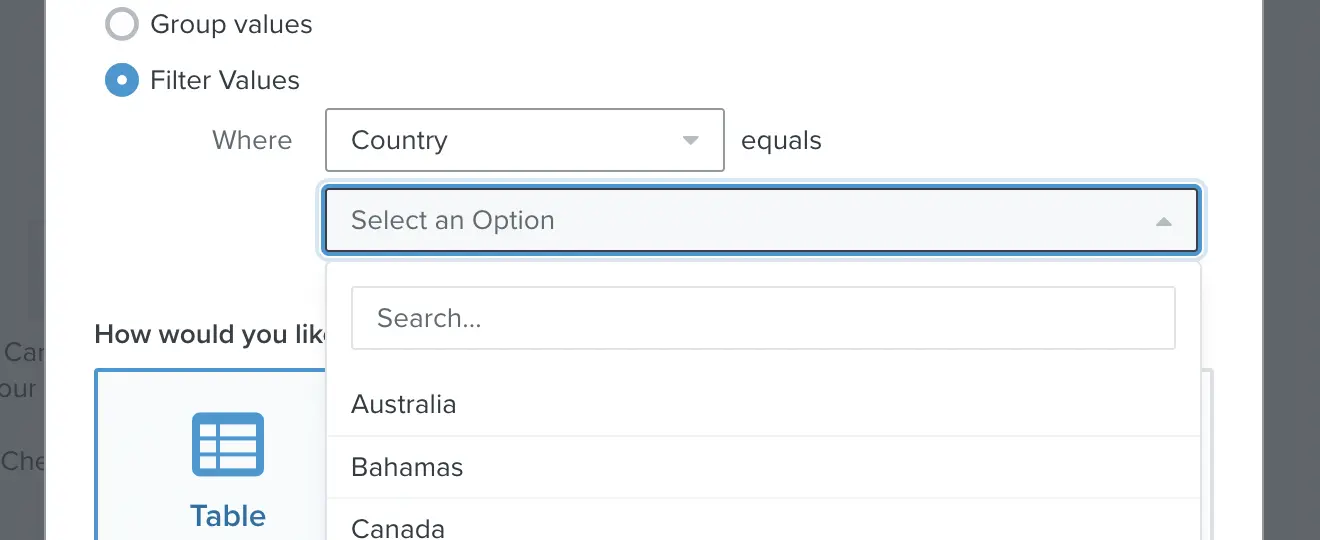
Filter feature uses the same dimensions as the group feature except this has one more dropdown that contains all the relevant values of the selected dimension.
Visualize your data
I'd like to select metrics in this part of this article to not lose your attention and make it easy to follow.
The most straightforward metric is "Clicked Email". Let's continue by choosing this metric.
Number Card
I'd like to show you "Number" visualization since this is the most basic type of data presentation method on the Klaviyo dashboard. The output is very understandable, just unique users who clicked emails.
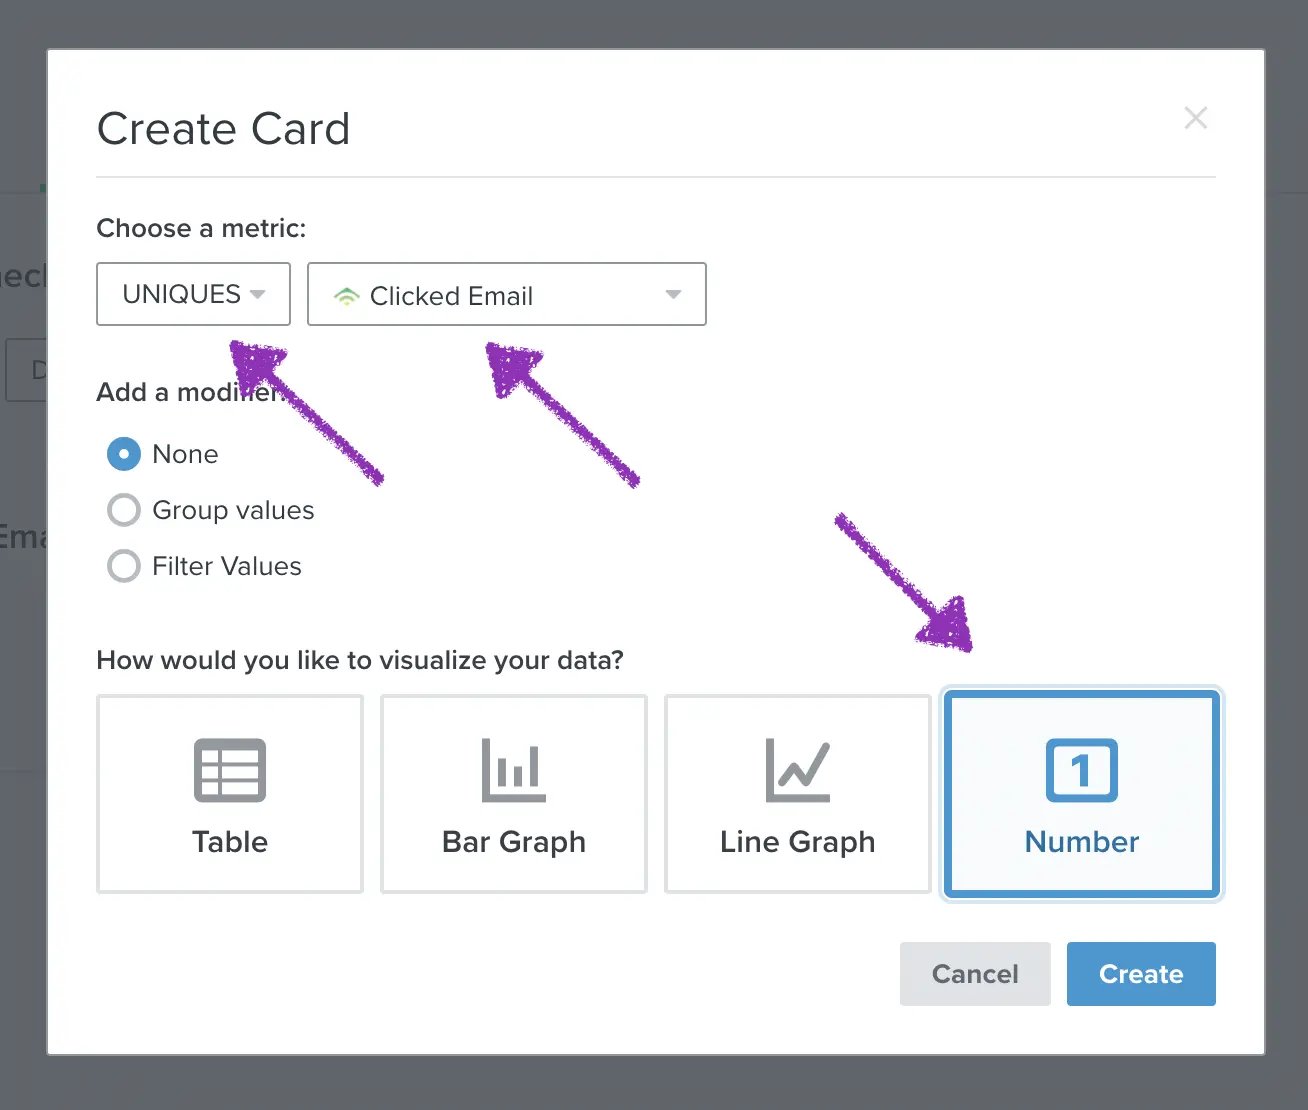
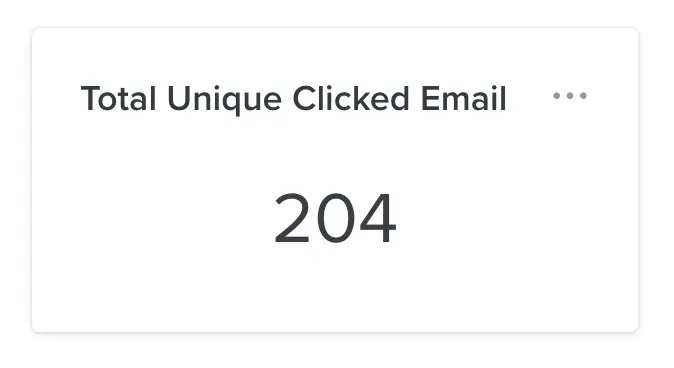
The left images will be always showing the configuration while the right side represents the output.
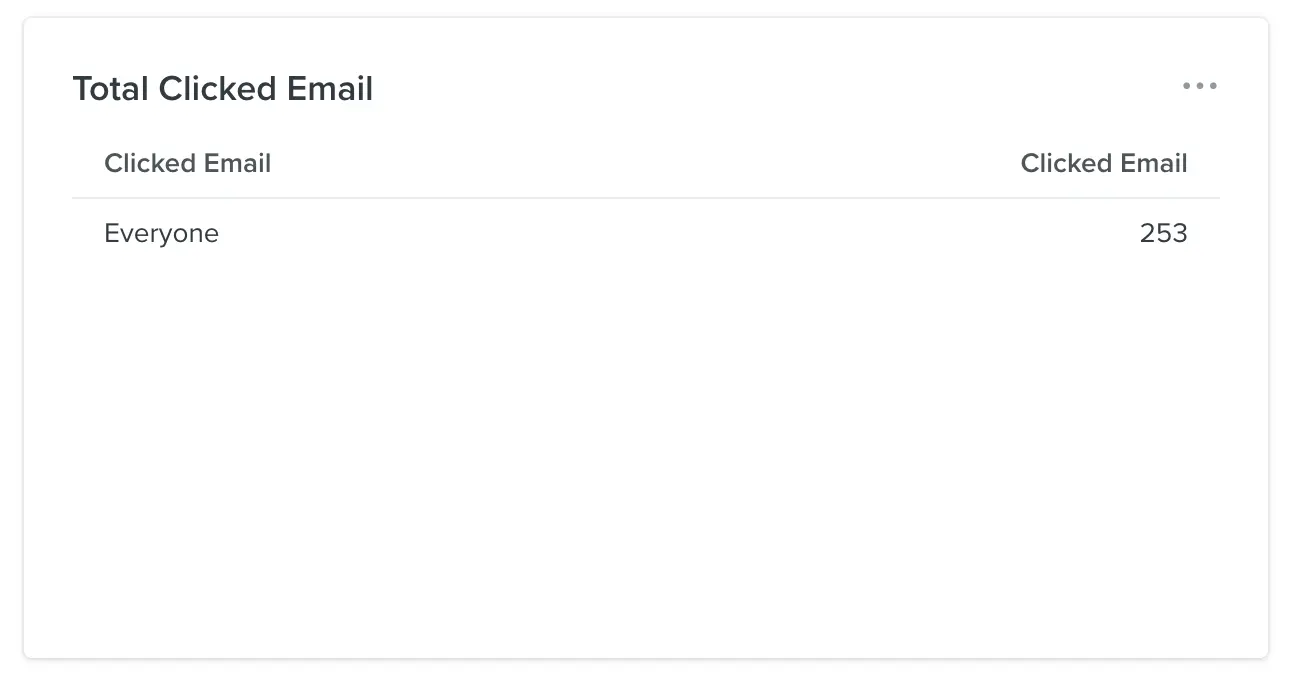
Table Card
Let's select Table visualization without group metrics to see the output. I always love to play around to see the output myself. As you can see below, there is no breakdown on the table.
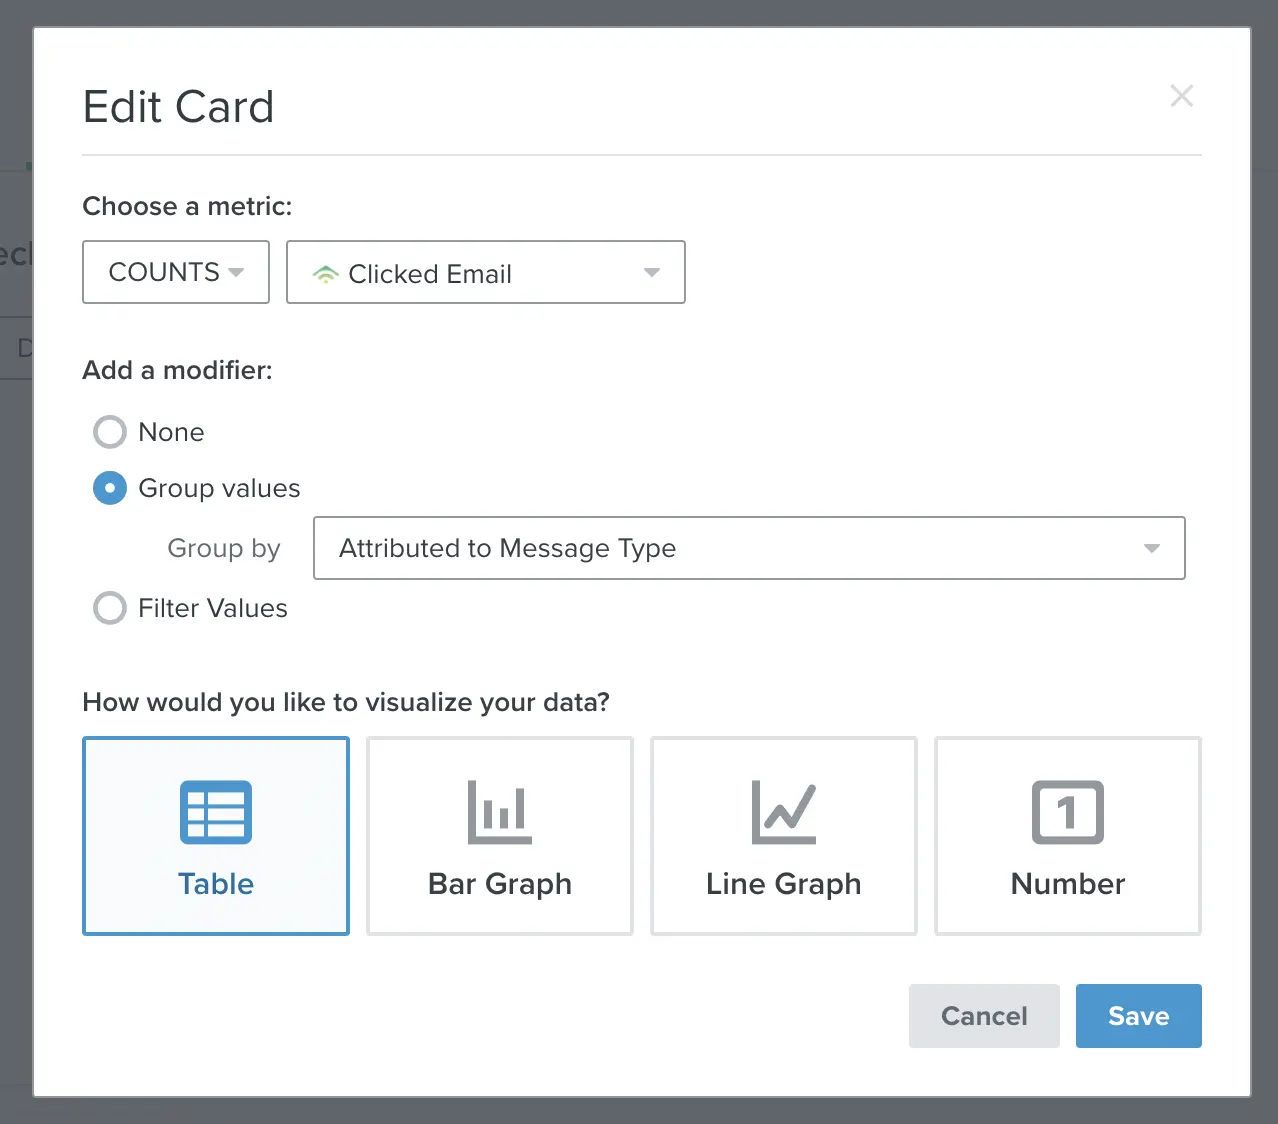
Let's edit the card by clicking the 3 dots and then "Edit".
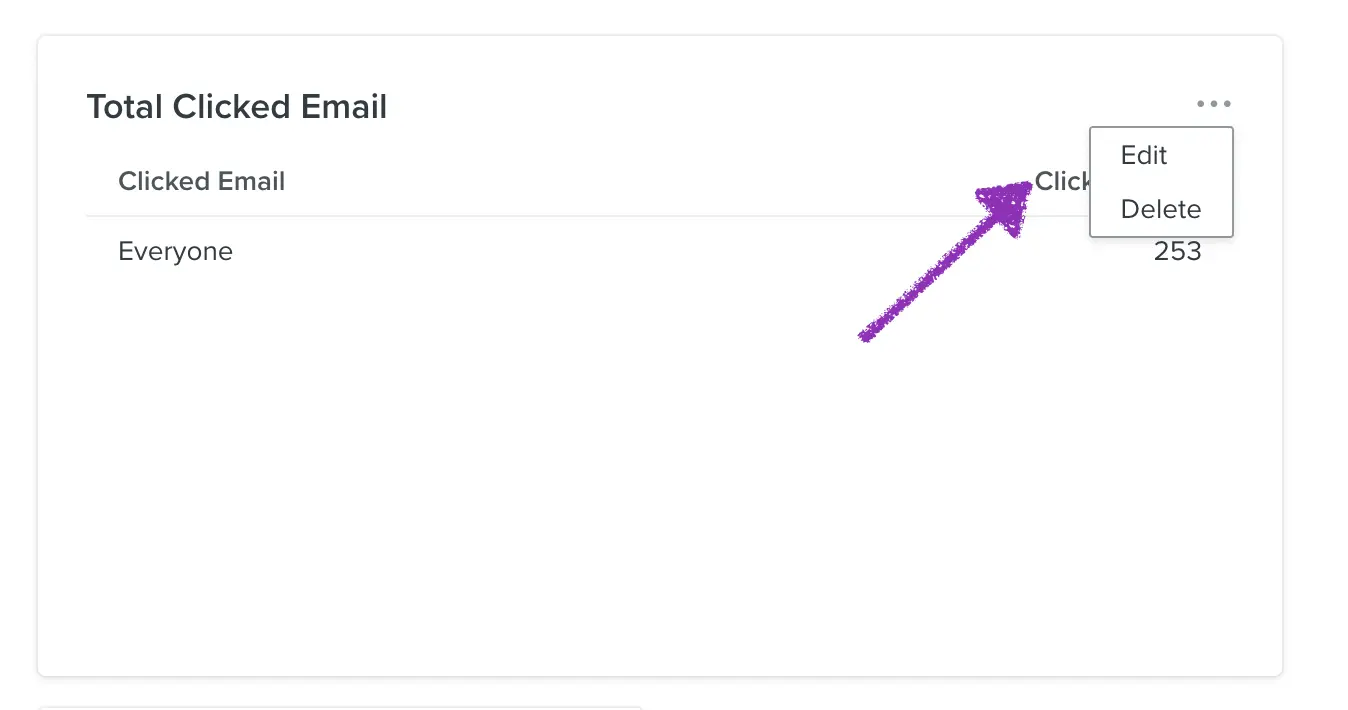
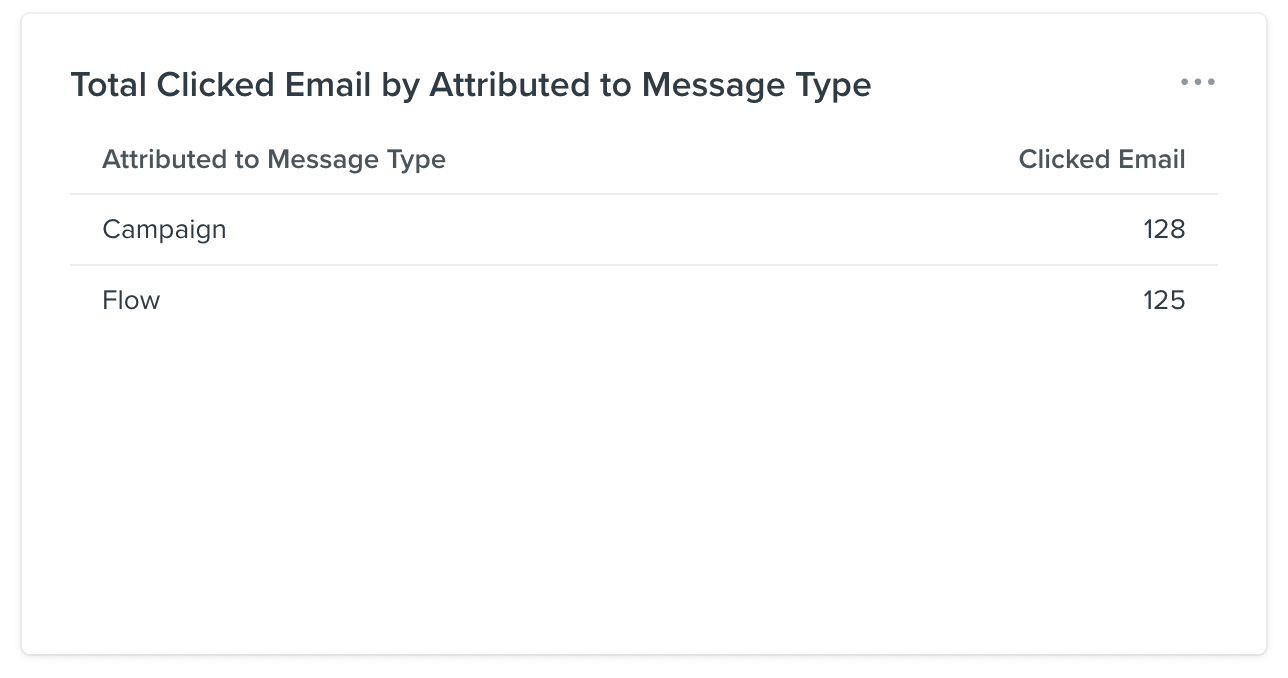
I selected "Attributed to Message Type" and saw the below-right image as the output. You can select any other dimension to change the table or add more than one table on the dashboard as you like.
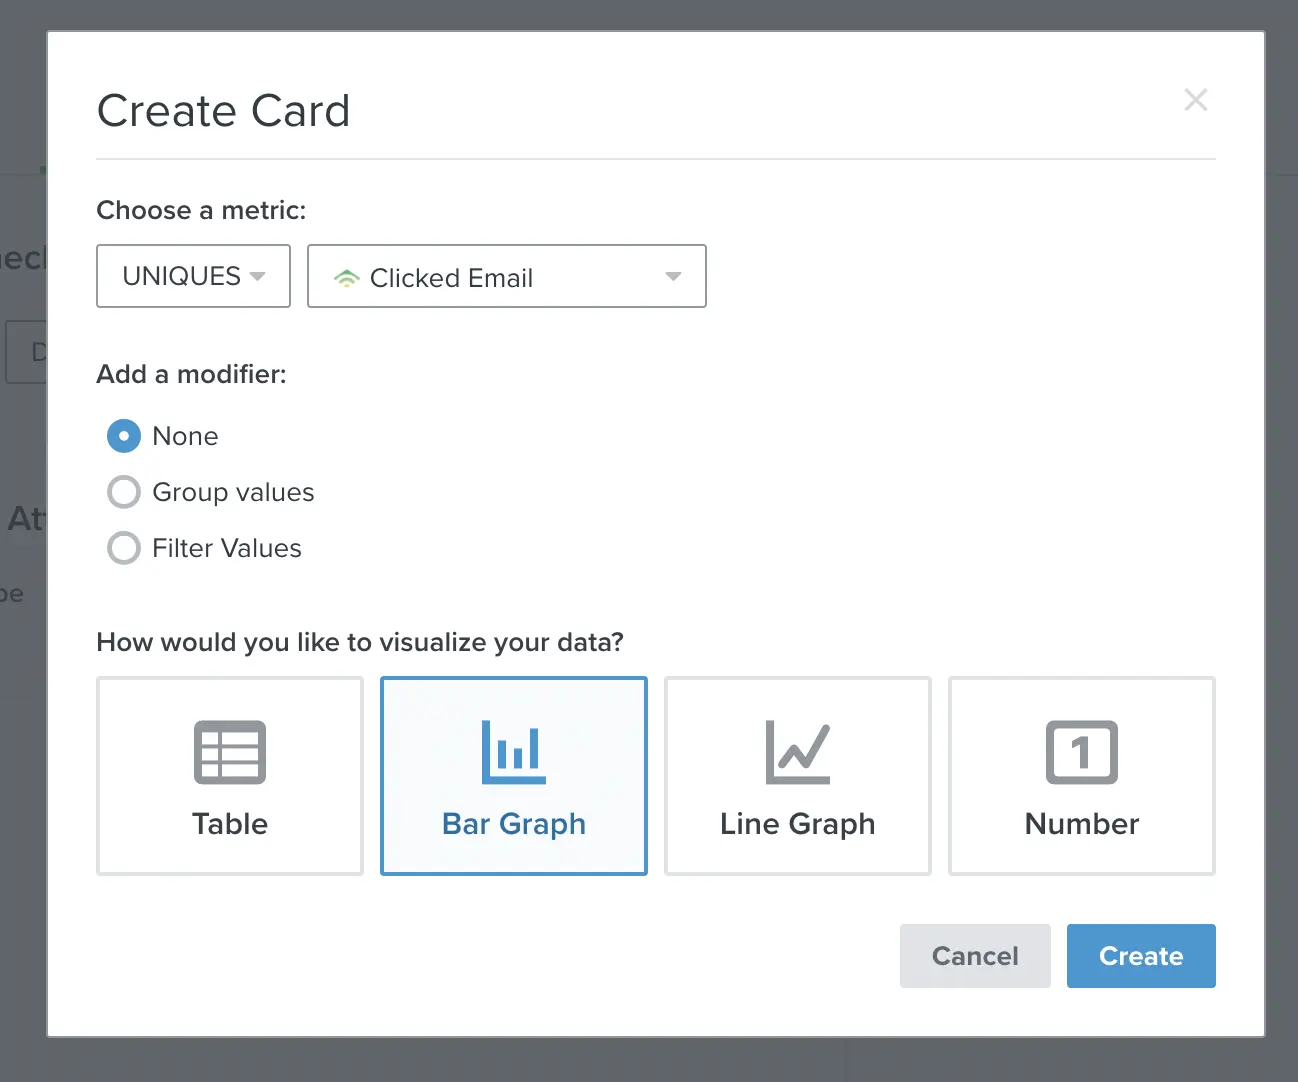
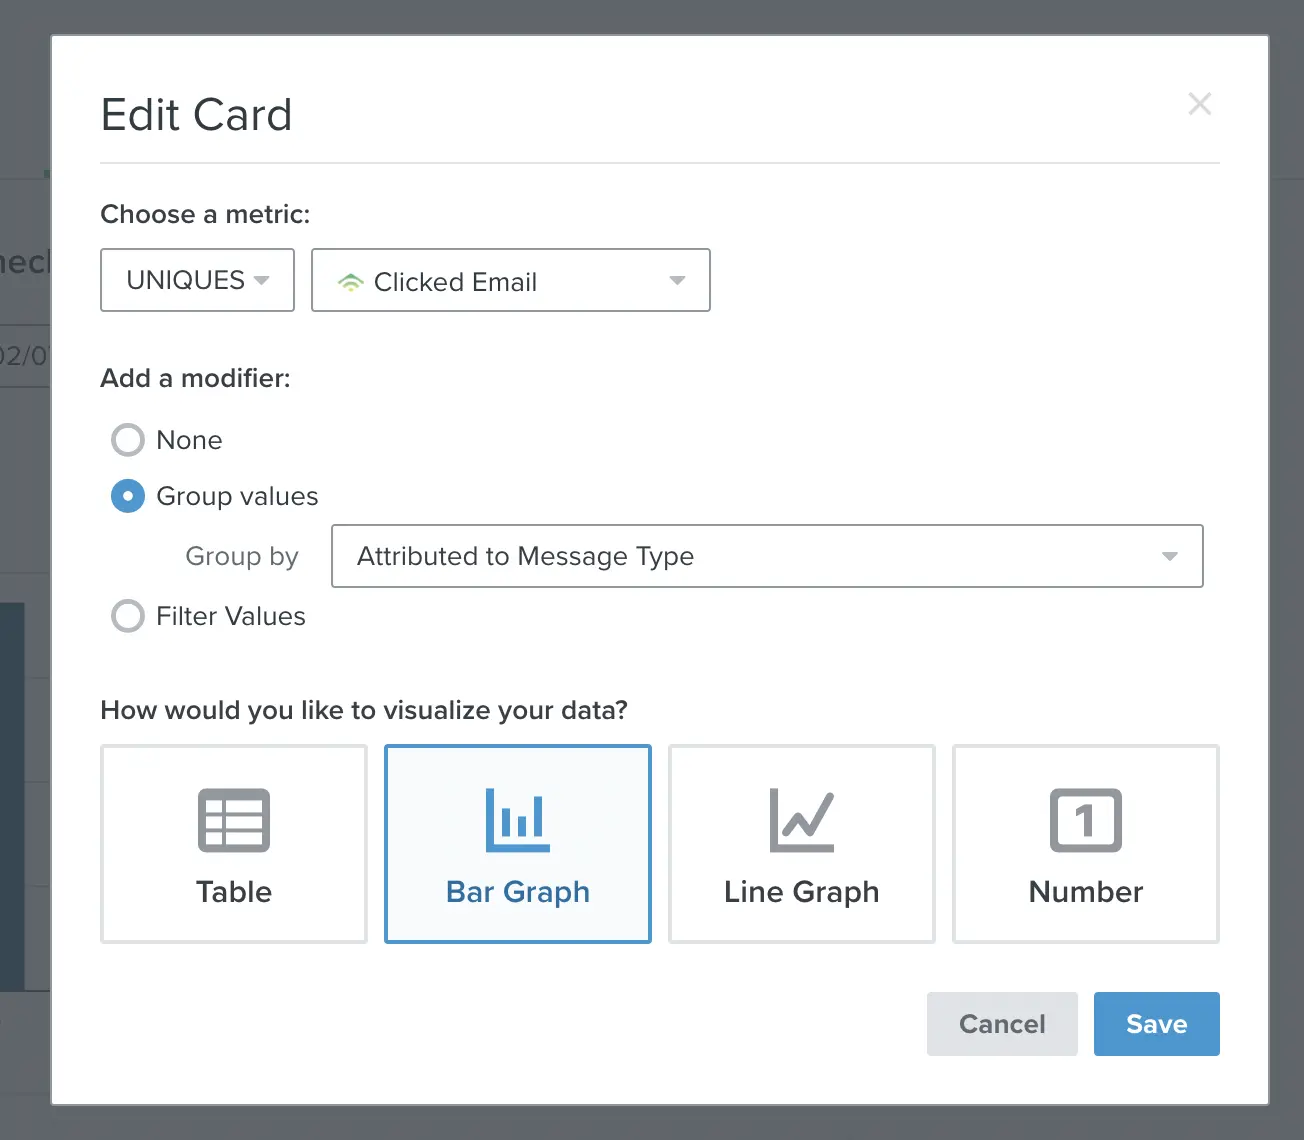
Bar Graph Card
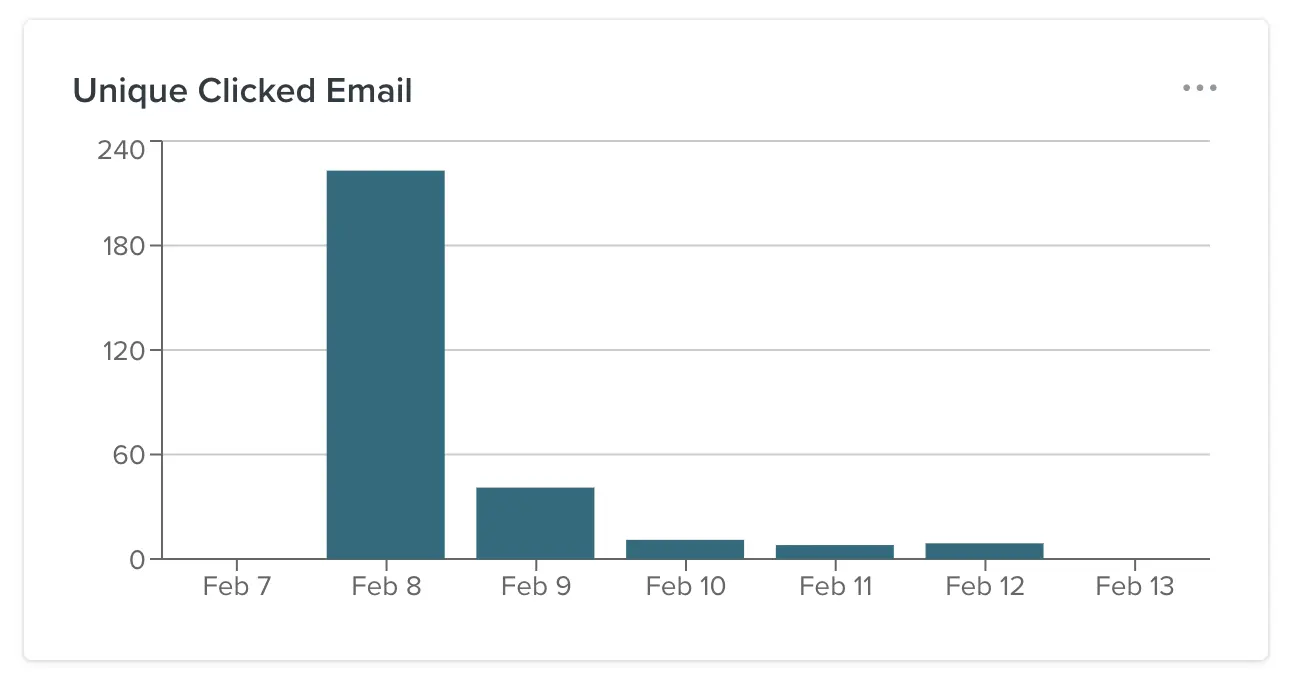
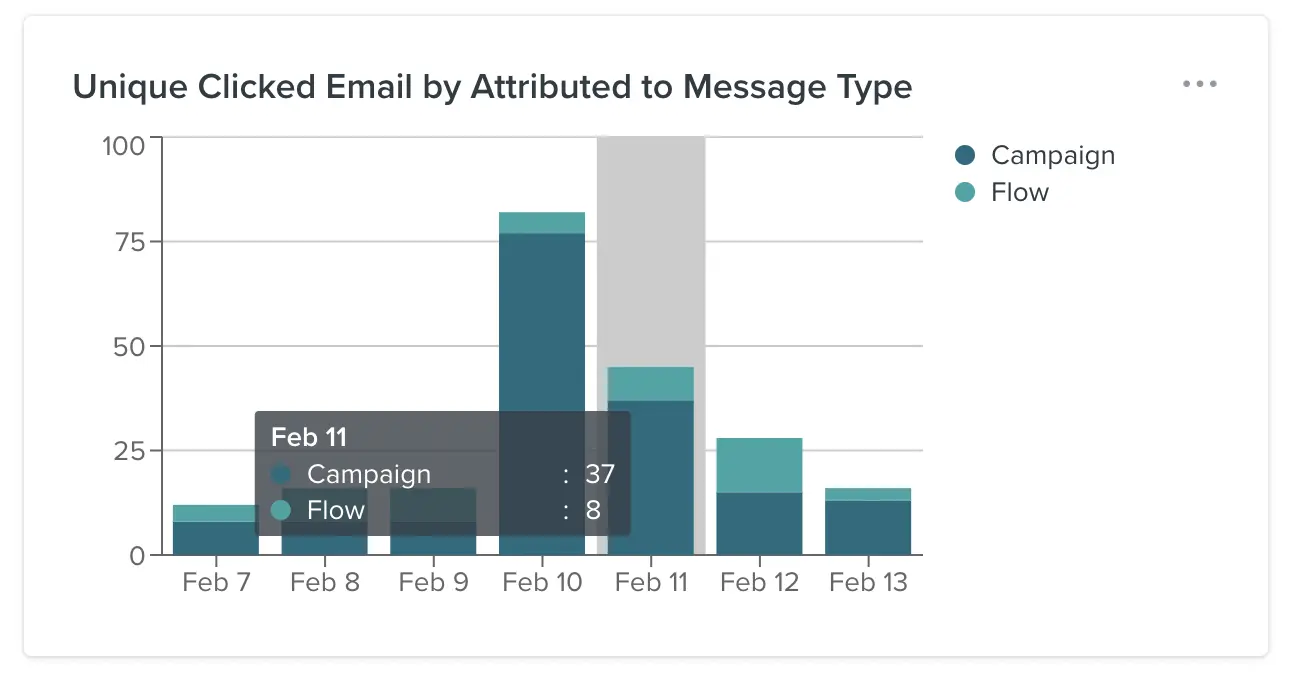
Bar charts are one of the great ways to present trends. I like to use this graph type if I use lots of line charts on a dashboard mostly. The below chart shows only the number of unique email clicks daily in a given period.
Let's add a breakdown by selecting the "Attributed to Message Type" dimension as a group. We are now seeing both campaigns and flow clicks as s stack bar graph.
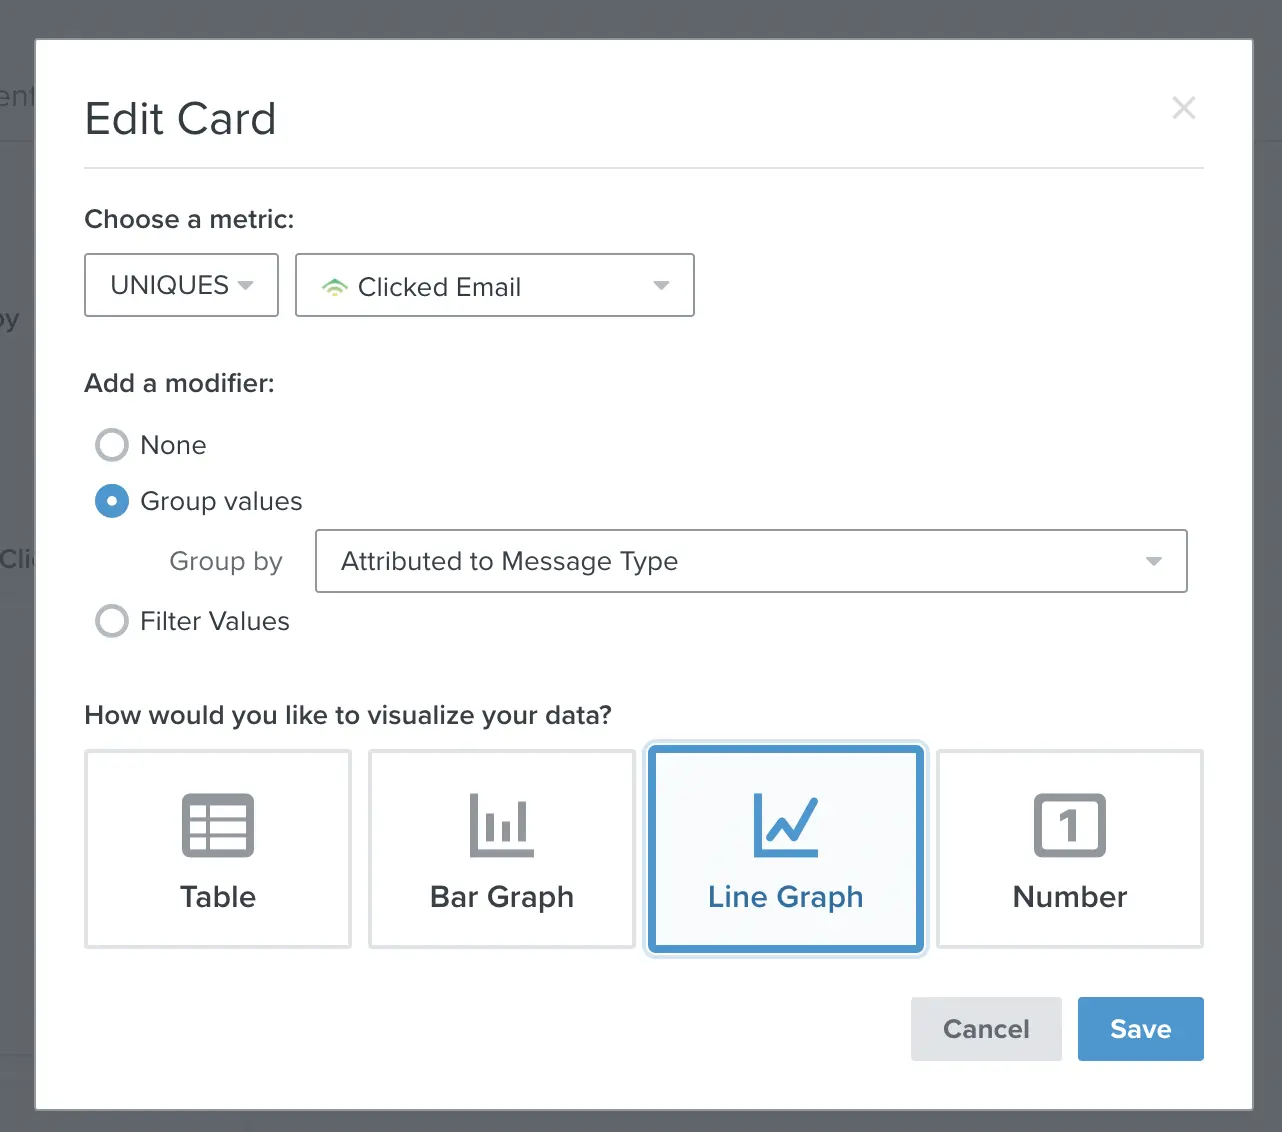
Line Graph
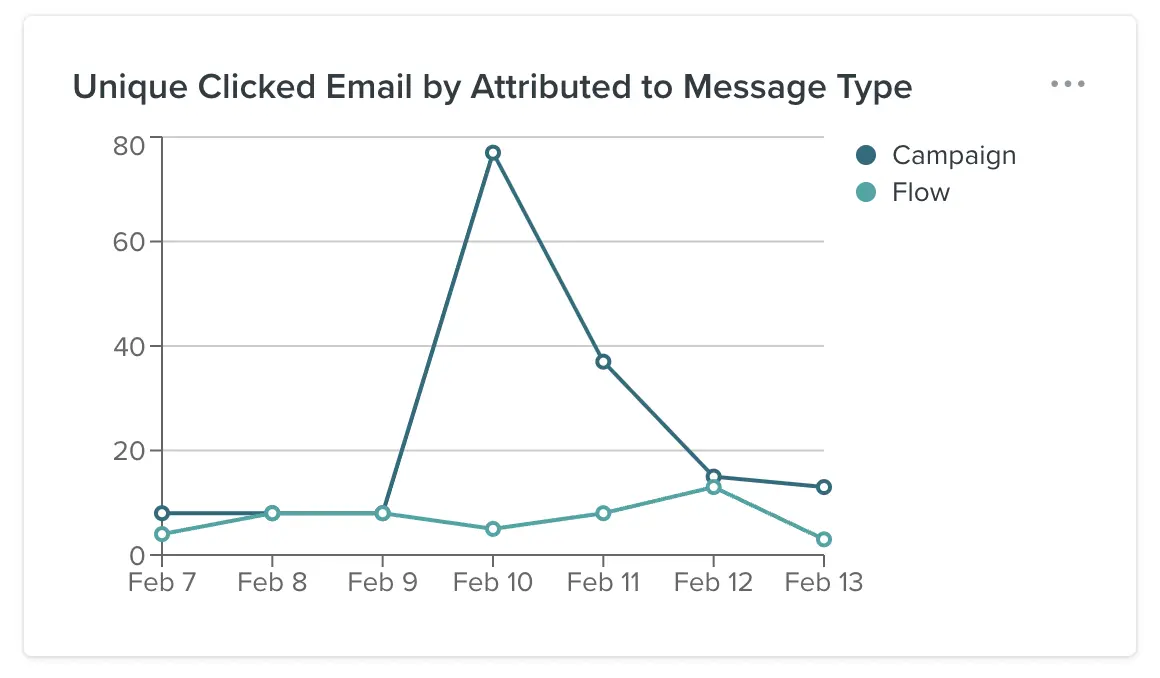
Line charts are a great way to present the data if you like to see the trends separately for each breakdown/dimension.
I'll use the above configuration except for the chart type. It was a bar chart above and I changed to the line chart to show you the difference.
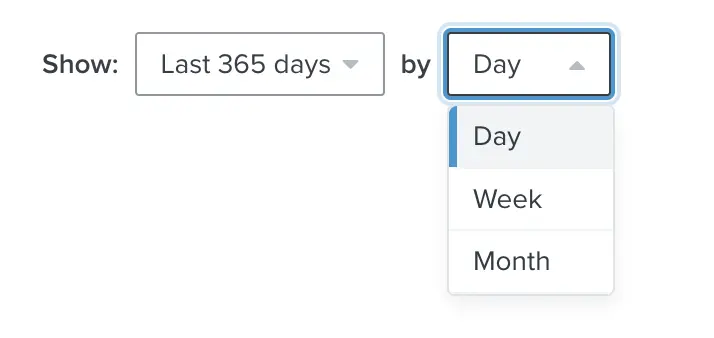
Date Range Configuration
The last thing I would like to cover is to select the date range and granularity.
We have plenty of options about the date range such as:
- Today
- Last 24 Hours
- Yesterday
- This Week
- Last 7 Days
- Last Week
- This Month
- Last 30 Days
- Last Month
- This Year
- Last 90 Days
- Last 365 Days
- Last Year
Creating a dashboard is like producing glasses. Then, you are changing the date range to look at the different periods of time with the same glasses. Isn't it wonderful?
Granularity is how tiny time fraction we would like to see for bar or line charts. When we look at the wider period then, we may need to look at the trend weekly or monthly rather than daily to have a better understanding of anomalies and trends.
I tried to cover how you can use Klaviyo's analytics dashboard feature by yourself. But, if these capabilities don't solve your business problems and want to have a more customisable Google Data Studio dashboard then, use the contact form to reach me.

