Klaviyo Google Data Studio Template

This page will walk you through one of our latest Google Data Studio templates for Klaviyo. You will able to connect your data via Google Sheets or Supermetrics in this tutorial. Also, Supermetrics integration will provide revenue data from Shopify, Woocommerce and Magento if you connect any to Klaviyo already.
You can watch the YouTube video below if you don't want to read the whole page. Let's start.
How will this template help you?
I'm using this dashboard to save my hours and find anomalies in my clients' Klaviyo accounts. I know that these pages will give you an extra booster for your client communication.
Overview Page
This is the page I'm checking regularly. I'm seeing both campaign (above) and flow (below) trends on the same page which is very important to have the power of the account.
This page is always open as a tab in my browser.
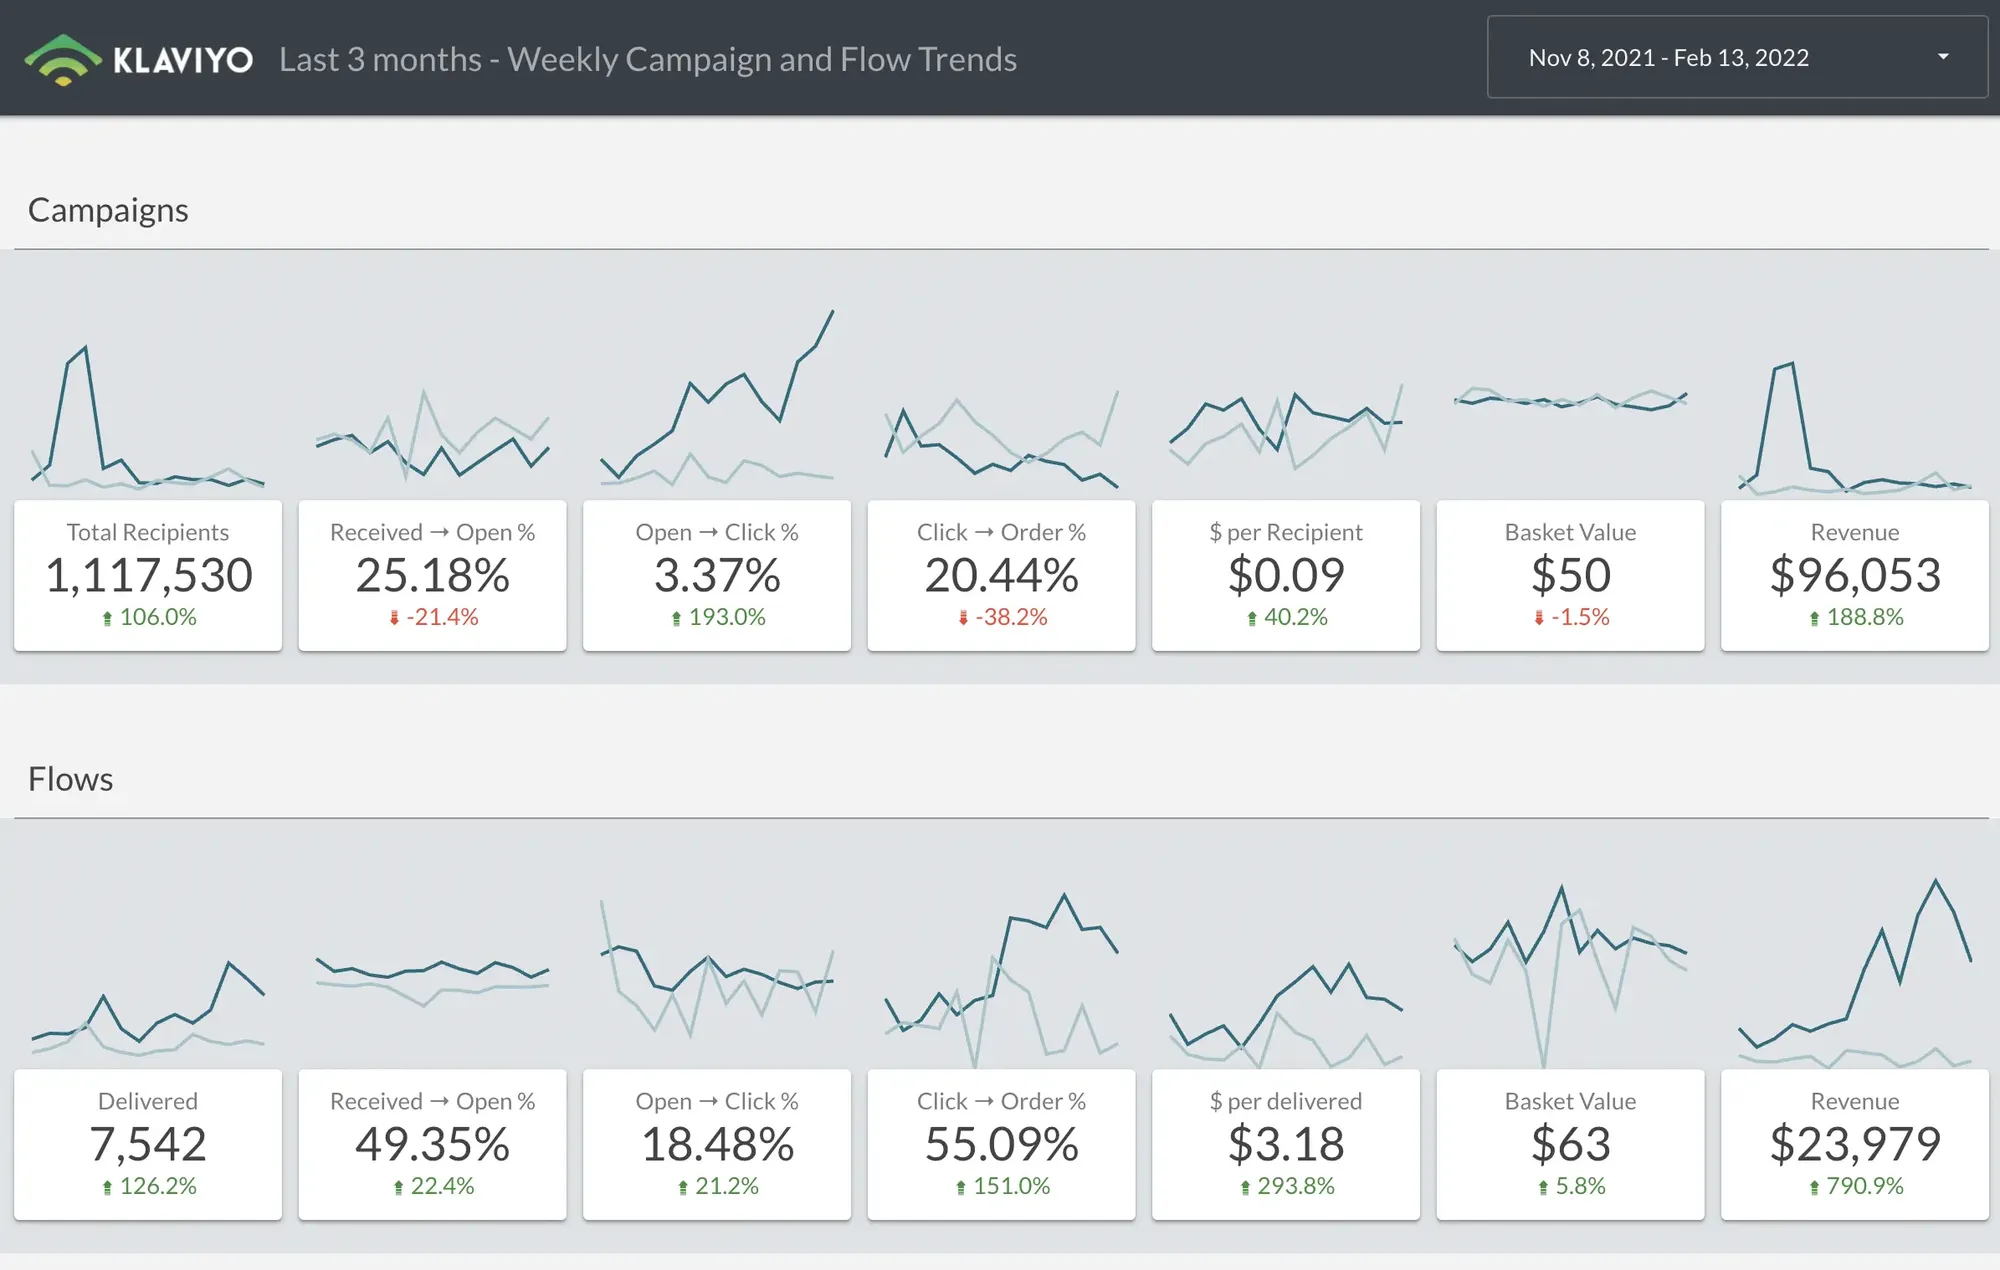
- The darker line charts show the latest date period. You can have a look at the top right date selector to understand the date period you are looking at for a page.
- The lighter lines represent the previous period. If the date selector shows the last 14 days then, these light trend charts show the previous 14 days.
- The same date parts are applied to % changes under every metric on the page.
Weekly Campaign Trend Analysis
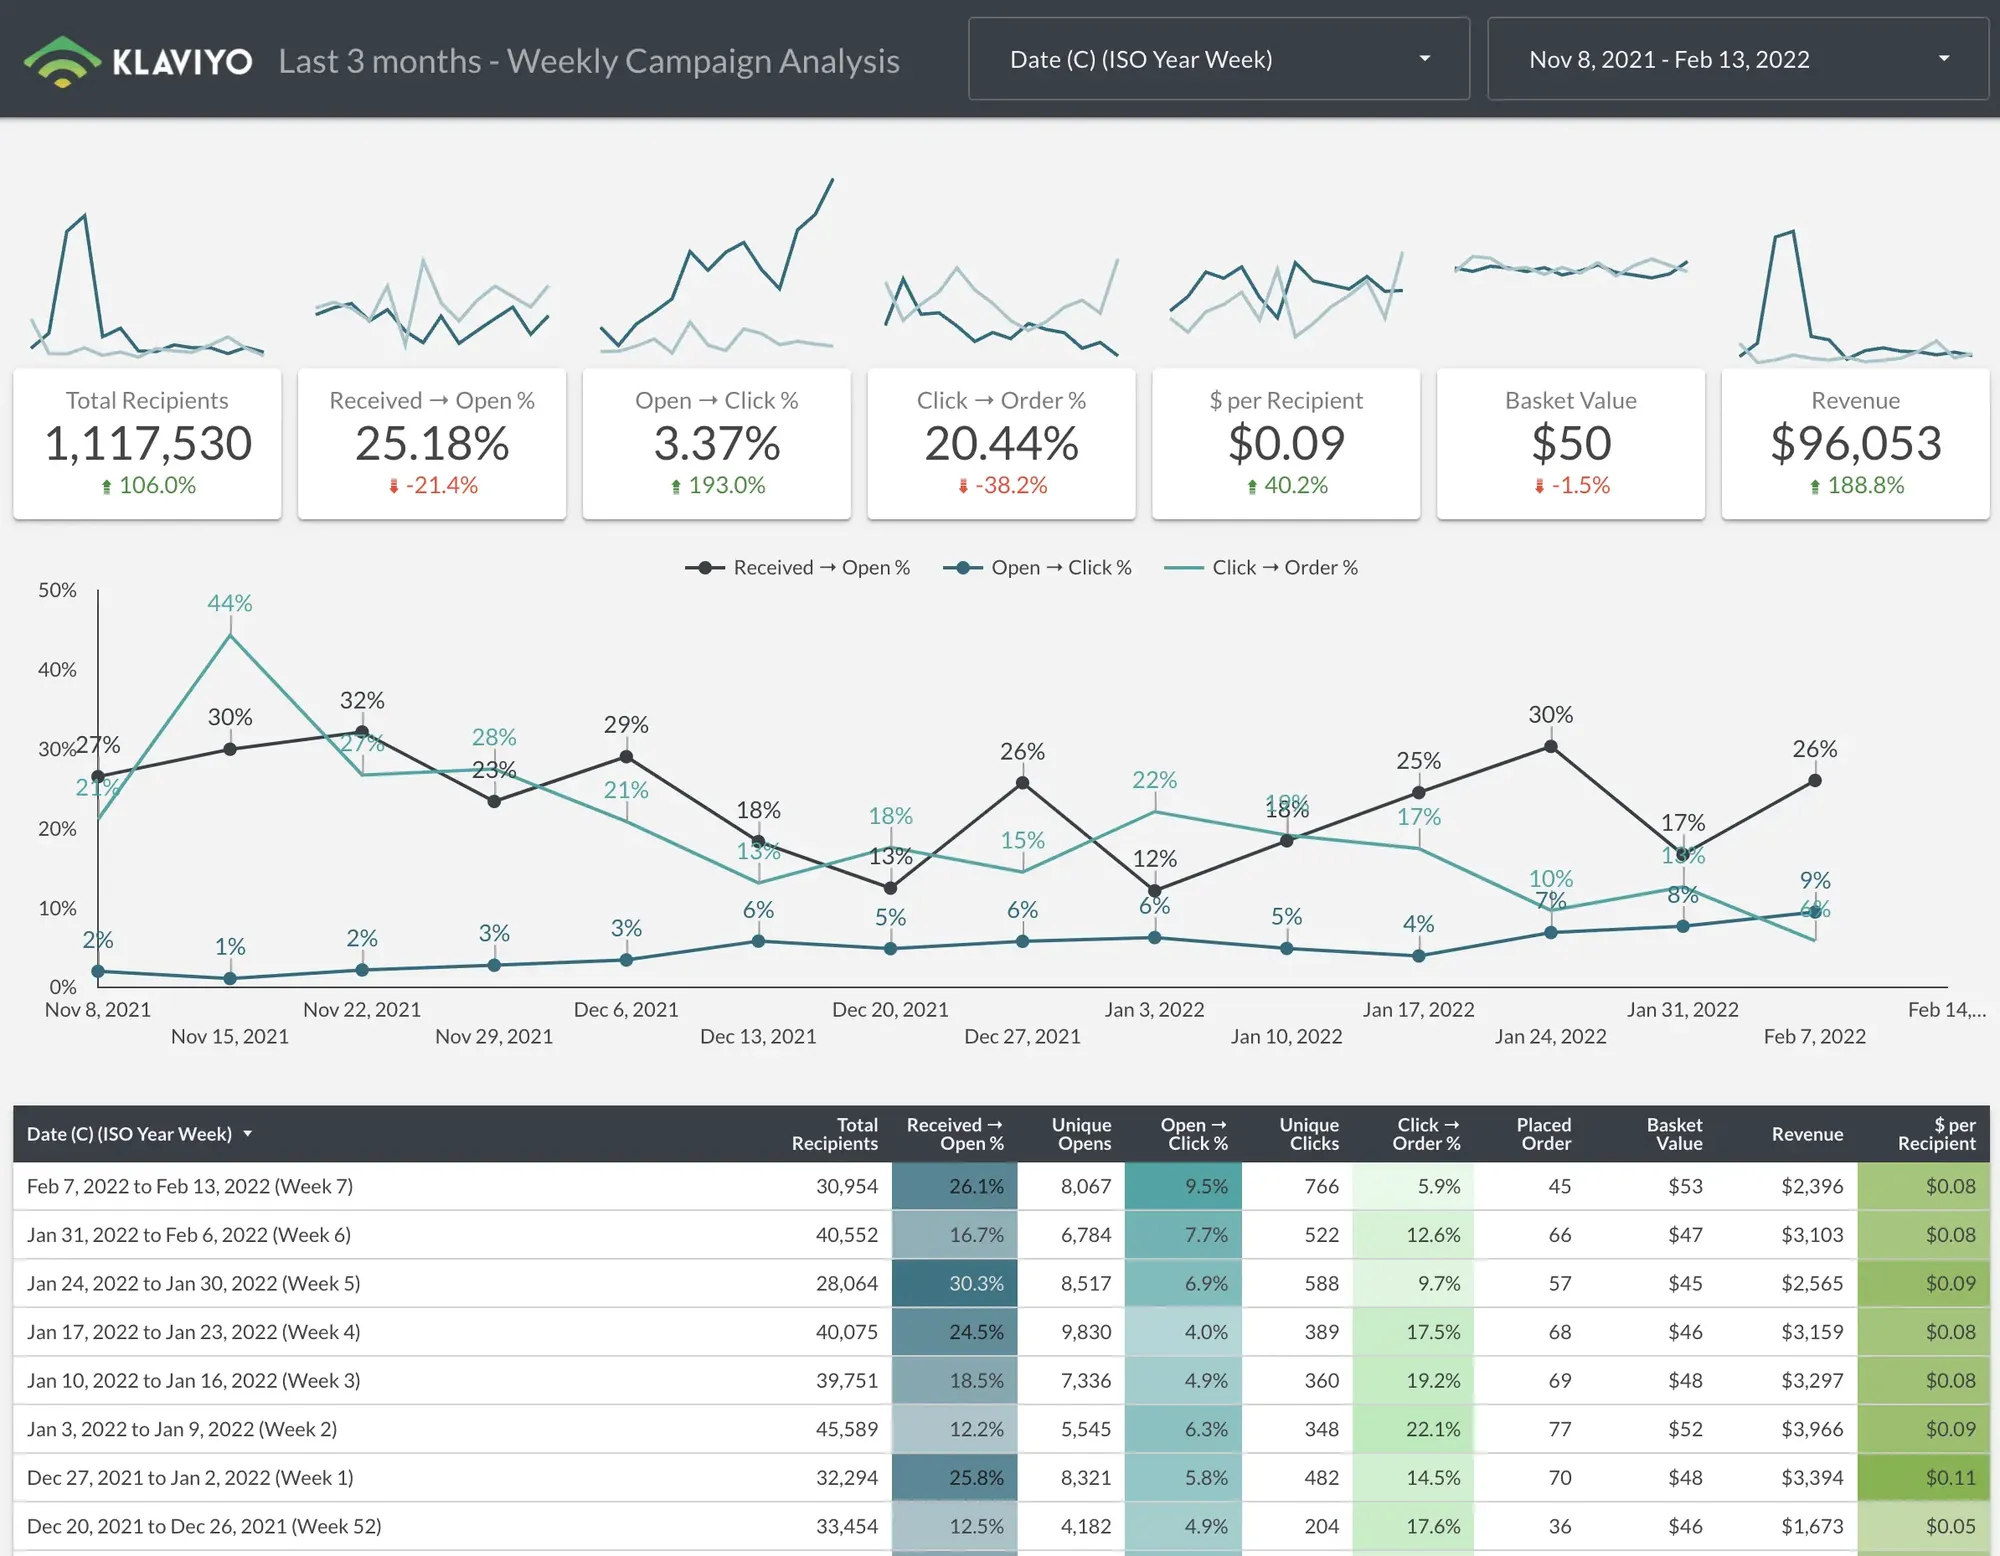
This page uncovers more details about my campaigns. I'm seeing trends on both above topline metrics but, my favourite part is the line charts in the middle of the page.

This line chart shows me the trend of each step of the email marketing funnel:
- Received → Open %: Open rate
- Open → Click %: Click-through rate
- Click → Order %: Conversion rate
With this graph, I can easily understand which part of the funnel has a problem that I need to take care of or fix.
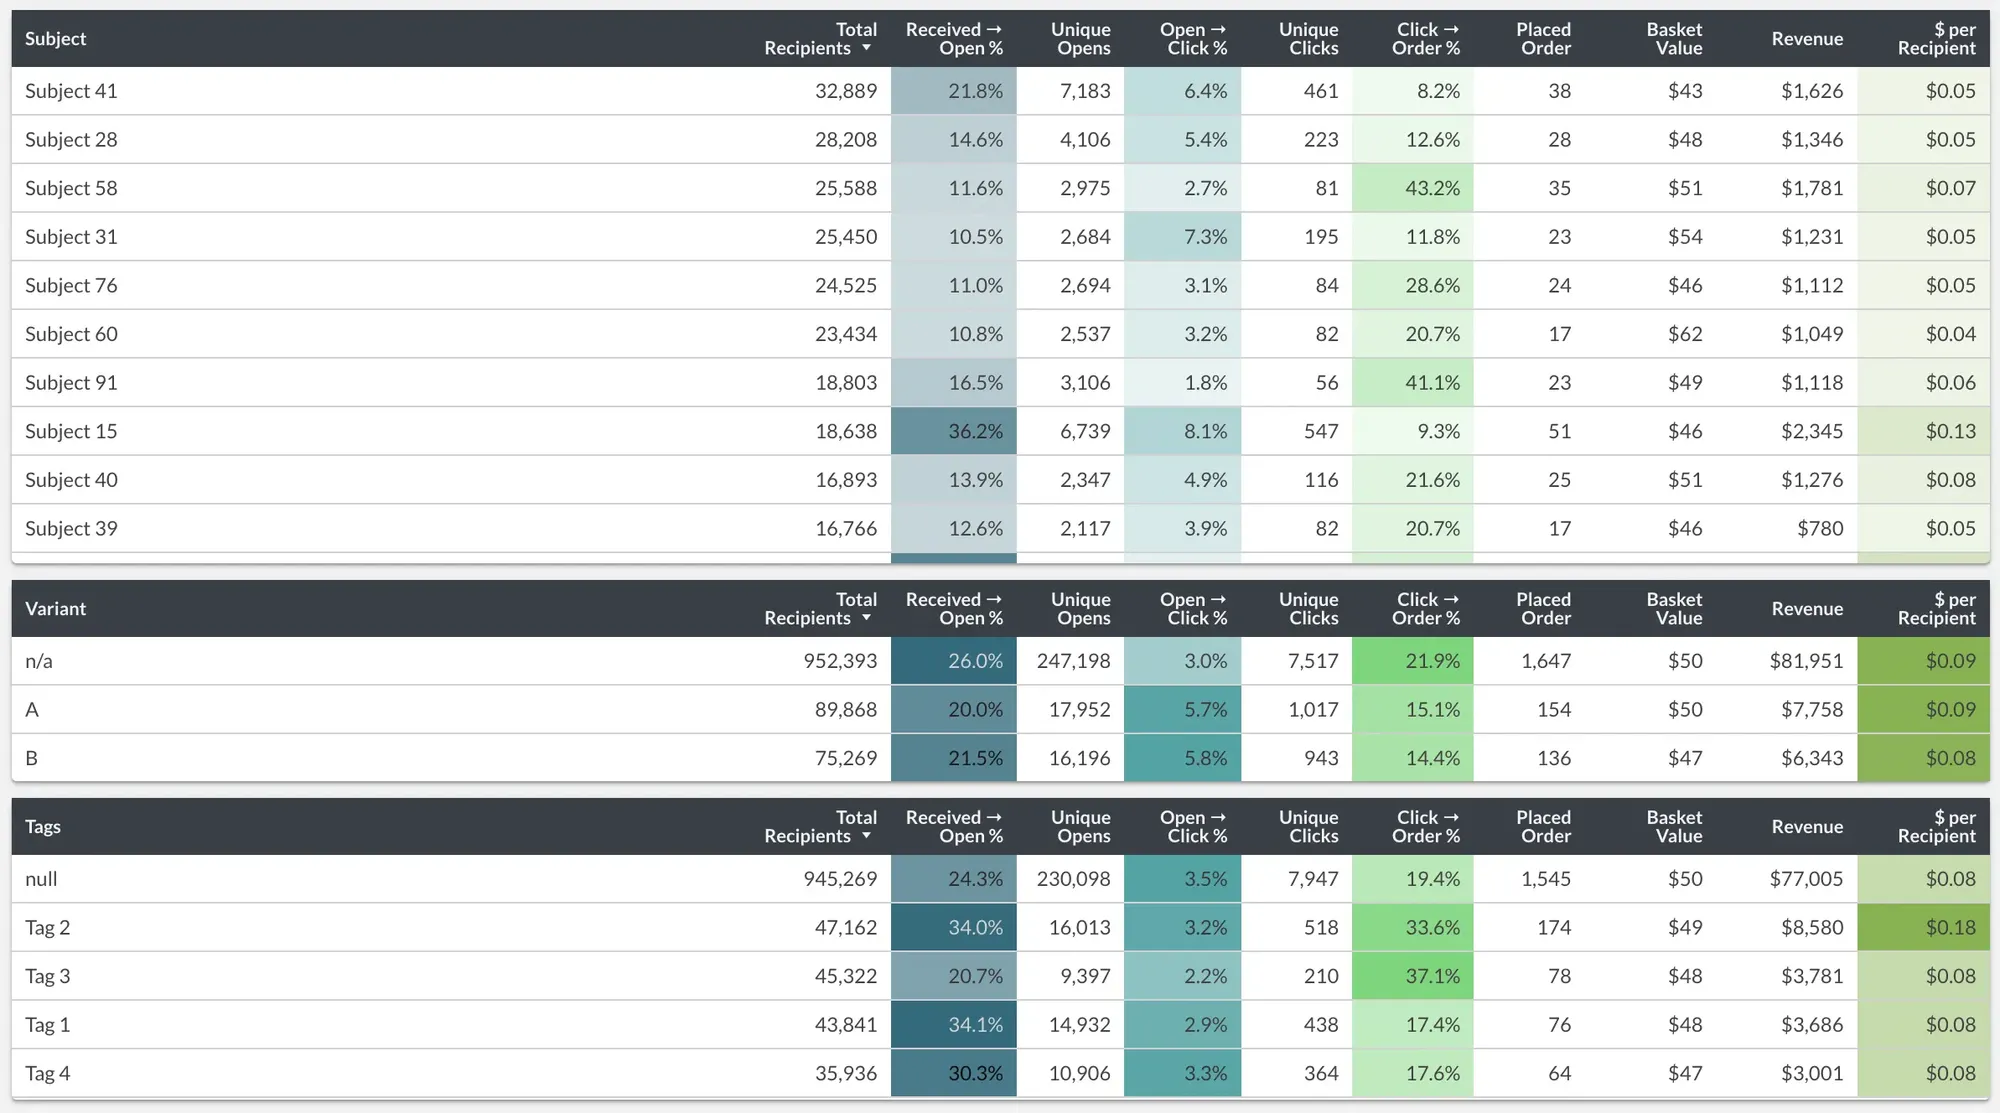
You'll have lots of tables on almost every page. This is my way to look at the data. First, I'm looking at the overall metrics and trend then, I deep-dive through the tables.
Each table is a way to look at the data from a different perspective. Also, I put the filter functionality in tables so, if you see an insight for a row then, just click it to filter the whole page by that breakdown.
If you click "Tag 3" on the table in the below screenshot then, the dashboard will show values for only Tag 3. So, you can see which campaigns have been sent with tagged "Tag 3" etc.
Latest Campaigns
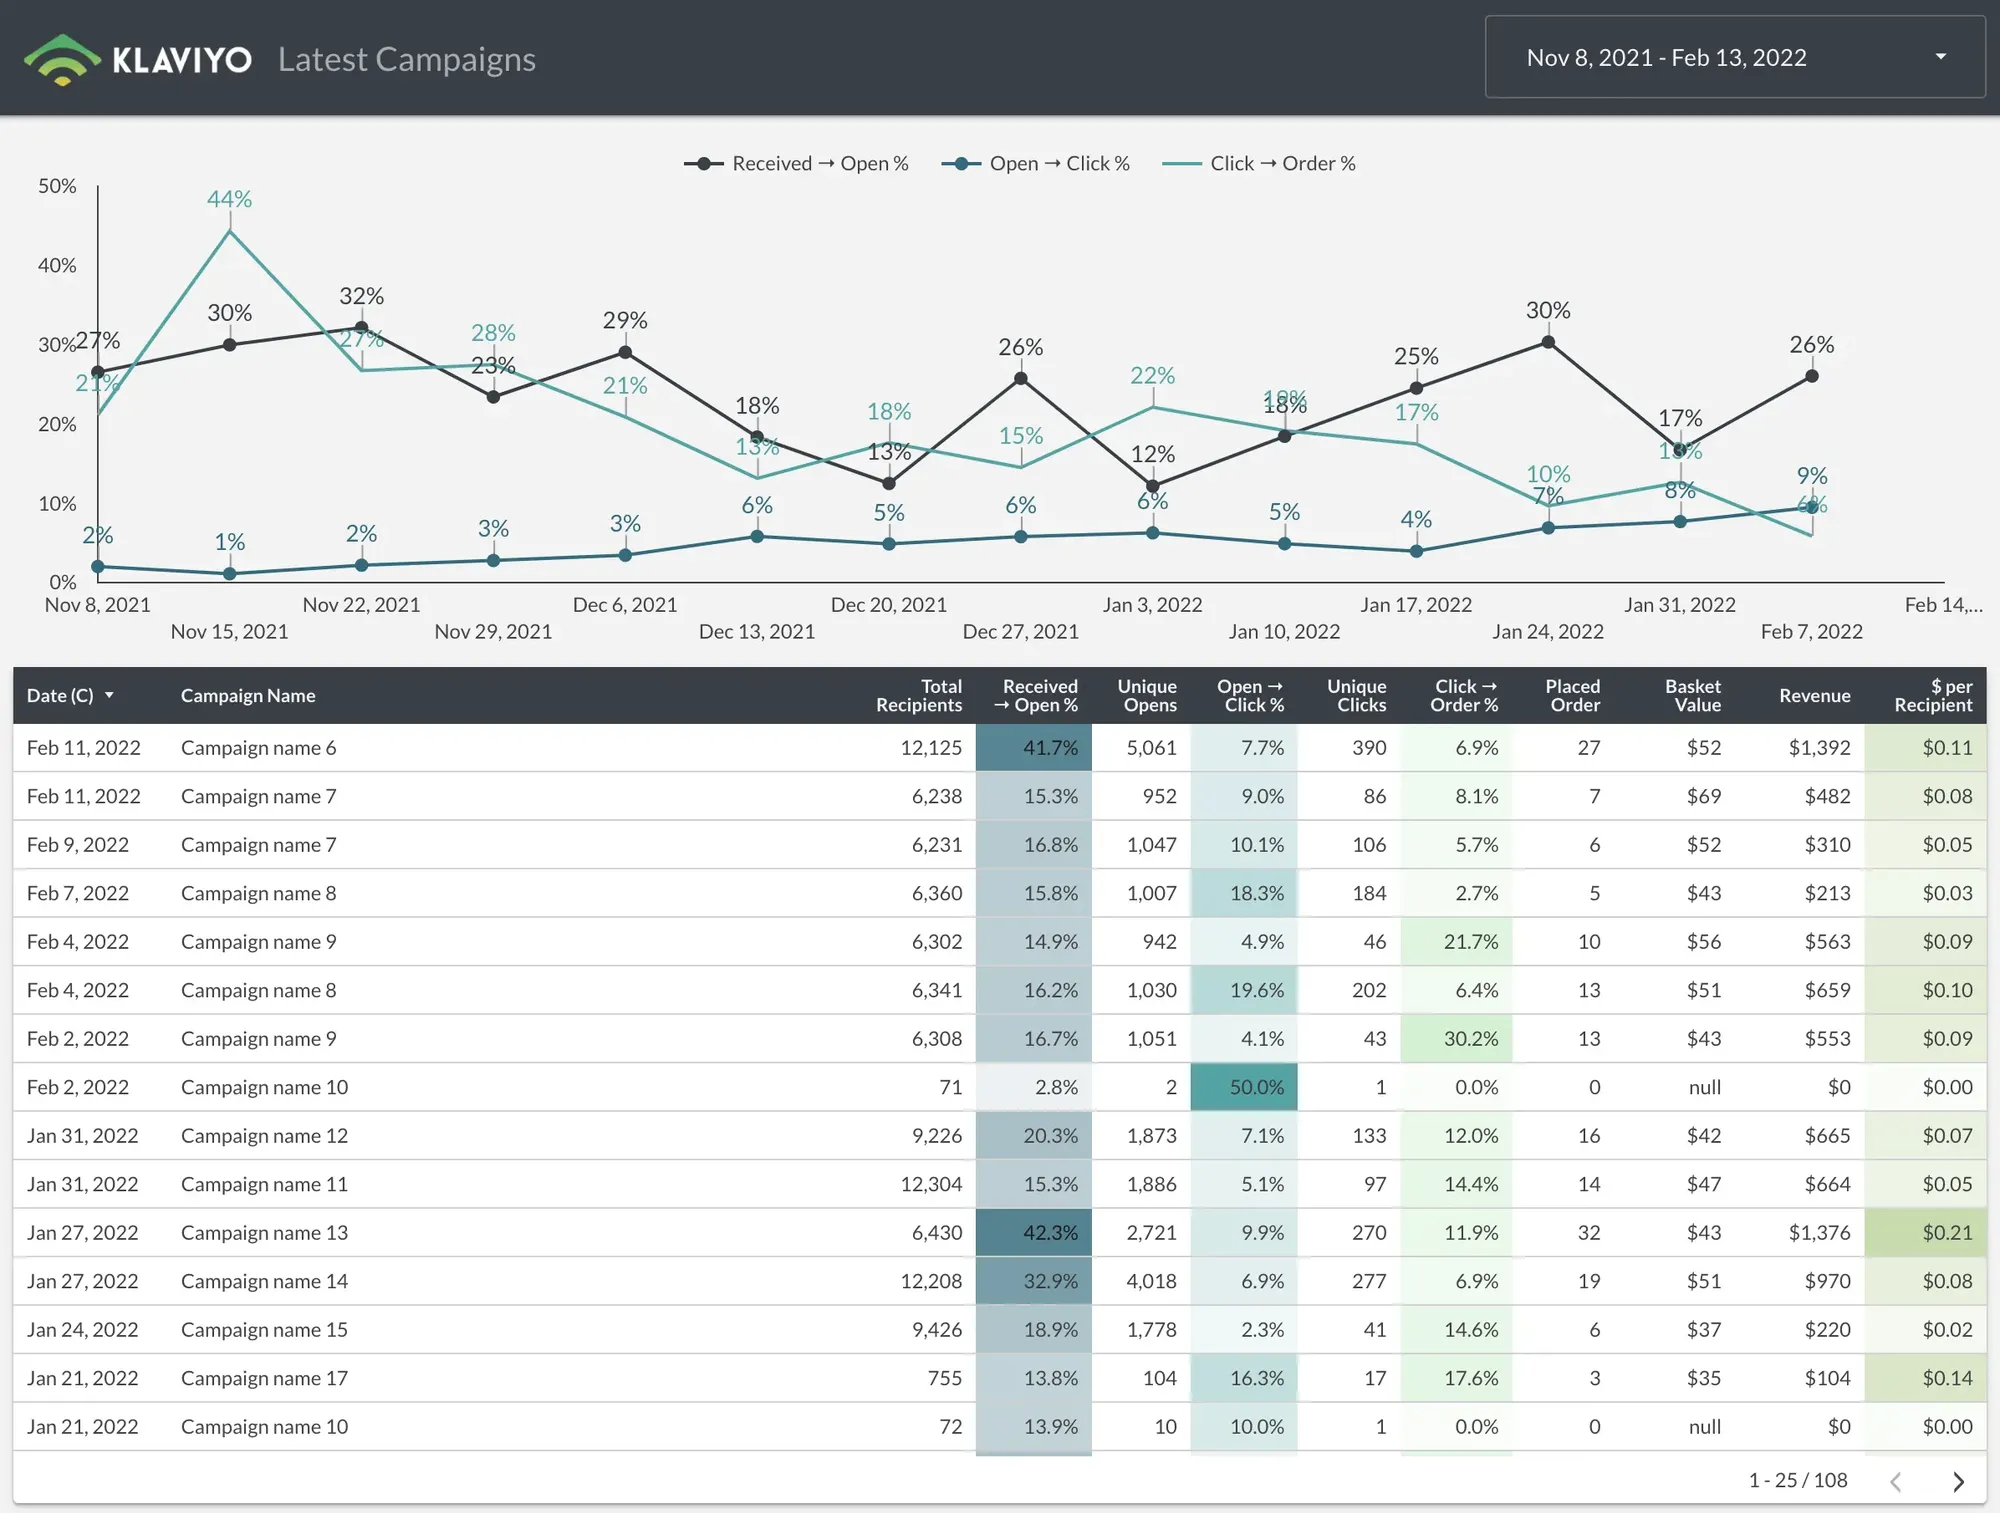
This is another page I'm using regularly. I'd like to review the latest campaigns that my client sent. They don't always say me about their campaigns so, this page helps me to stay up to date.
The first column is the date of the campaign.
Flow Trend Analysis
This is the equivalent page of the campaign trend analysis page which I mentioned above.
I believe that looking trend charts are mostly suited for flows rather than campaigns because of their nature. You send campaigns but, activate flows.
So, you need to track the performance of the flow over time and adjust if some part of it is leaking. this approach will help you to optimise flow performance and the overall email marketing revenue.
You have already know my favourite part which is the big line charts in the middle of the page. I won't give more details since I have already done this in the previous part of this article.
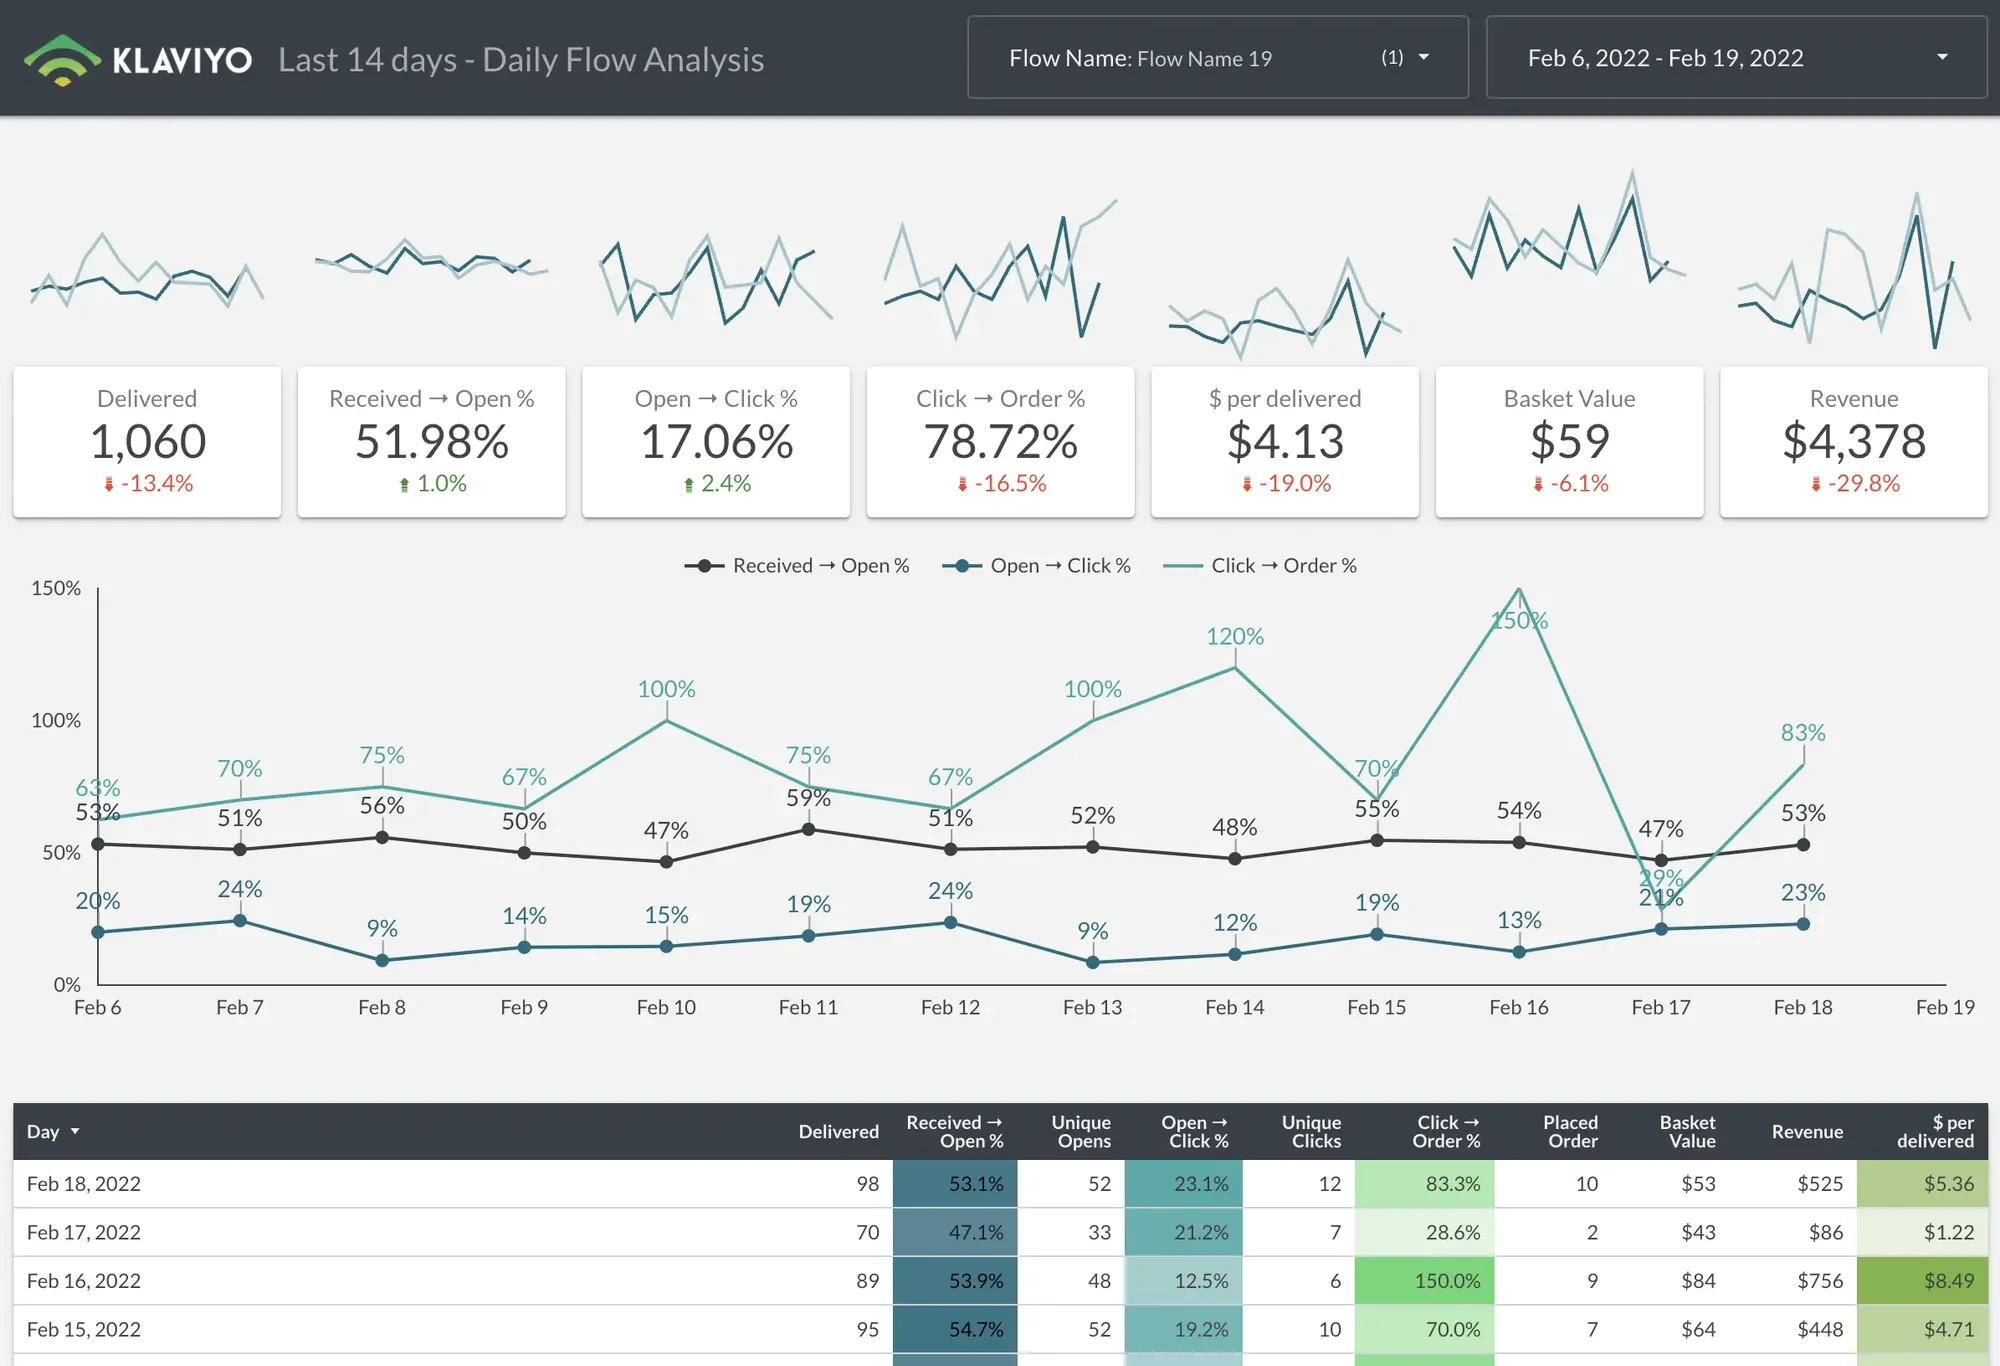
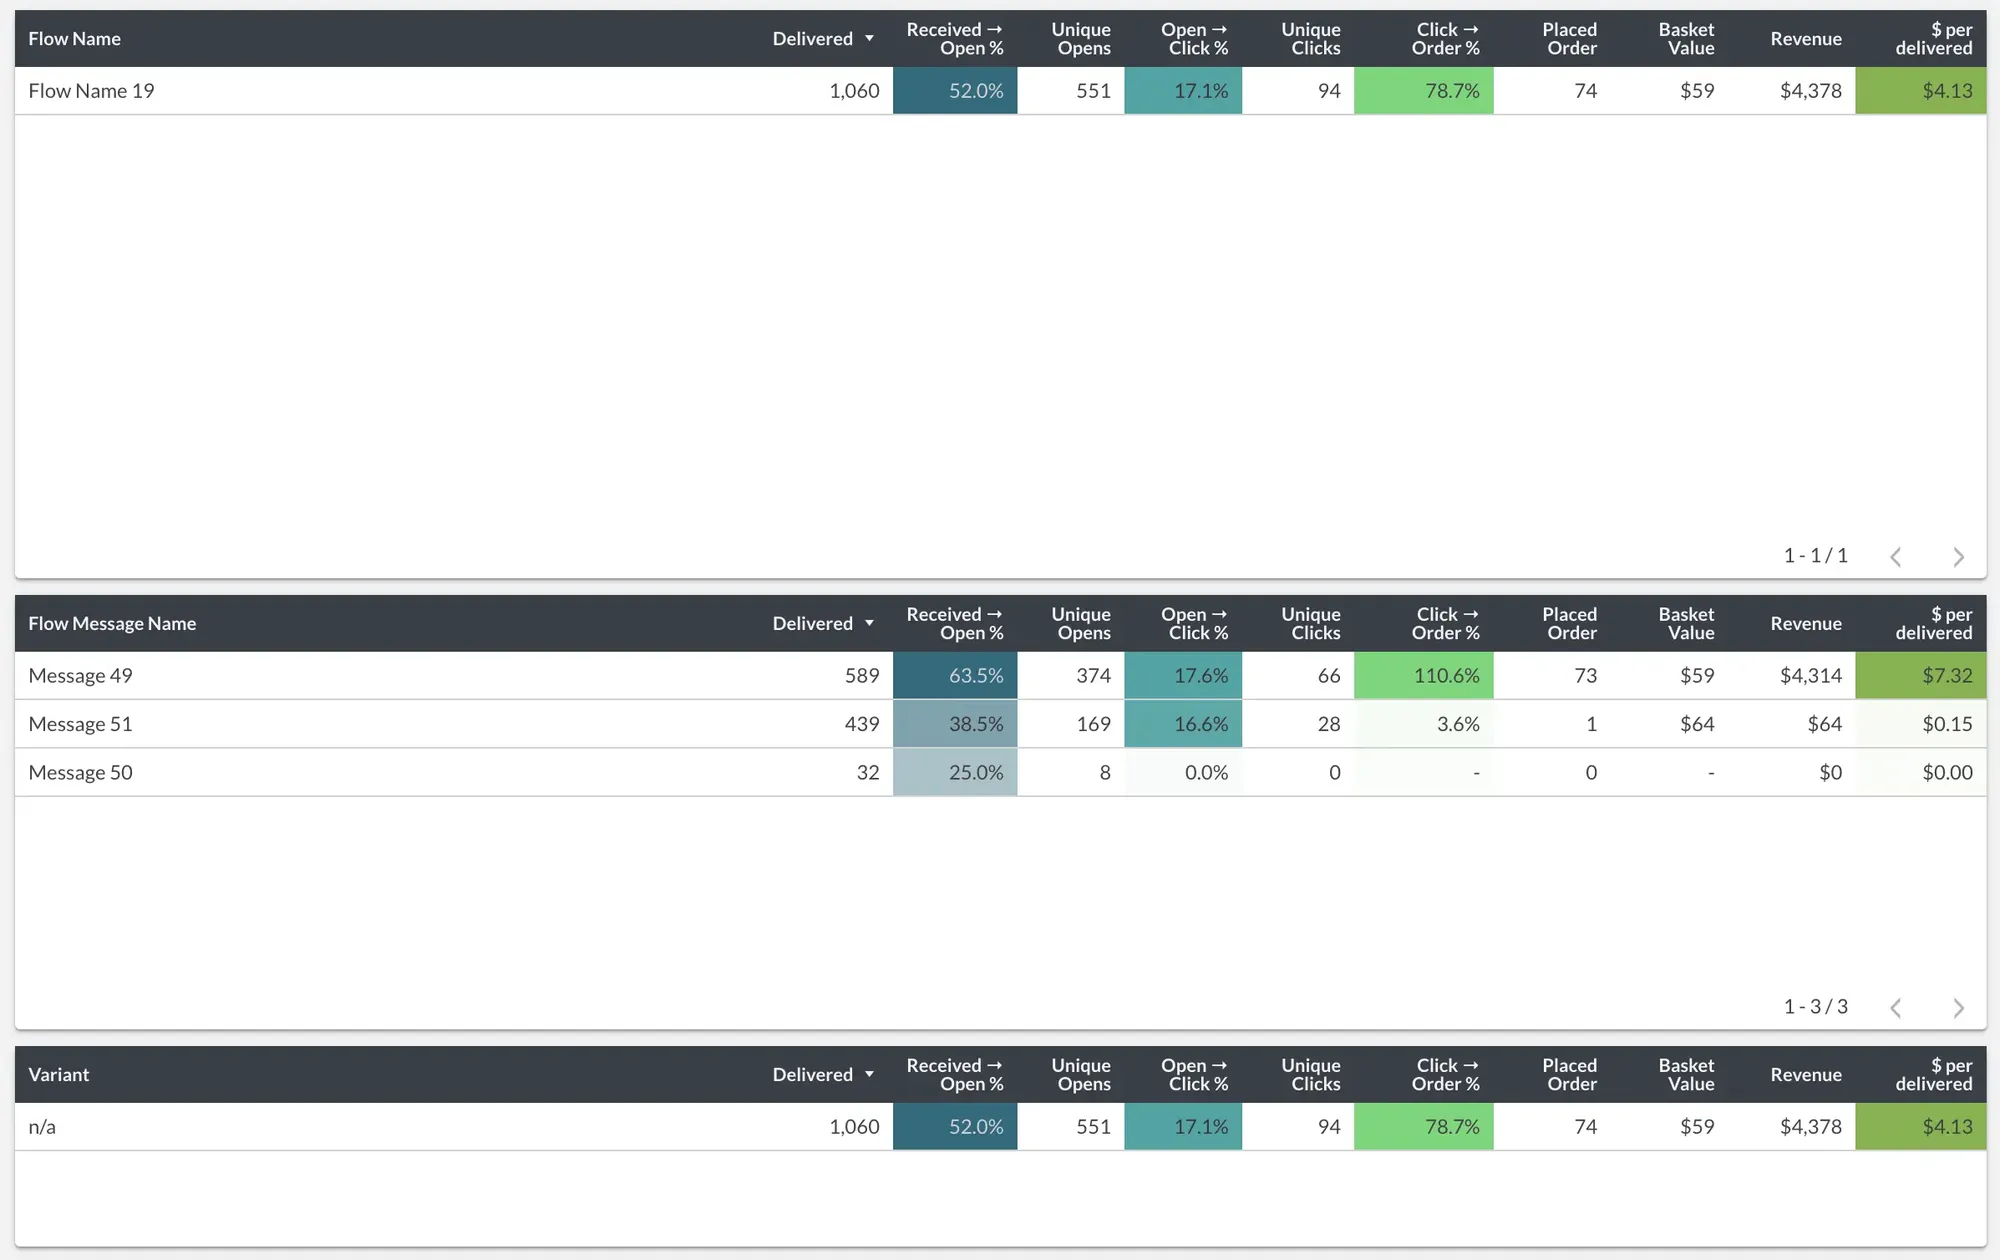
You are seeing the rest of the dashboard below. I clicked the "Flow Name 19" to show how filters work. This click filters all the pages and shows me that this flow has 3 messages. I now see the performance of these 3 messages separately.
Year over Year Analysis
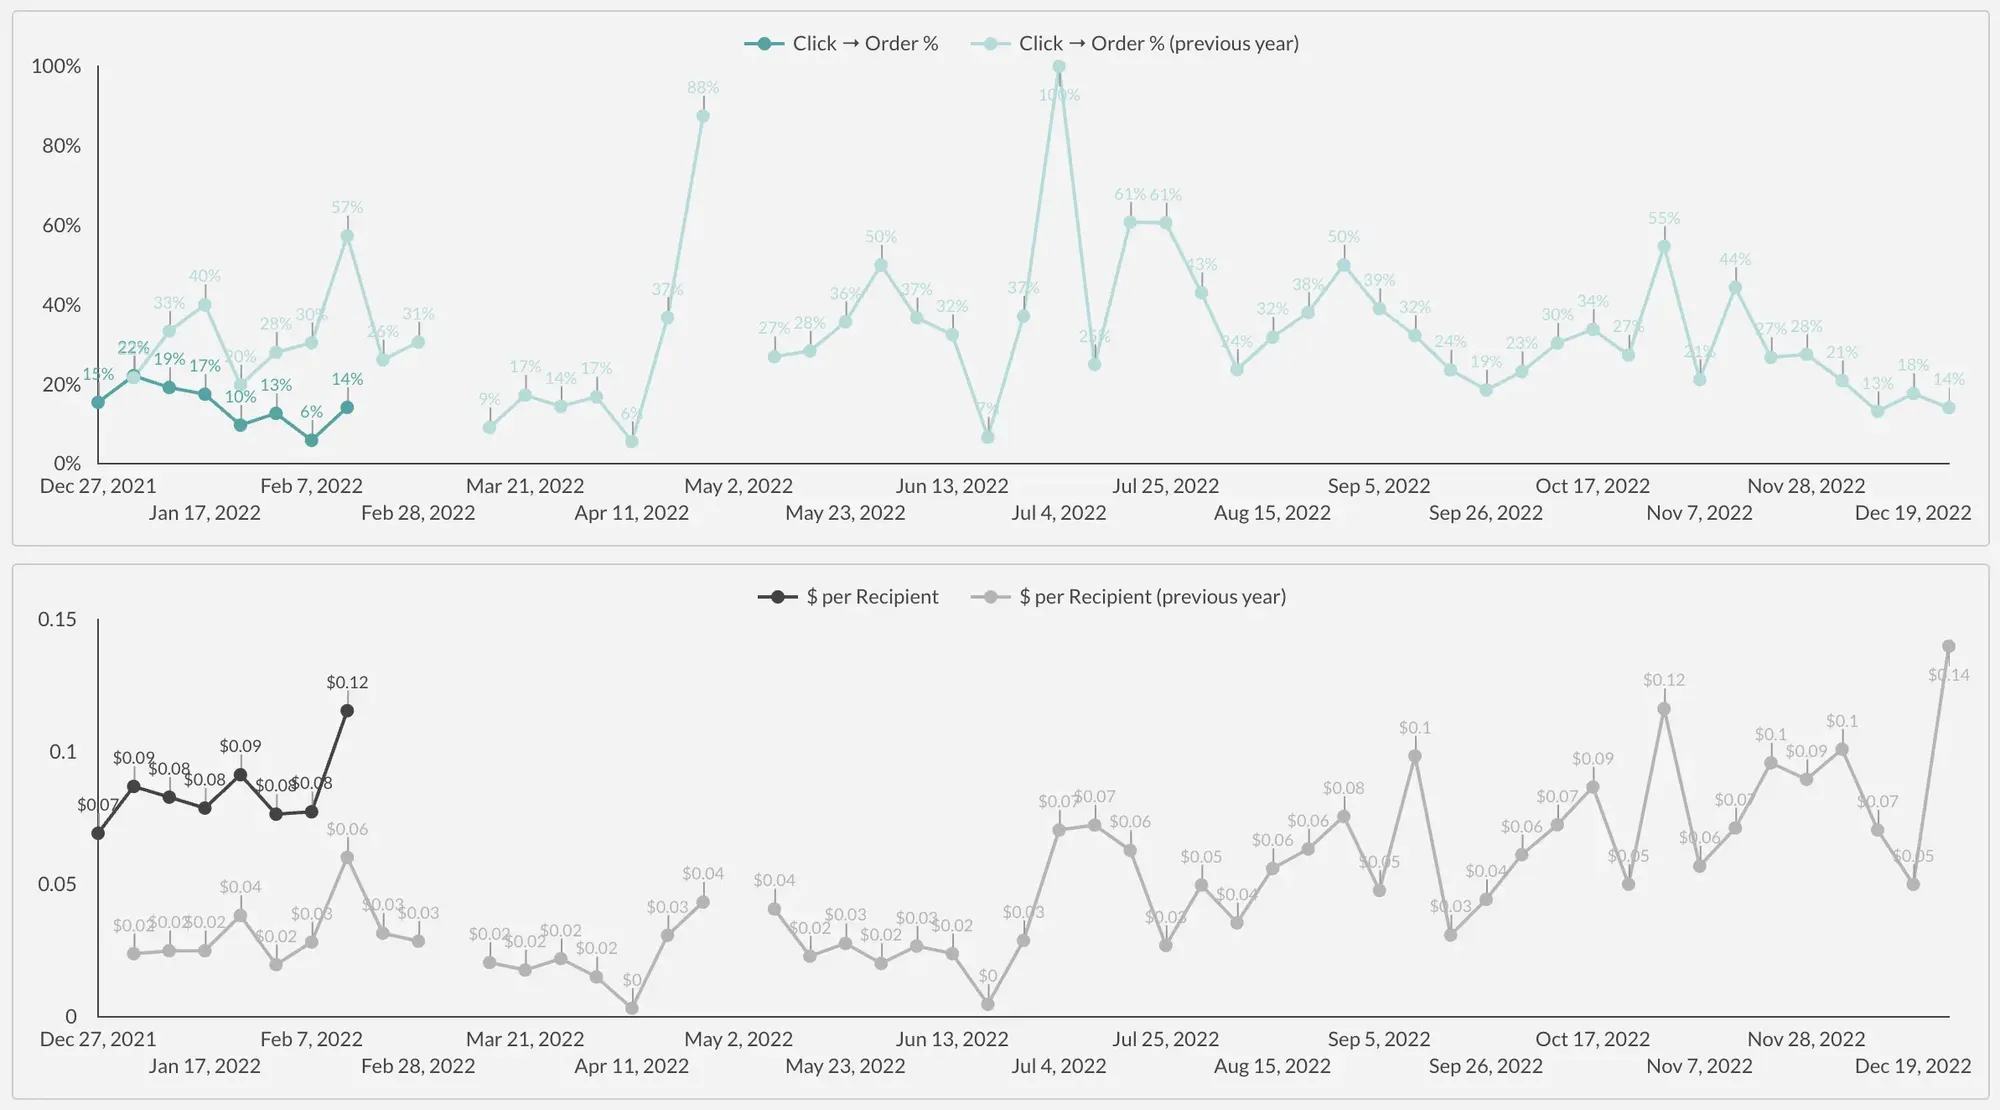
One of my favourite parts (actually I think all pages are my favourite :) ) is the page that lets me compare my current performance with the previous year. I'm checking this page once a week to once a month but, it helps me to stay on track.
I always forget the important sessional dates for my clients. That is why I'm looking at this page to get some insights from the previous year and always be prepared before the sessional peak arrived.

The below charts show me the conversion rate and revenue per recipient. The conversion rate is worse than last year but, look at the revenue per recipient! We are now earning more even our some of the important funnel metric is worse than last year.
Other pages
I prepared 14 pages for now and it may be different in time. (I know that I will forget to update this page but, add more features and pages to the dashboard)

How to purchase this template?
If you need a custom made dashboard then, please reach us through the contact page, if you prefer to purchase the template and edit by yourself please check one of the options below.
Through Fiverr
If you have a Fiverr account and like to proceed through here then, please follow this link to access our Fiverr account page.
Through Etsy
We are putting these templates on our Etsy page, too. Here is the link to the store in case you have an Etsy account and prefer to proceed through this platform.
You may think why all of these dashboards cost so little. Because you caught me in the phase of learning how to sell digital products rather than my hours. So, enjoy your templates and let me know if you have any feedback for them.
Subscribe to the lifetime plan
We are offering lifetime access for current and all future templates. Also, you'll have a template request option without extra cost if the template gallery hasn't included it yet.
Click here for details: https://northstaranalytics.co.uk/membership/
How to copy this dashboard? [Google Sheets edition]
Step 1: Export Klaviyo Campaign and Flow Data
You need to export your Klaviyo stats to Google Sheets to use this dashboard without extra monthly recurring costs. Otherwise, you may need to use a connector such as Fivetran, Power My Analytics or Supermetrics which cost you around $30-200 per month.
Please visit the following article to export Klaviyo data to Google Sheets then, visit this article again.

Step 2: Create GDS Data Source for Campaign Data
We need to create data sources before creating the dashboard. Please visit this link or navigate to the top-left button and click Create → Data Source to create a new data source.
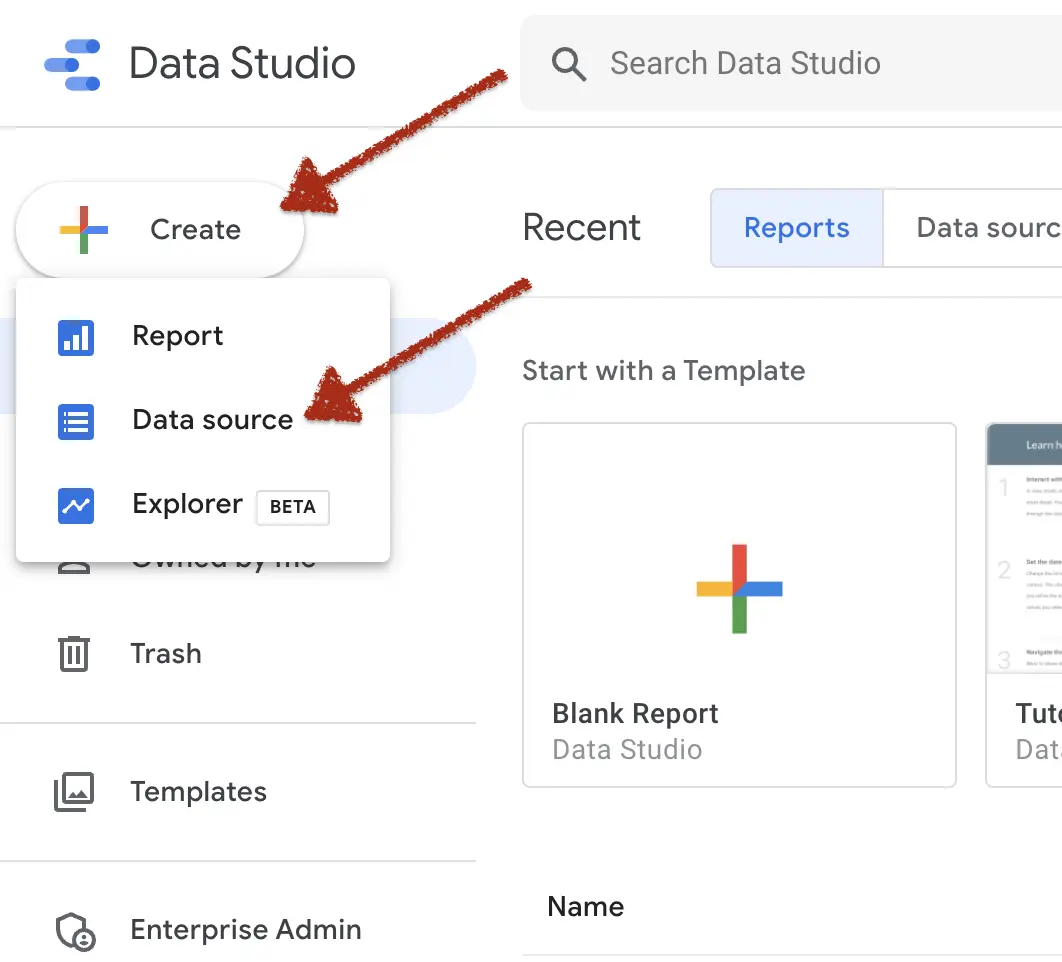
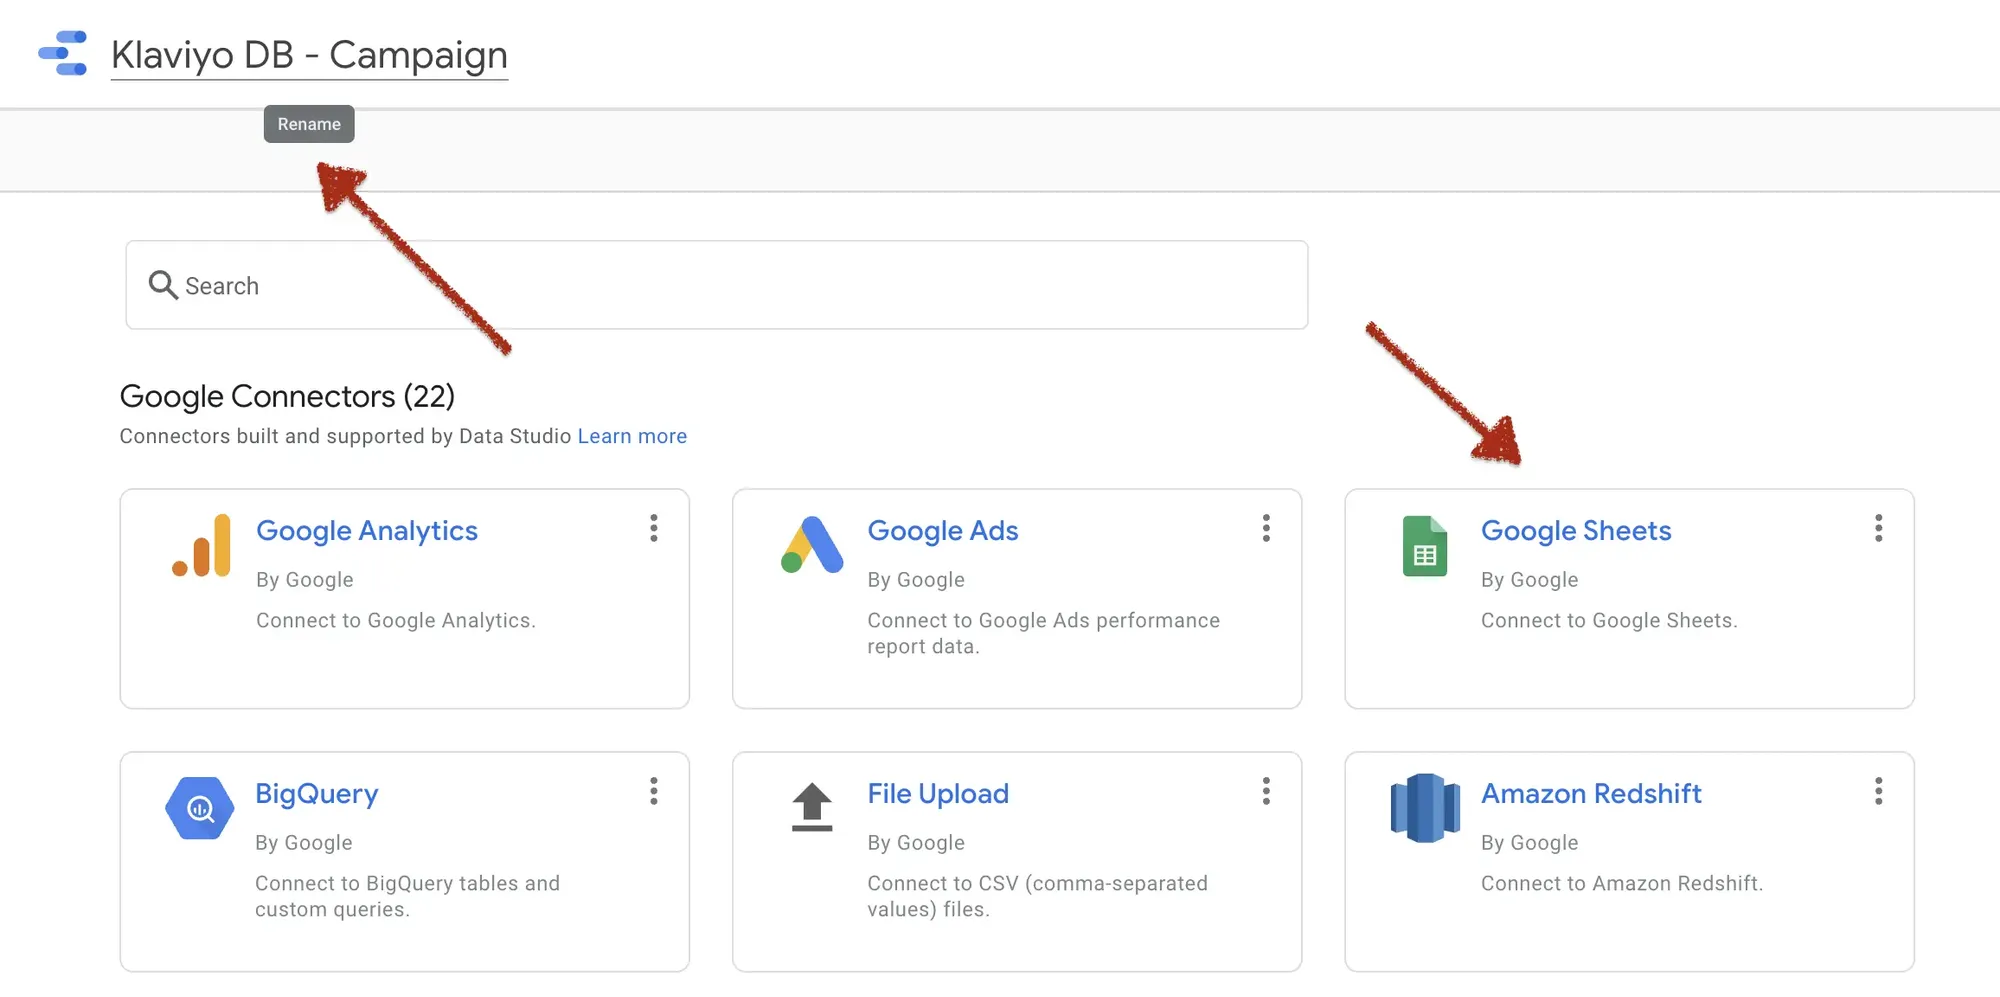
Name the source
Click the title (it should be Untitled Data Source) and change it by own taste. Then, please click the Google Sheets.
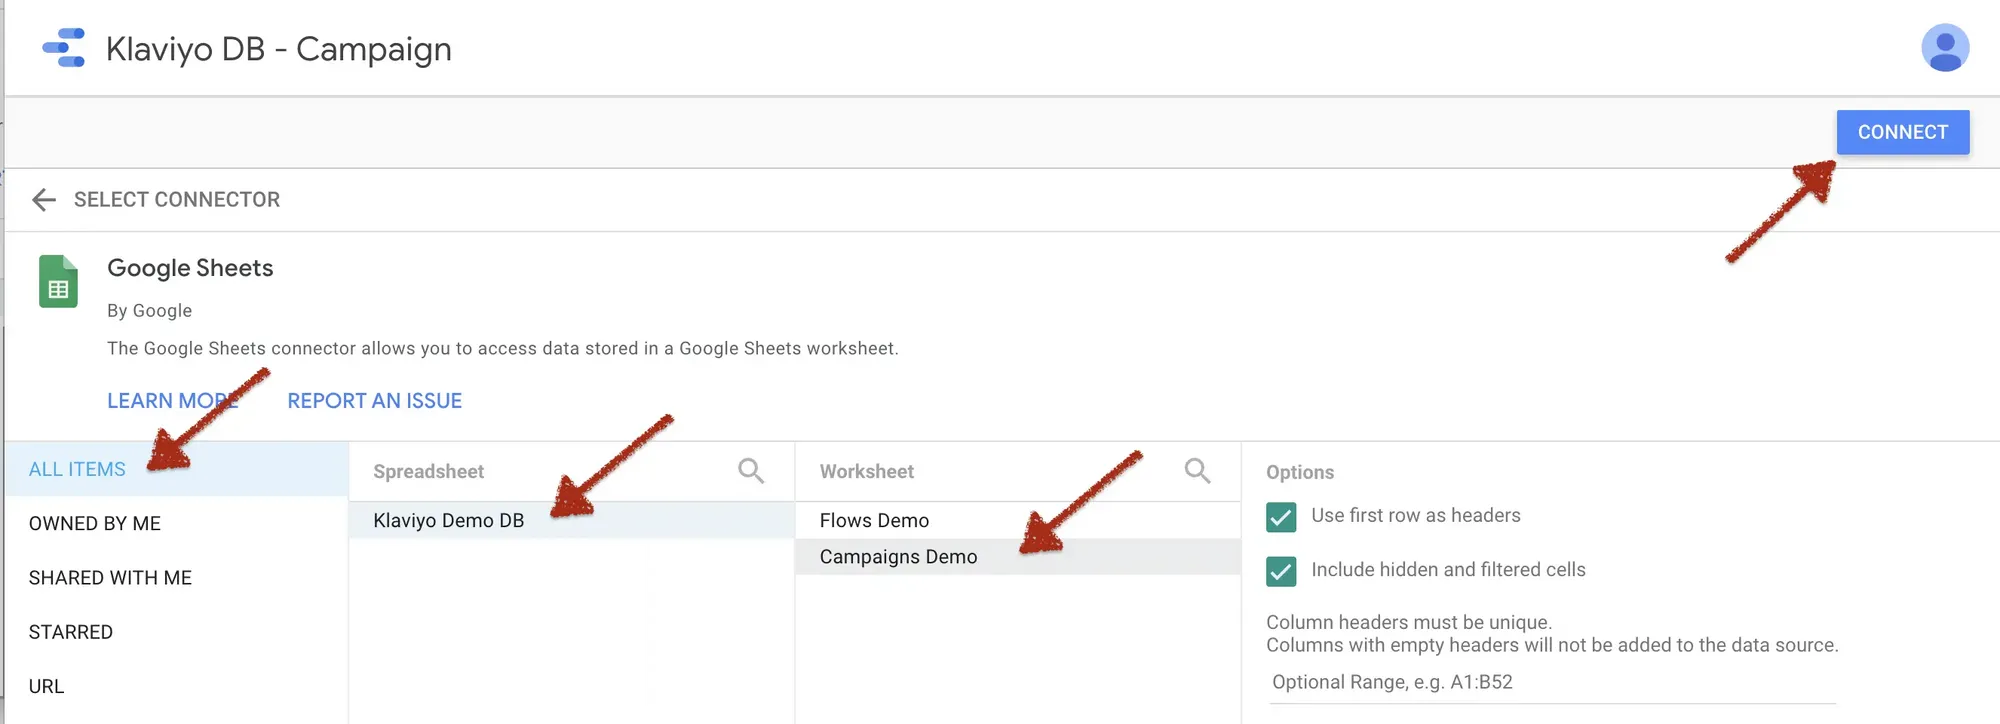
Select campaign tab
You'll see all your Google Sheets documents and the last one should be your Klaviyo export as you did in the previous step. Please select the tab in which you exported campaign data in it and then click "Connect".
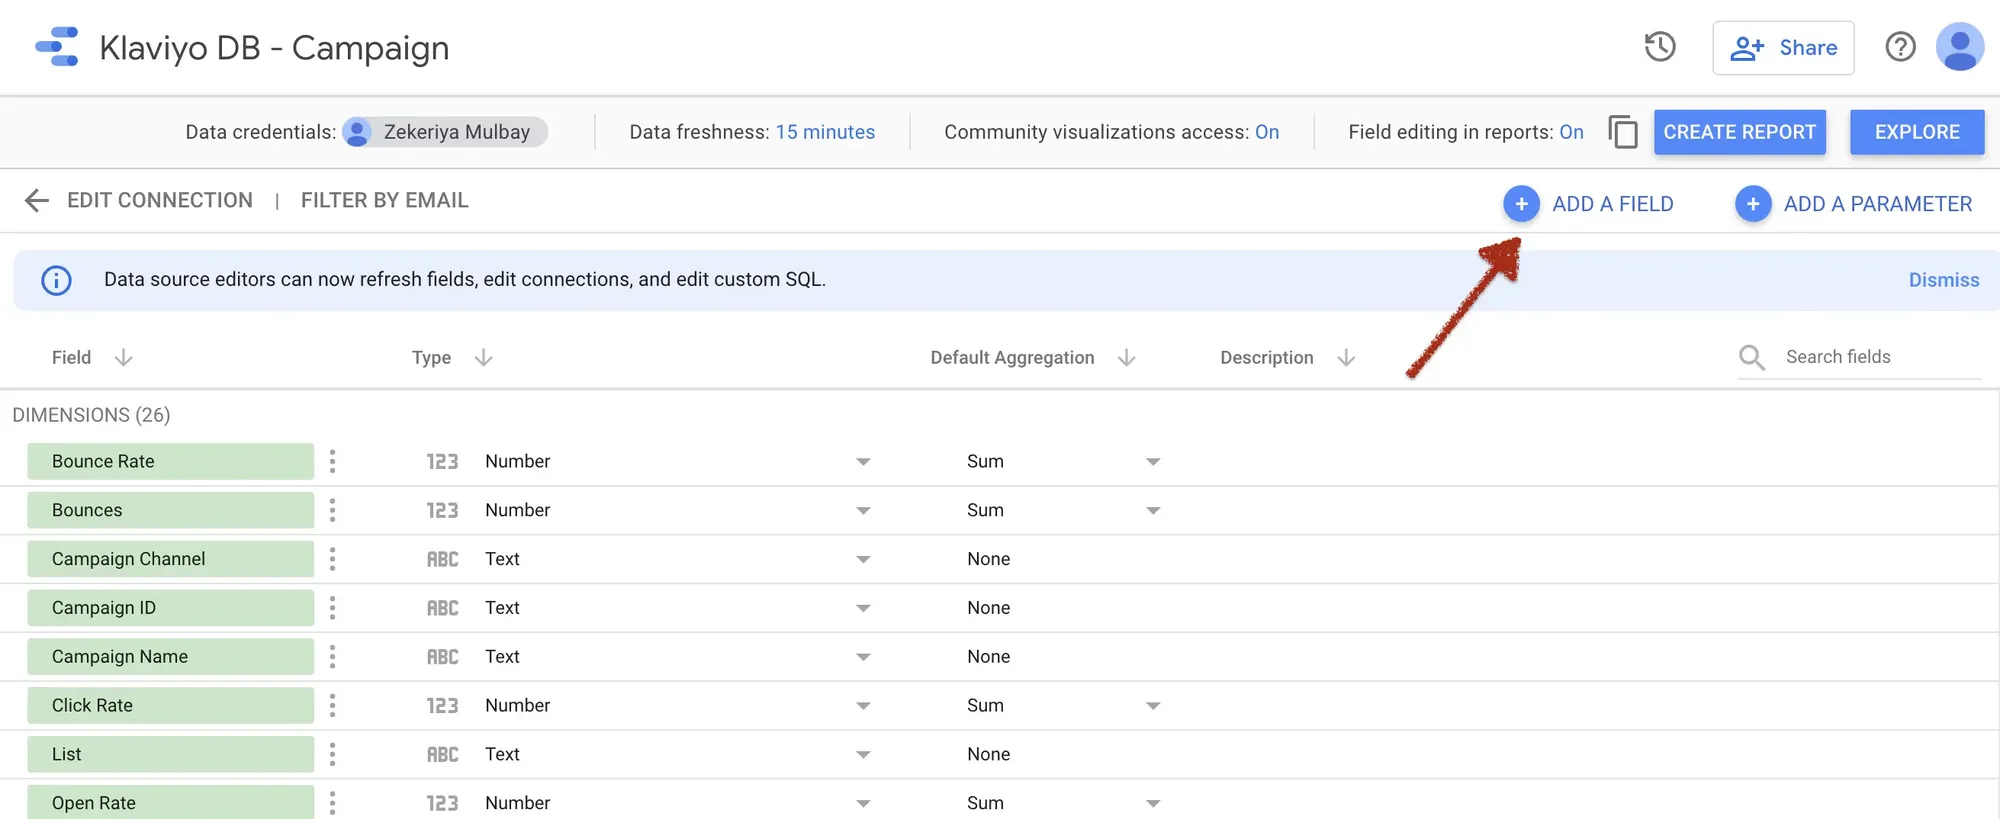
Step 2: Adding calculated metrics
Now we will add some custom metrics which Klaviyo doesn't give or need to be calculated when you view the dashboard. To start this process, please click the "Add a Field" plus icon.
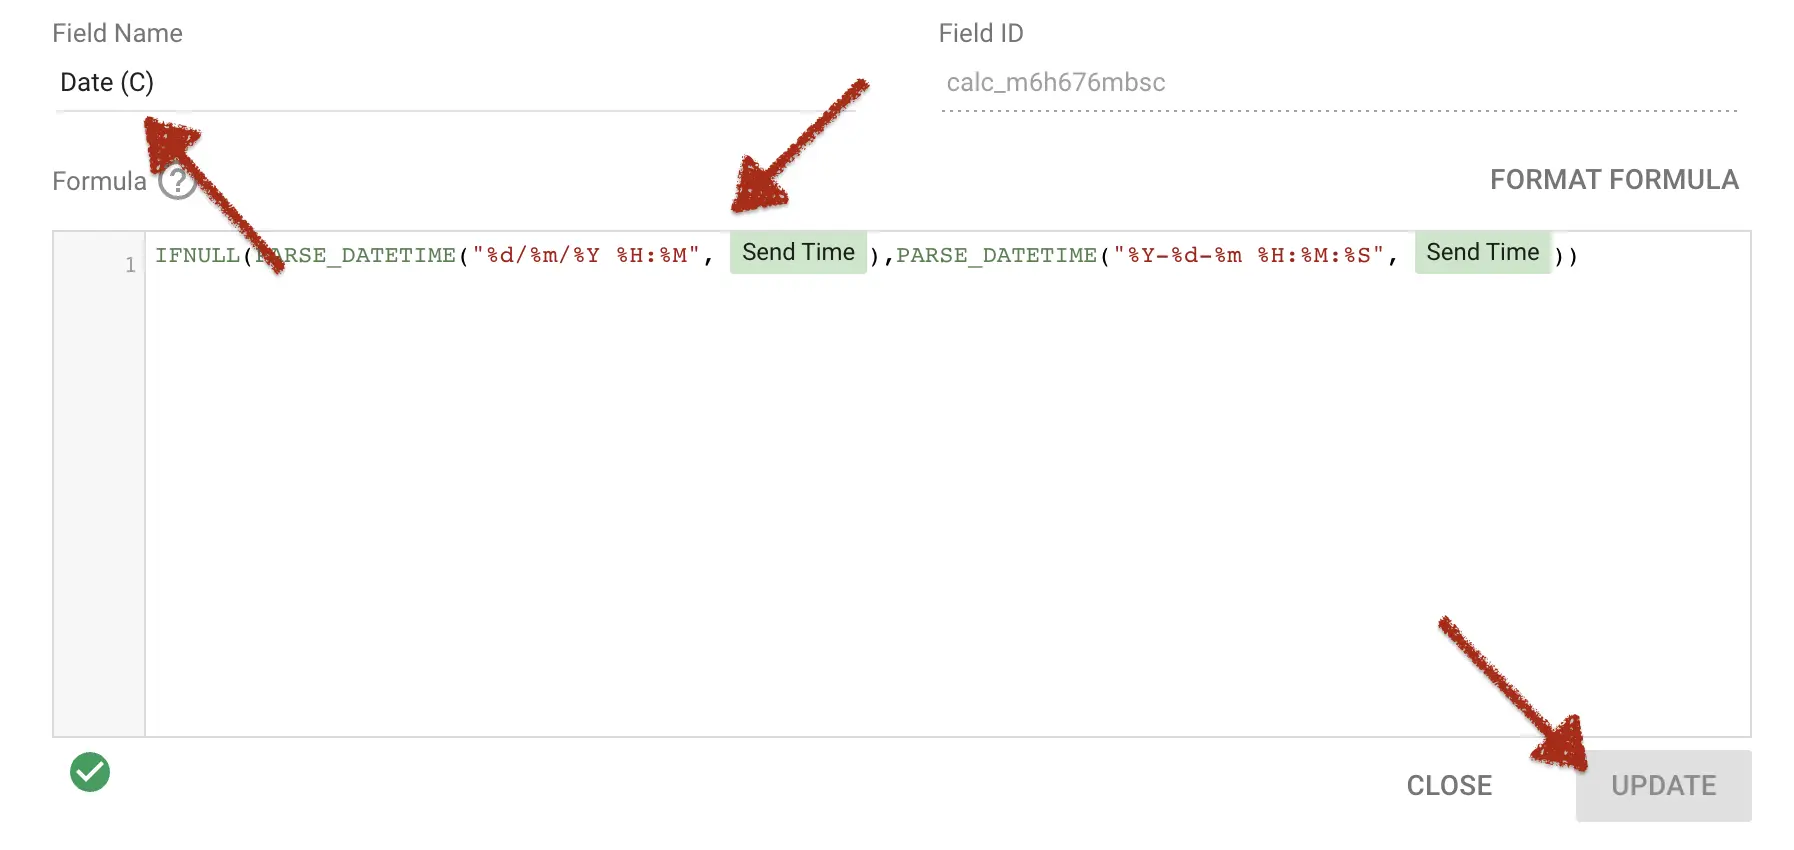
Custom Field Panel
Before proceeding, I'd like to explain the custom field panel:
- Field Name: The name of a new metric or dimension
- Formula: We can handle data in many different ways thanks to GDS functions.
- You need to click the blue button to add/update the field every time.
Custom Fields for Campaign Data
Let's add custom fields to not struggle when we copy the dashboard.
Please be sure to have the same field names in your data source. The fields are case sensitive.
Date (C) → IFNULL(IFNULL(PARSE_DATETIME("%d/%m/%Y %H:%M", CAST(Send Time AS TEXT)),PARSE_DATETIME("%Y-%d-%m %H:%M:%S", CAST(Send Time AS TEXT))),PARSE_DATETIME("%Y-%m-%d %H:%M:%S", CAST(Send Time AS TEXT)))

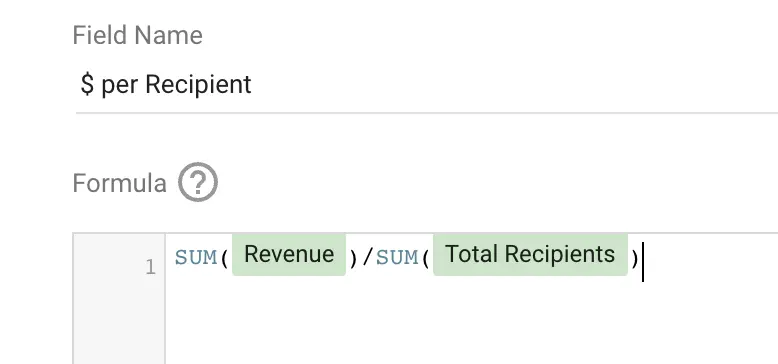
$ per Recipient → SUM(Revenue)/SUM(Total Recipients)
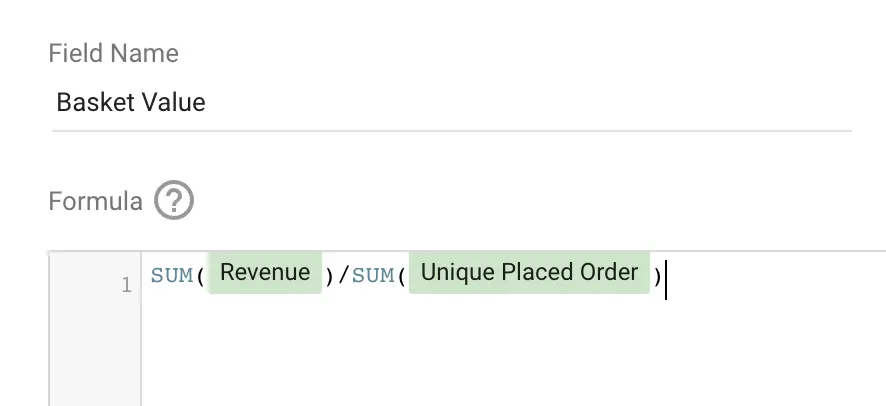
Basket Value → SUM(Revenue)/SUM(Unique Placed Order)
Click → Order % → SUM(Unique Placed Order)/SUM(Unique Clicks)
Open → Click % → SUM(Unique Clicks)/SUM(Unique Opens)
Received → Open % → SUM(Unique Opens)/SUM(Total Recipients)
Received → Click % → SUM(Unique Clicks)/SUM(Total Recipients)
Custom Fields for Flow Data
Let's add custom fields to not struggle when we copy the dashboard.
Please be sure to have the same field names in your data source. The fields are case sensitive.
Date (C) → IFNULL(IFNULL(IFNULL(IFNULL(PARSE_DATETIME("%d/%m/%Y %H:%M", CAST(Day AS TEXT)),PARSE_DATETIME("%Y-%d-%m %H:%M:%S", CAST(Day AS TEXT))),PARSE_DATETIME("%Y-%m-%d %H:%M:%S", CAST(Day AS TEXT))),PARSE_DATETIME("%Y-%d-%m", CAST(Day AS TEXT))),PARSE_DATETIME("%m/%d/%Y", CAST(Day AS TEXT)))
$ per Recipient → SUM(Revenue)/SUM(Delivered)
Basket Value → SUM(Revenue)/SUM(Unique Placed Order)
Click → Order % → SUM(Unique Placed Order)/SUM(Unique Clicks)
Open → Click % → SUM(Unique Clicks)/SUM(Unique Opens)
Received → Open % → SUM(Unique Opens)/SUM(Delivered)
Received → Click % → SUM(Unique Clicks)/SUM(Delivered)
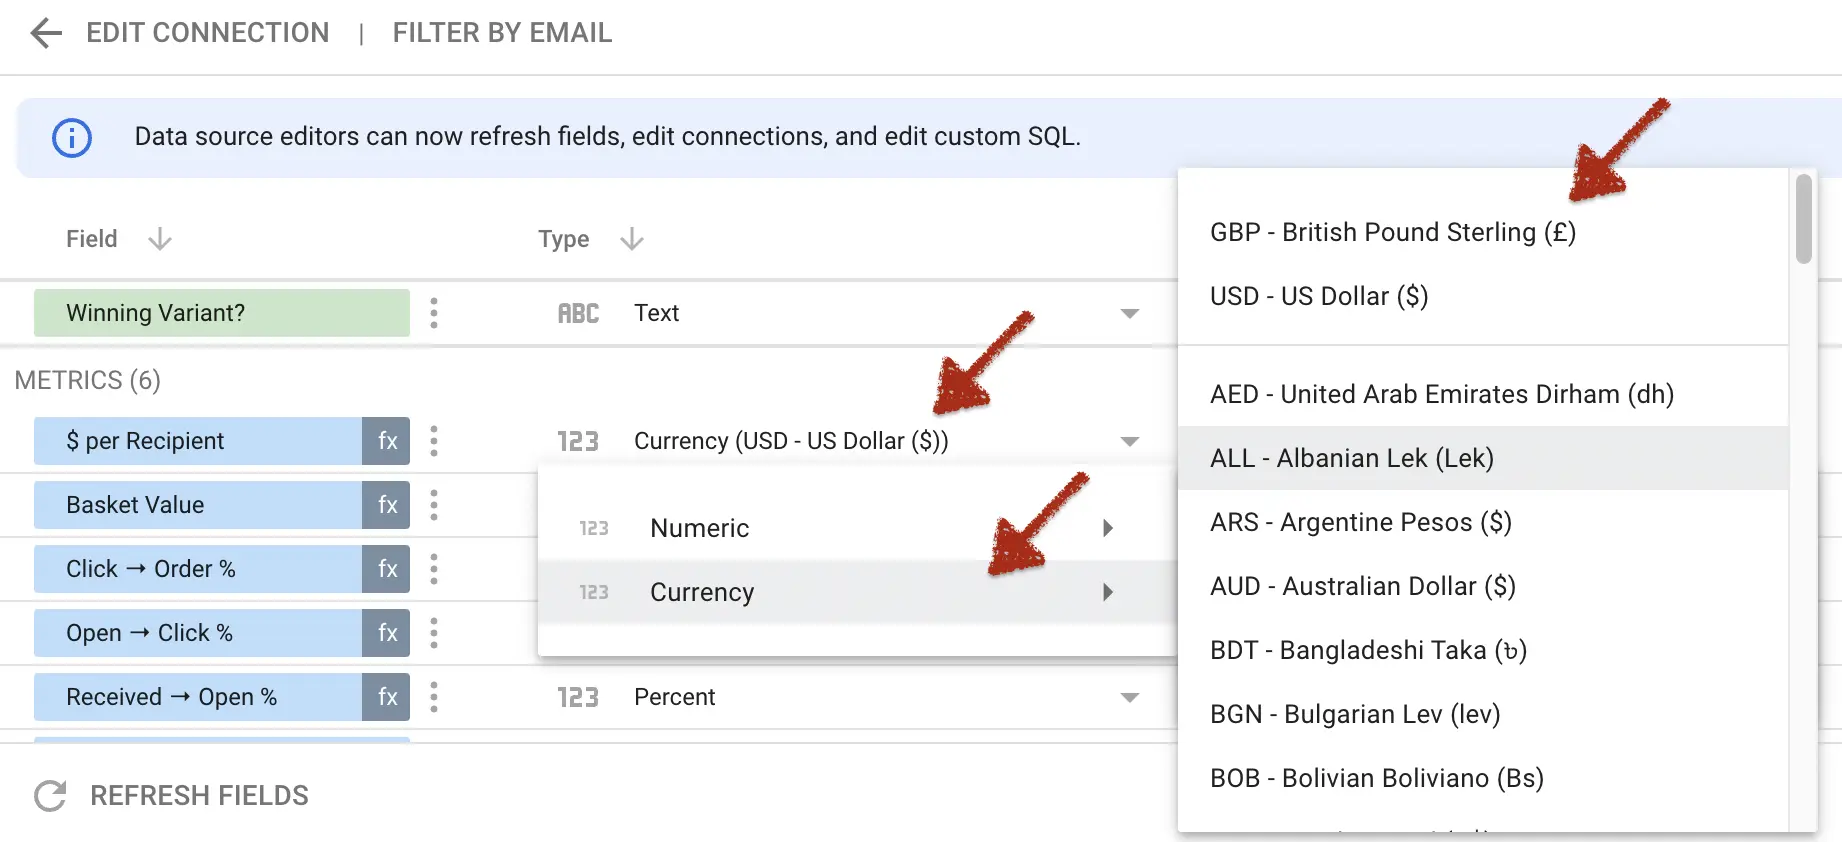
Adjust the format
Please change the metric format like below.

If your account has a different currency than $ then, you can click the dropdown on the right side of the metric and select the appropriate currency.
Step 3: Create GDS Data Source for Flow Data
You know what to do if you follow steps for campaign data, lets's walk through briefly:
- Create a new data source by visiting this link
- Change the source name
- Select Google Sheets as the data source and find the Sheets and tab where your campaign data be placed in.
- Then add the following custom fields and adjust the format (you can check the last section of the previous topic if you don't know how to do it)
If you see the below screen without any dimension appearing on the left side then, please check the Klaviyo export and remove the first blank rows and reconnect the data source again.
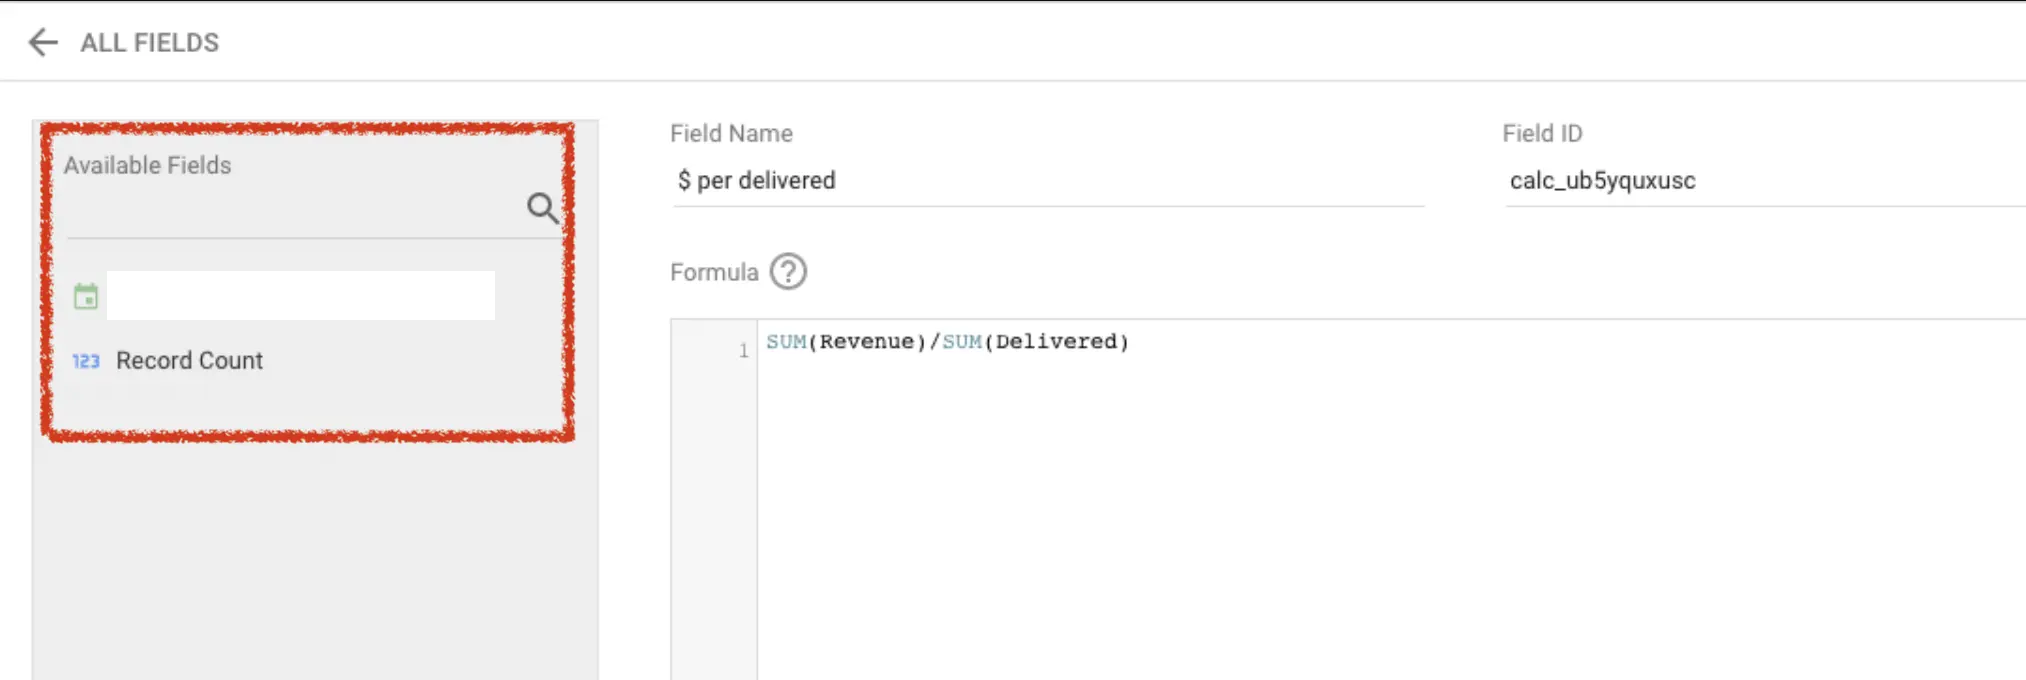
Here are custom fields we will need to have:
- $ per delivered → SUM(Revenue)/SUM(Delivered)
- Basket Value → SUM(Revenue)/SUM(Placed Order)
- Click → Order % → SUM(Placed Order)/SUM(Unique Clicks)
- Open → Click % → SUM(Unique Clicks)/SUM(Unique Opens)
- Received → Open % → SUM(Unique Opens)/SUM(Delivered)
- Received → Click % → SUM(Unique Clicks)/SUM(Delivered)
Step 4: Copy the Dashboard
This is the most exciting part of the process. Please open the link to the dashboard you purchased.
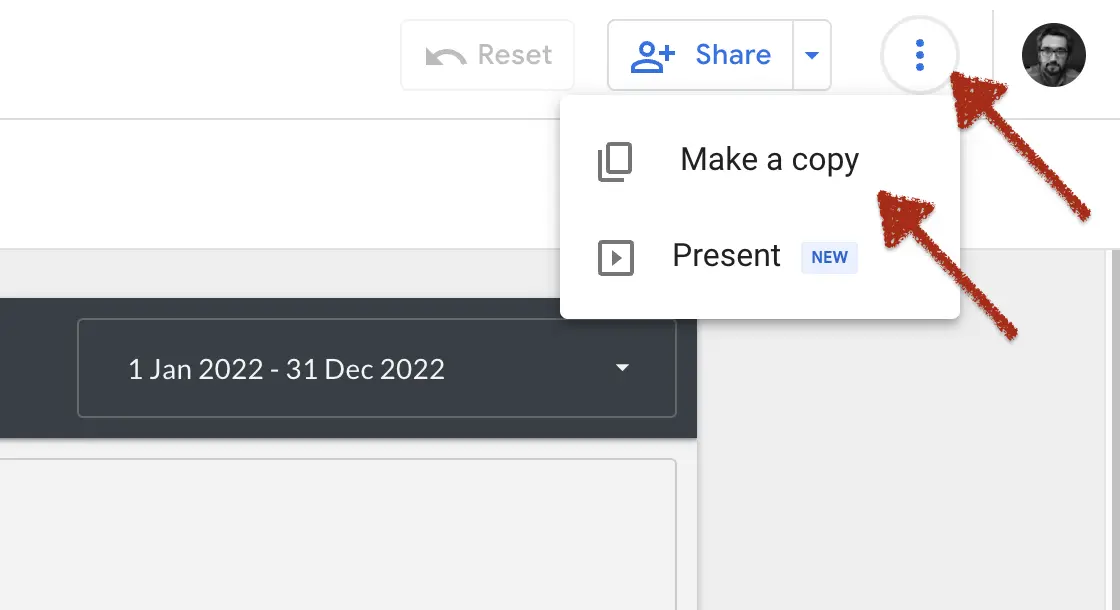
Click make a copy
You will find this option on the top right part of the dashboard. You may need to hover on the header for a few seconds to see these dots.
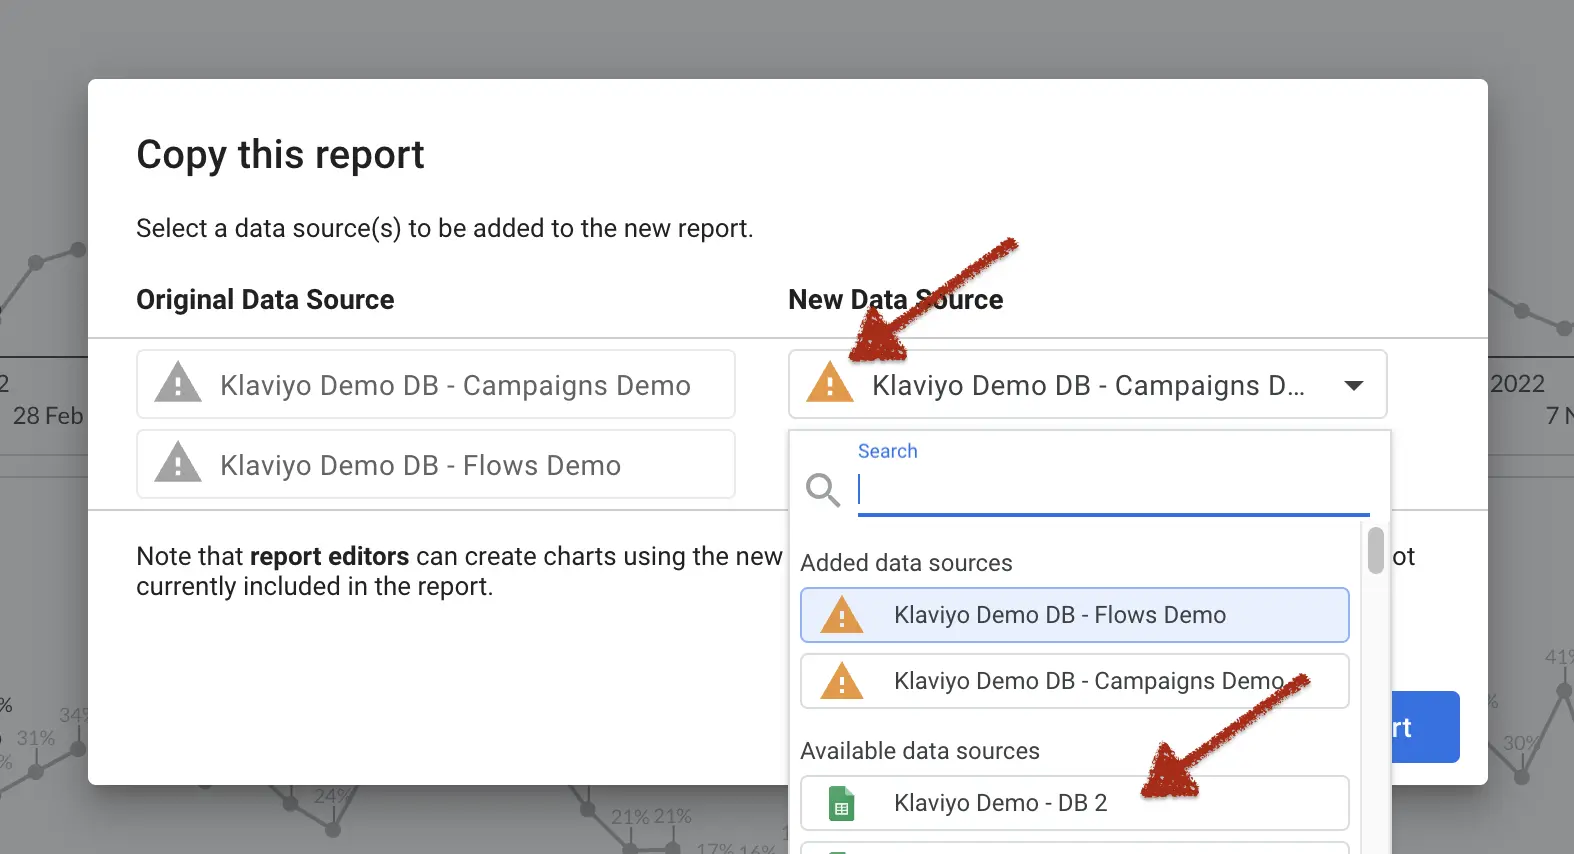
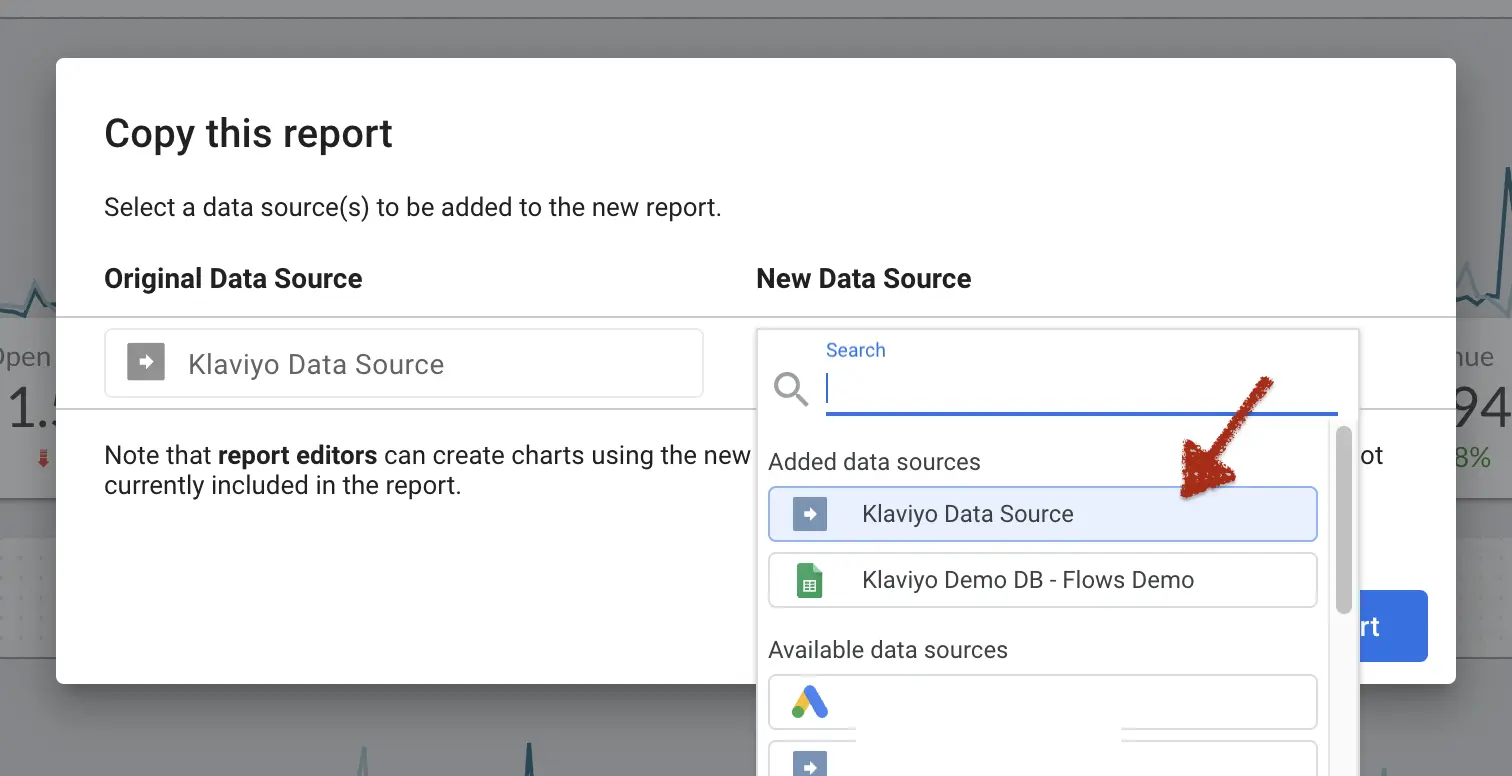
Select data sources
You have already prepared your data sources in the previous sections. So, please select these data sources by using the dropdown.
These data sources should be under the "Available data sources" part of the dropdown.
Copy the dashboard
Then, click the blue "Copy the report" button. If you did everything above, you should have your own dashboard right now.
Congratulations!
How to copy this dashboard? [Supermetrics edition]
Step 1: Create GDS Data Source
We need to create data sources before creating the dashboard. Please visit this link or navigate to the top-left button and click Create → Data Source to create a new data source.

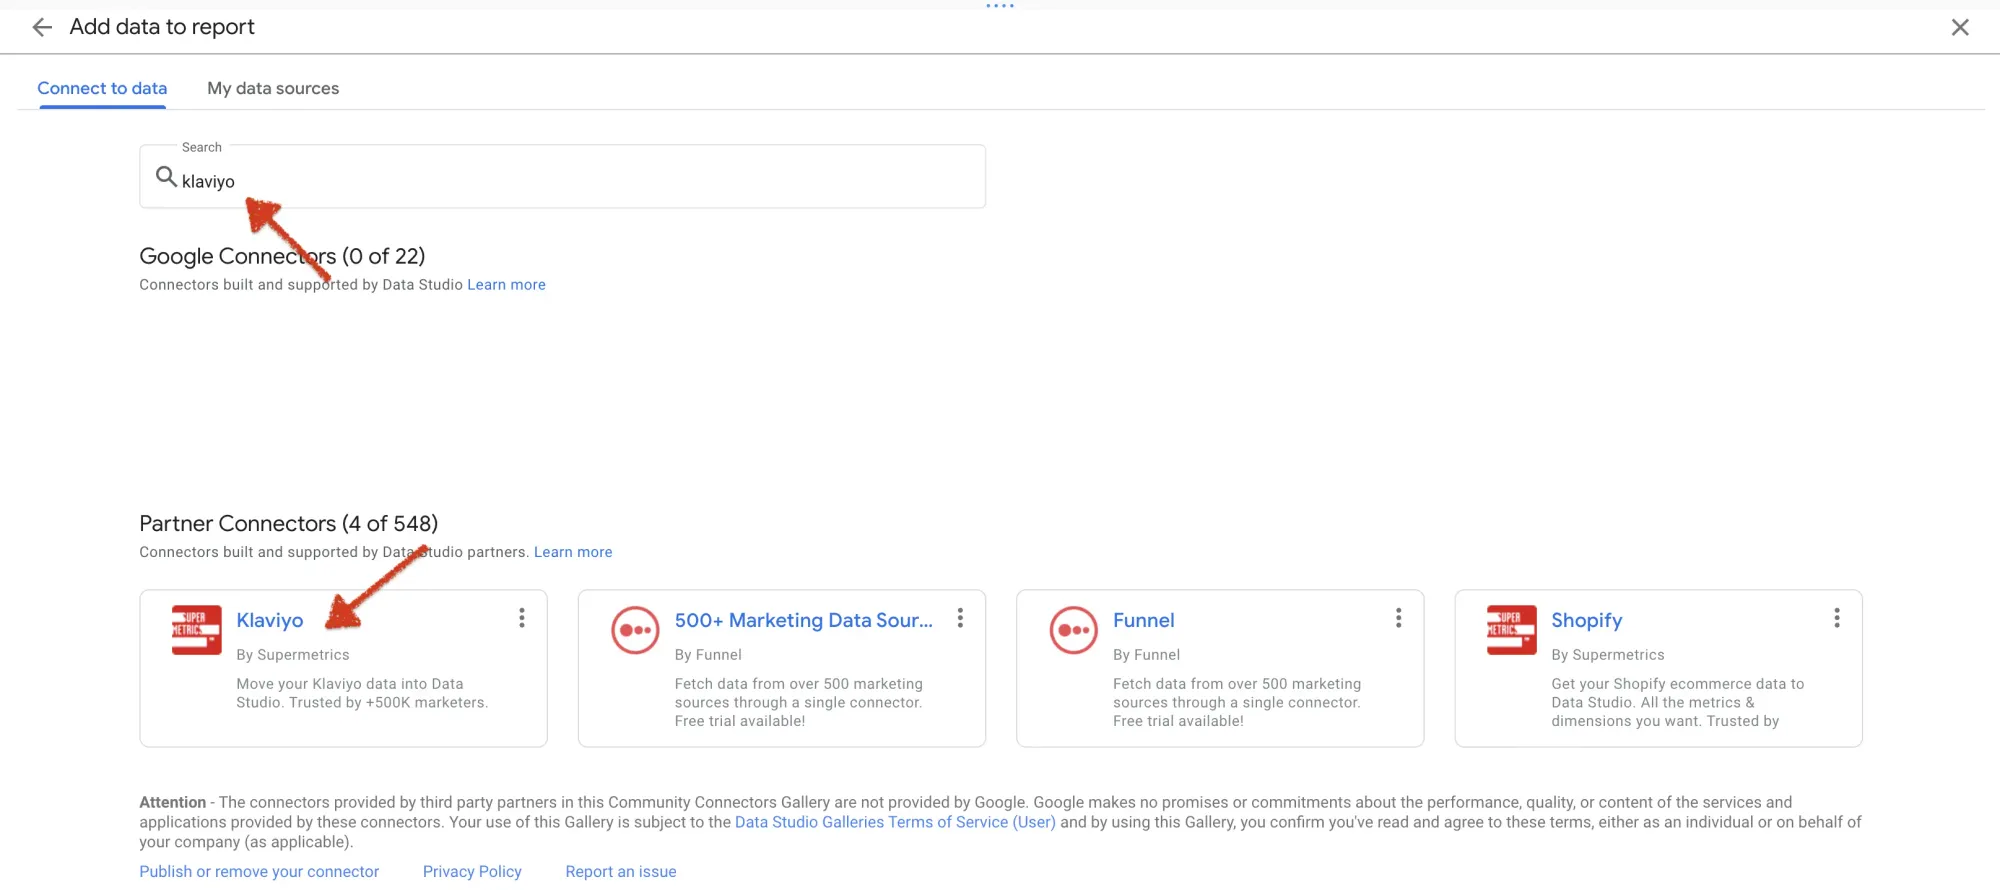
Find the Supermetrics Klaviyo connector
Search for "klaviyo" and select Supermetrics connector.
Click & Authorise
Click the Klaviyo by Supermetrics data source and then click the blue button to authorize by your credentioals.
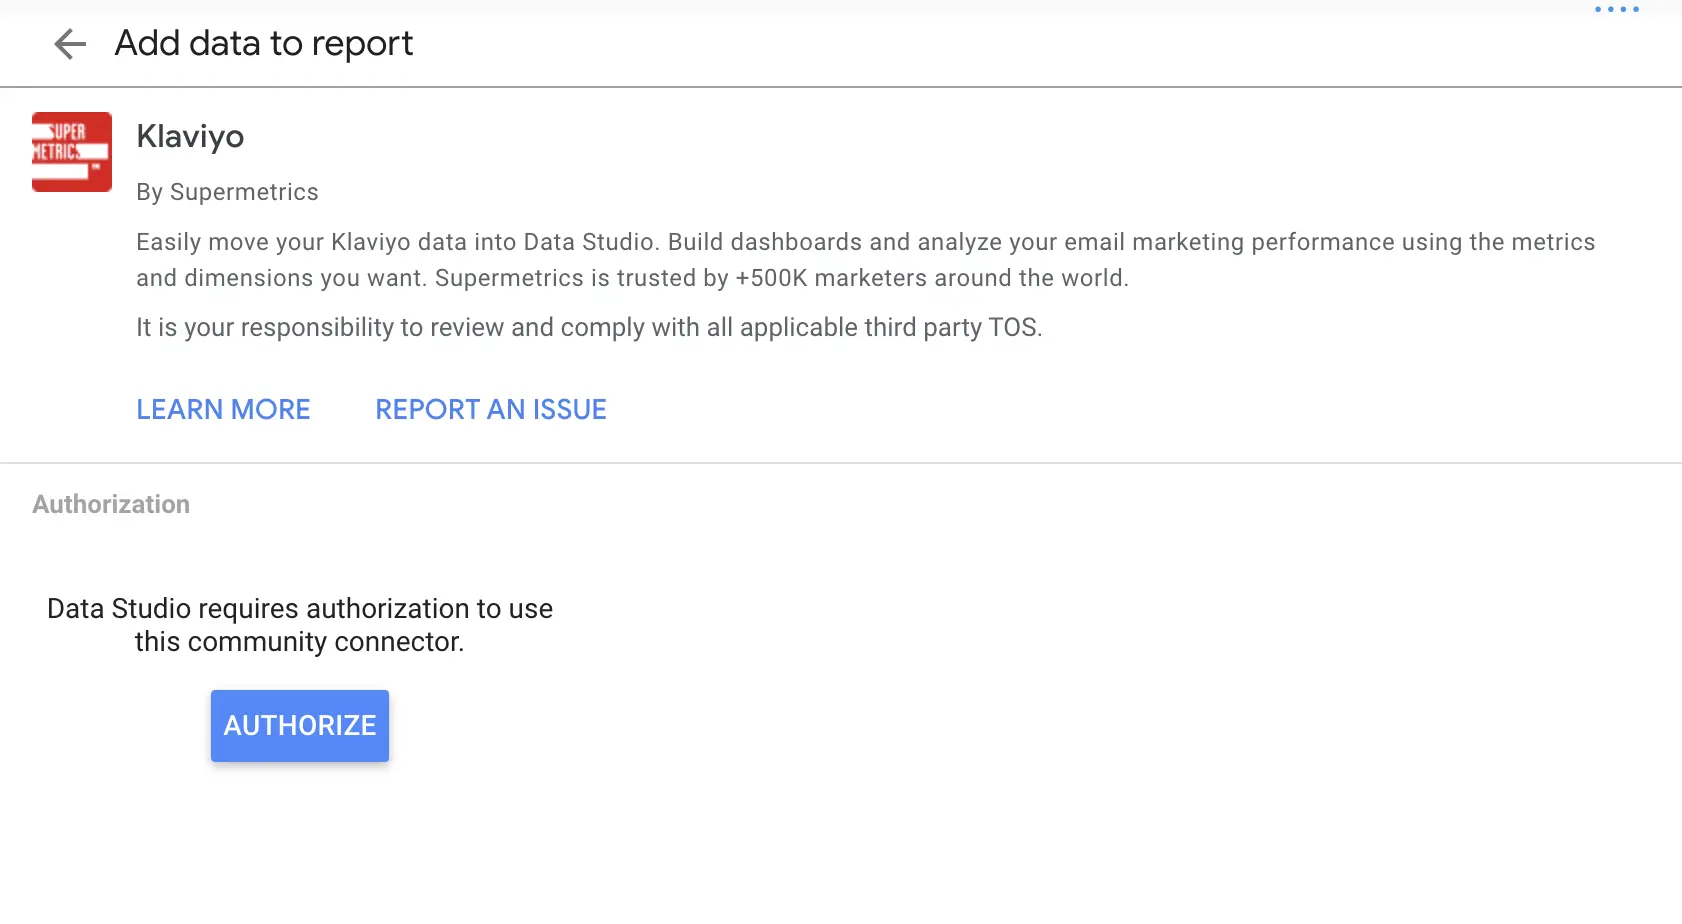
The first step is the Google Data Studio authorization. You should select your email address that would like to work and allow to connect an external data source.
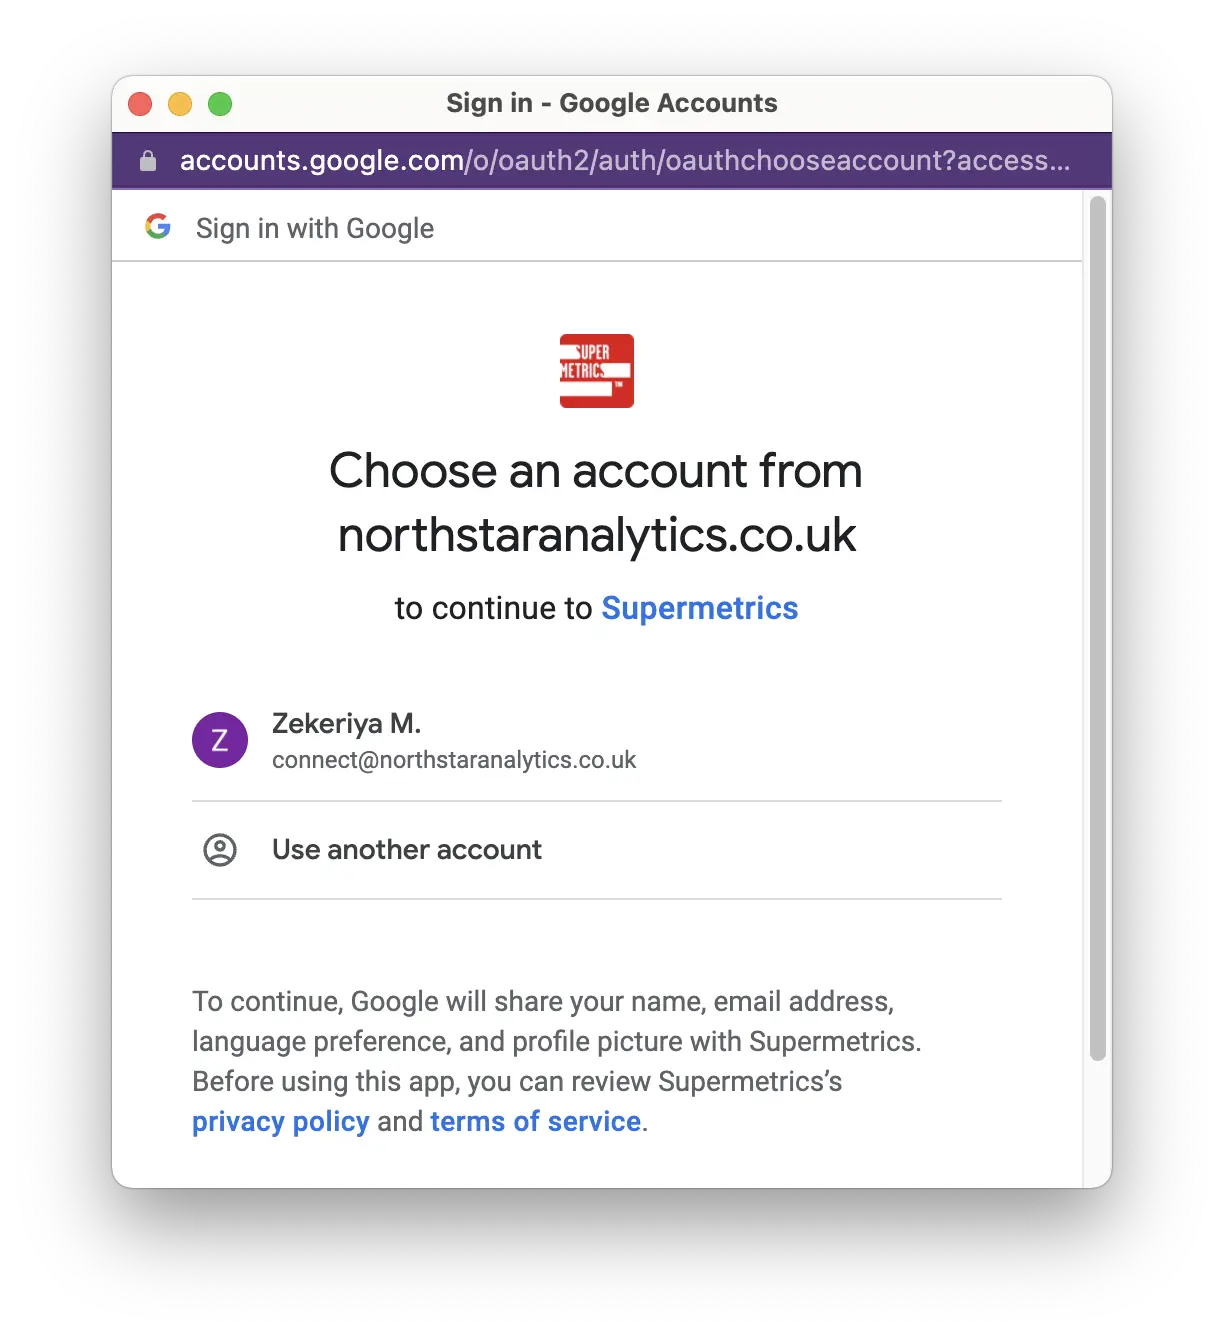
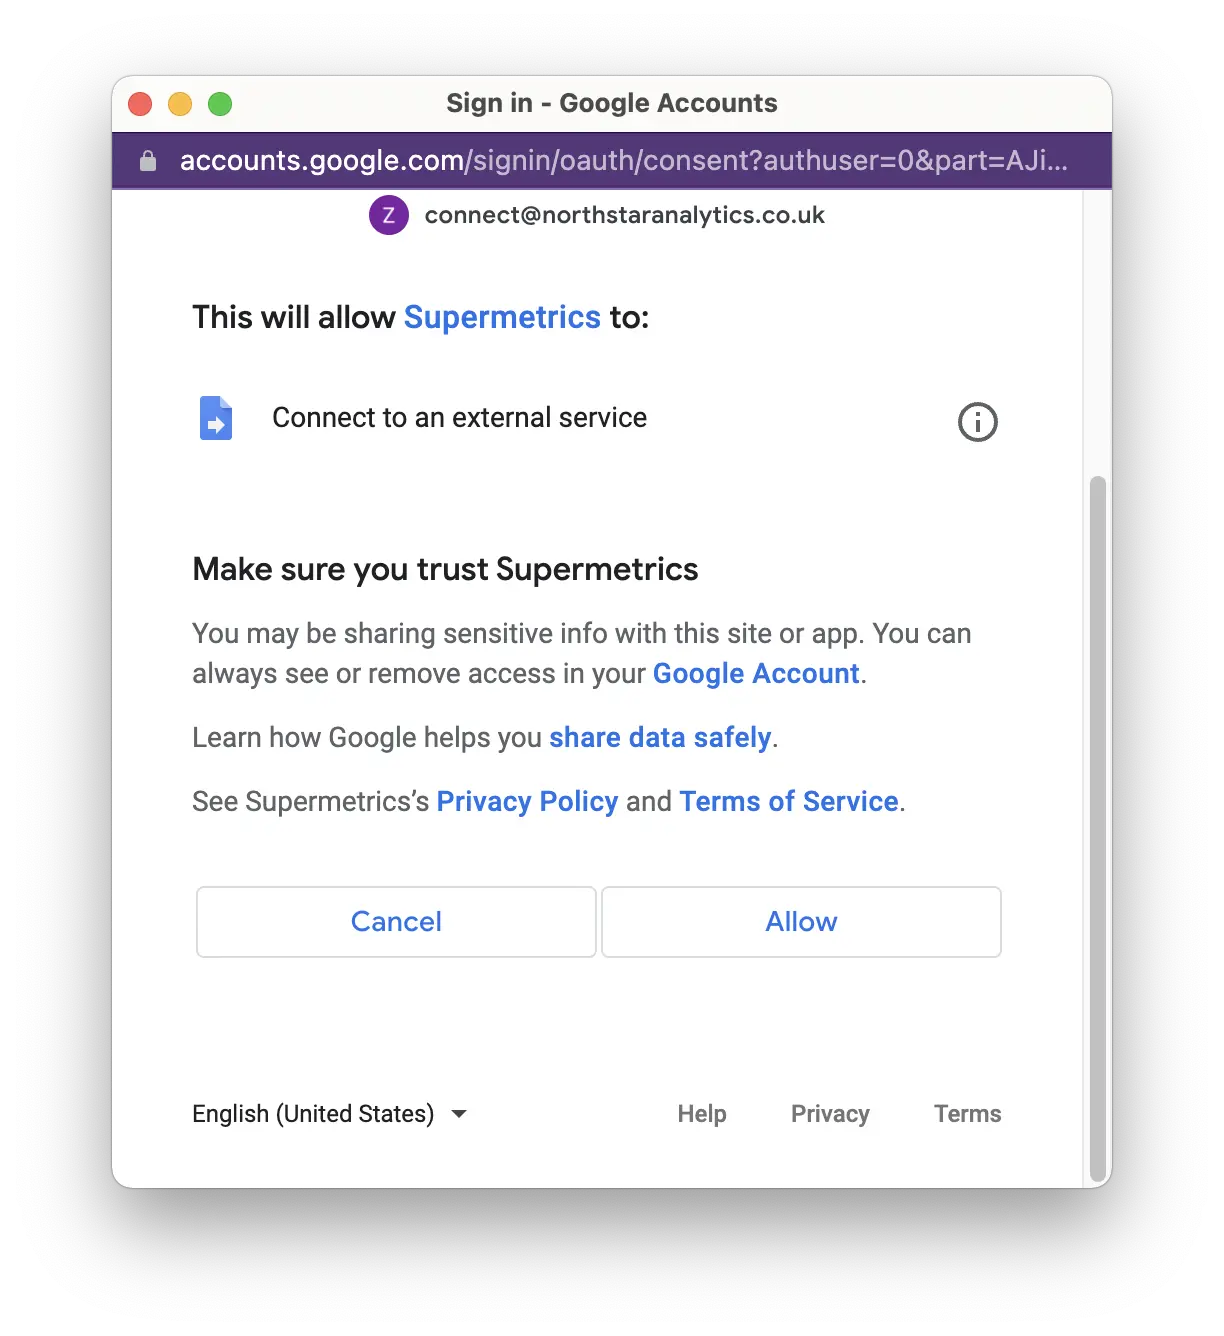
Then, you will connect your Klaviyo account. You should have Supermetrics account with Klaviyo data source connected.
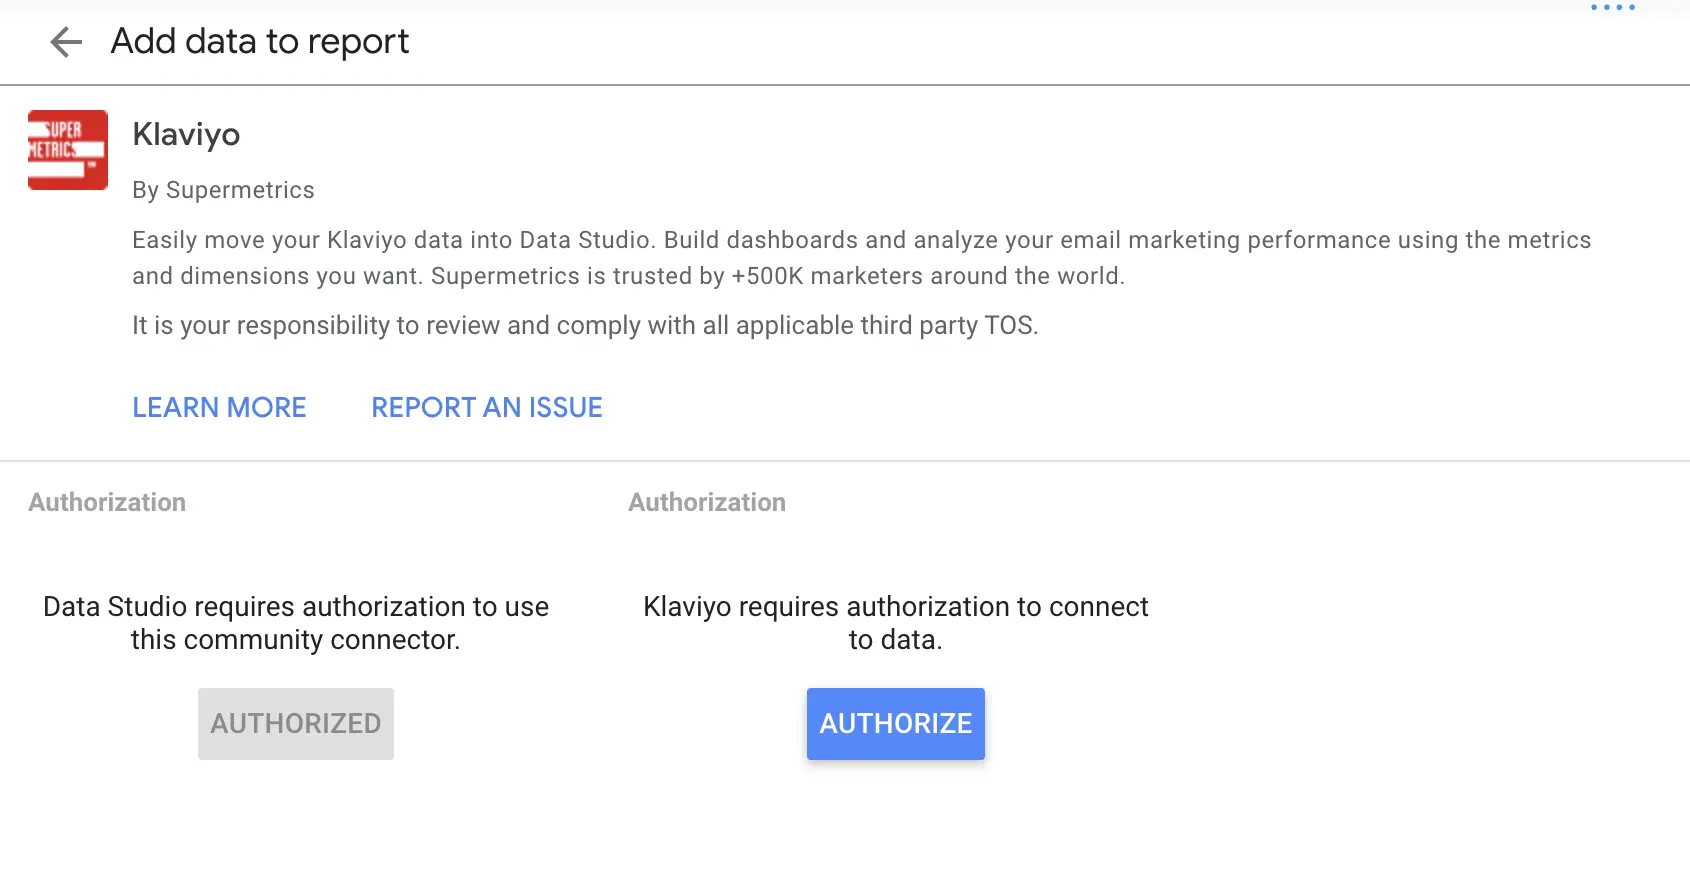
Select your team and add new Klaviyo account. You can click the below URL to access your API keys:
https://www.klaviyo.com/account#api-keys-tab
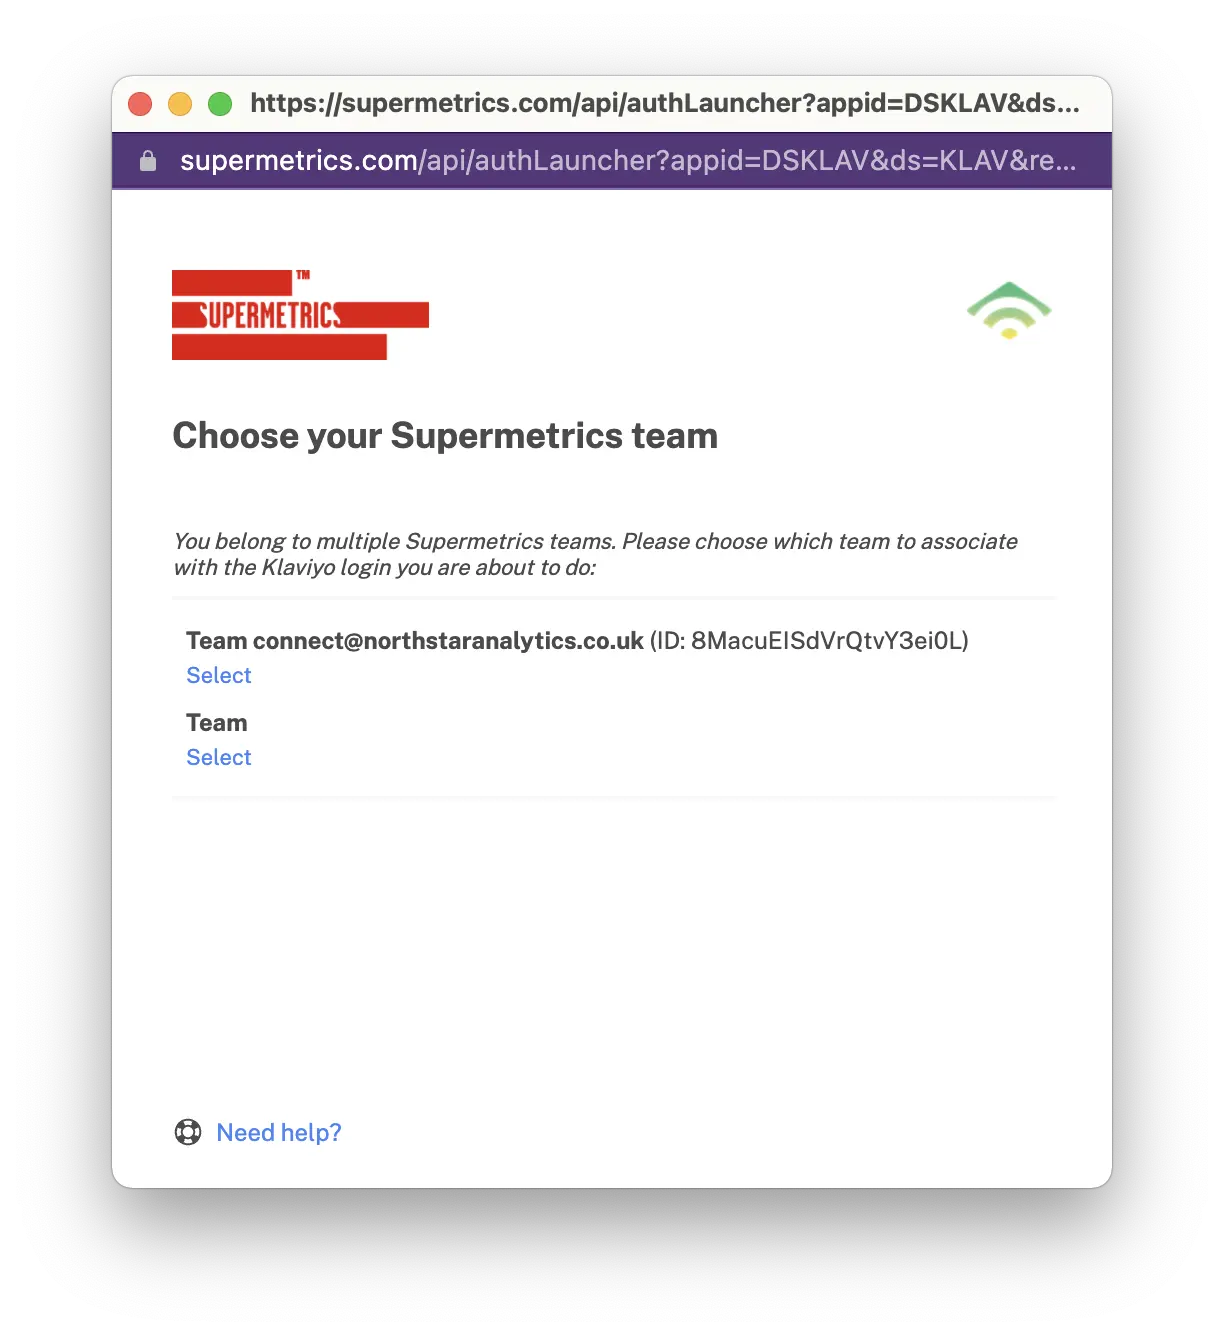
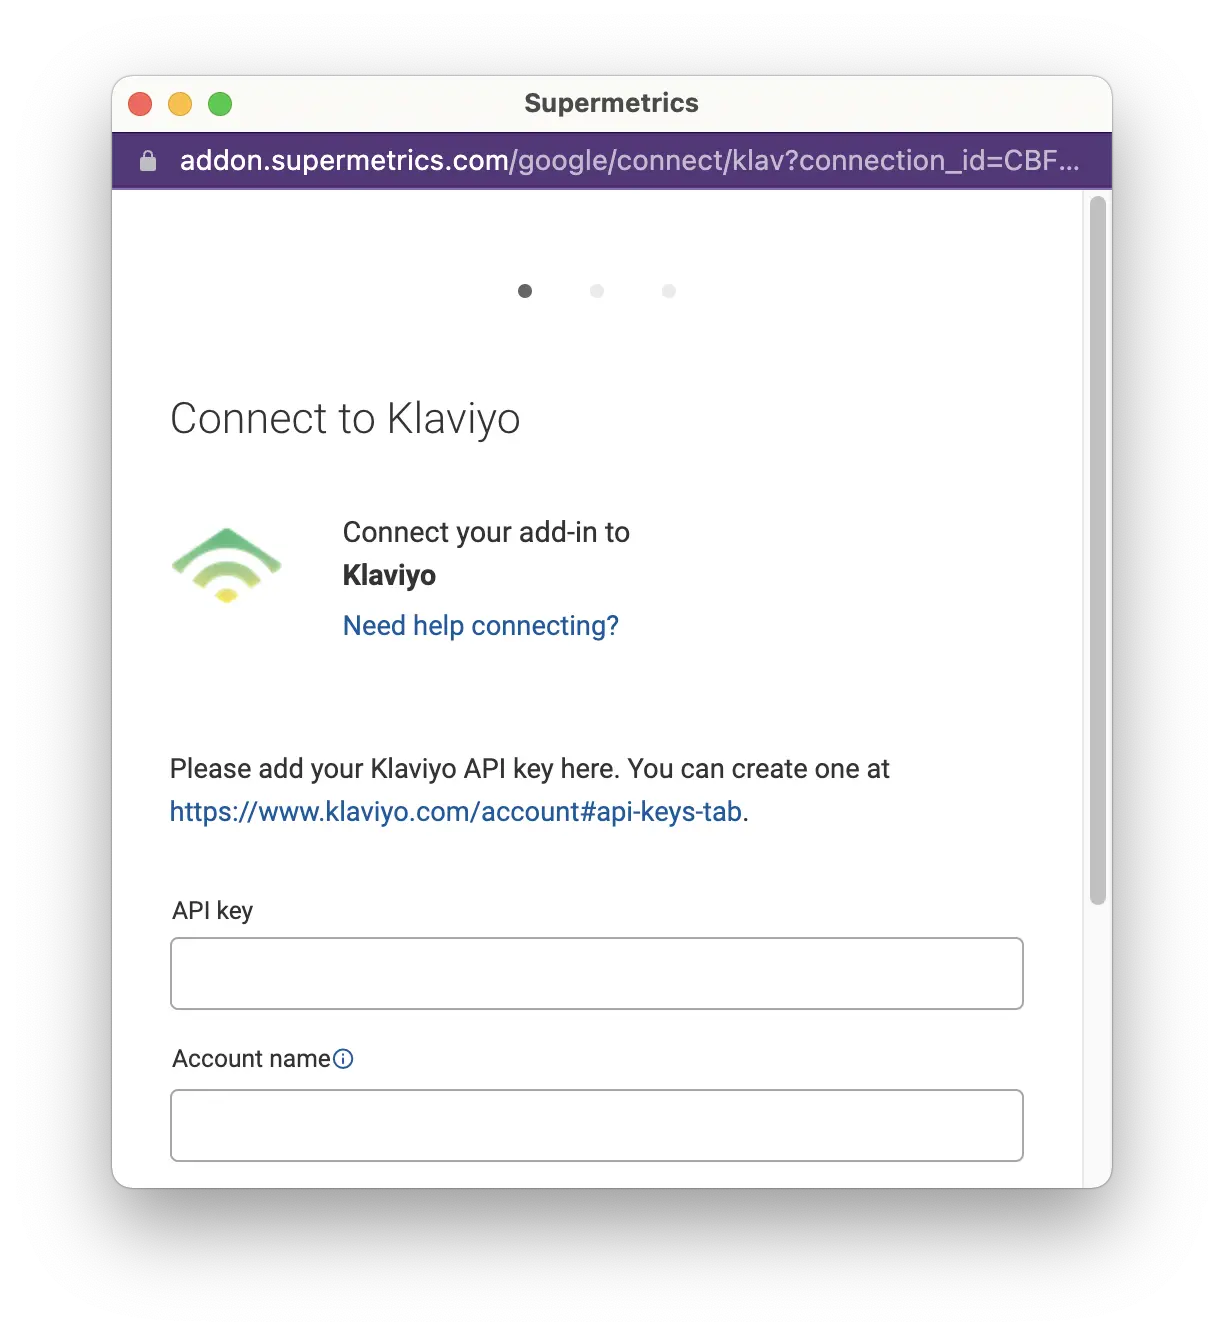
You are ready to connect to Klaviyo. Click the blue "Continue" button to finalize the process.
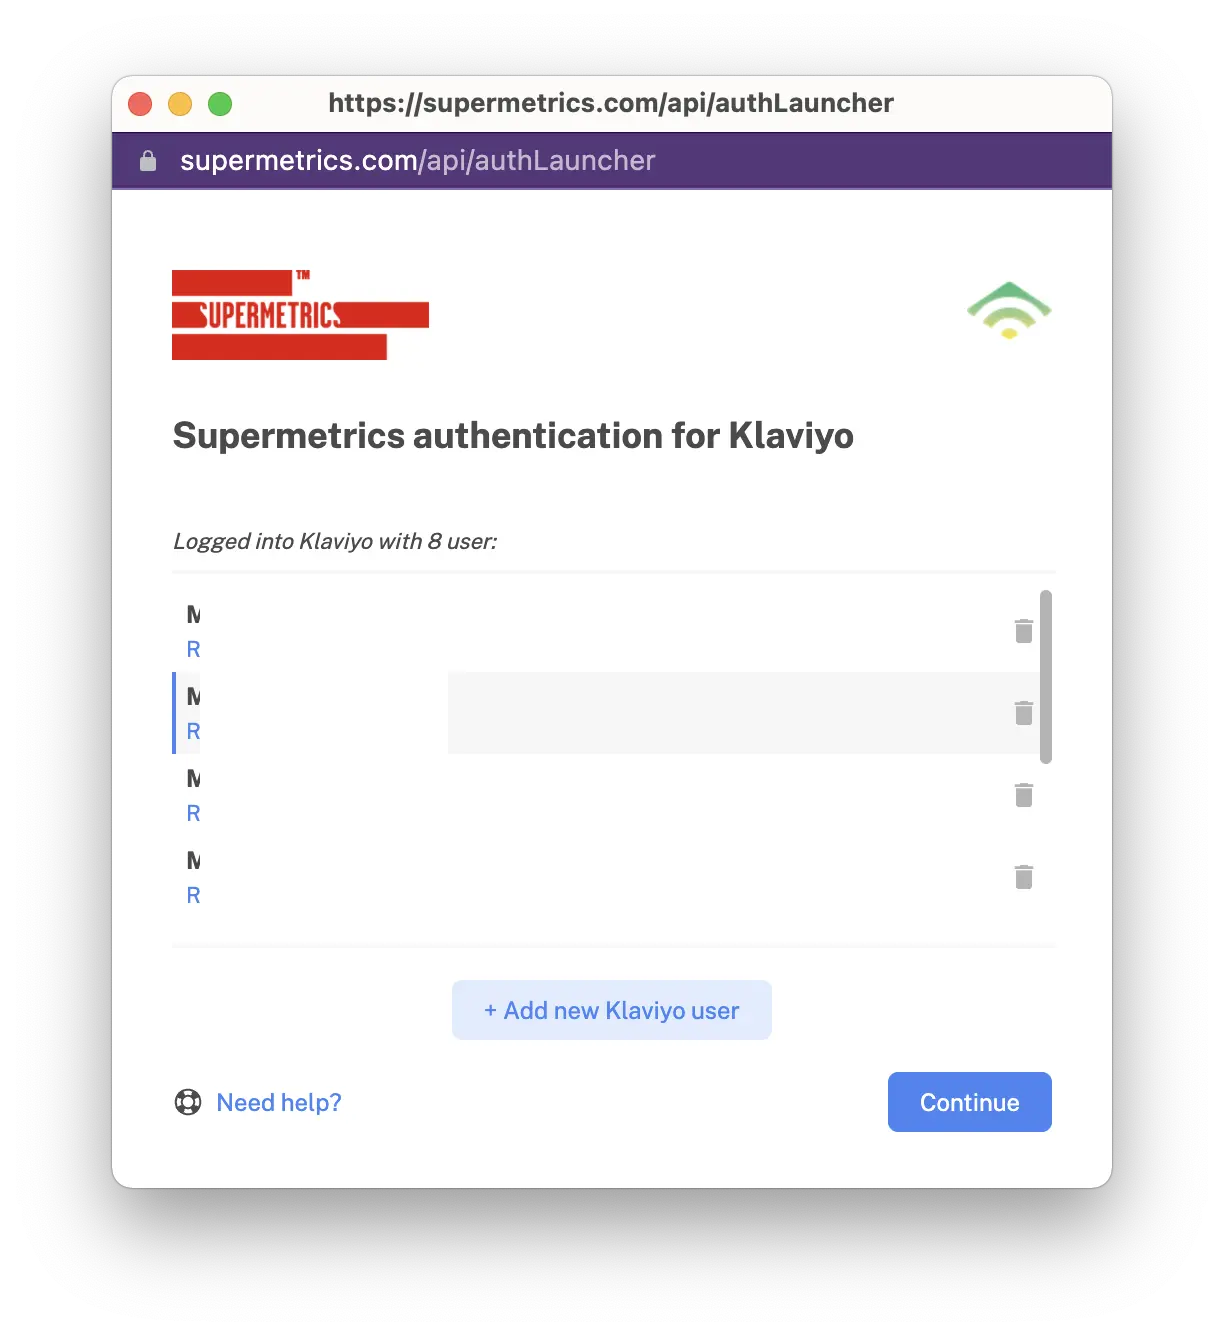
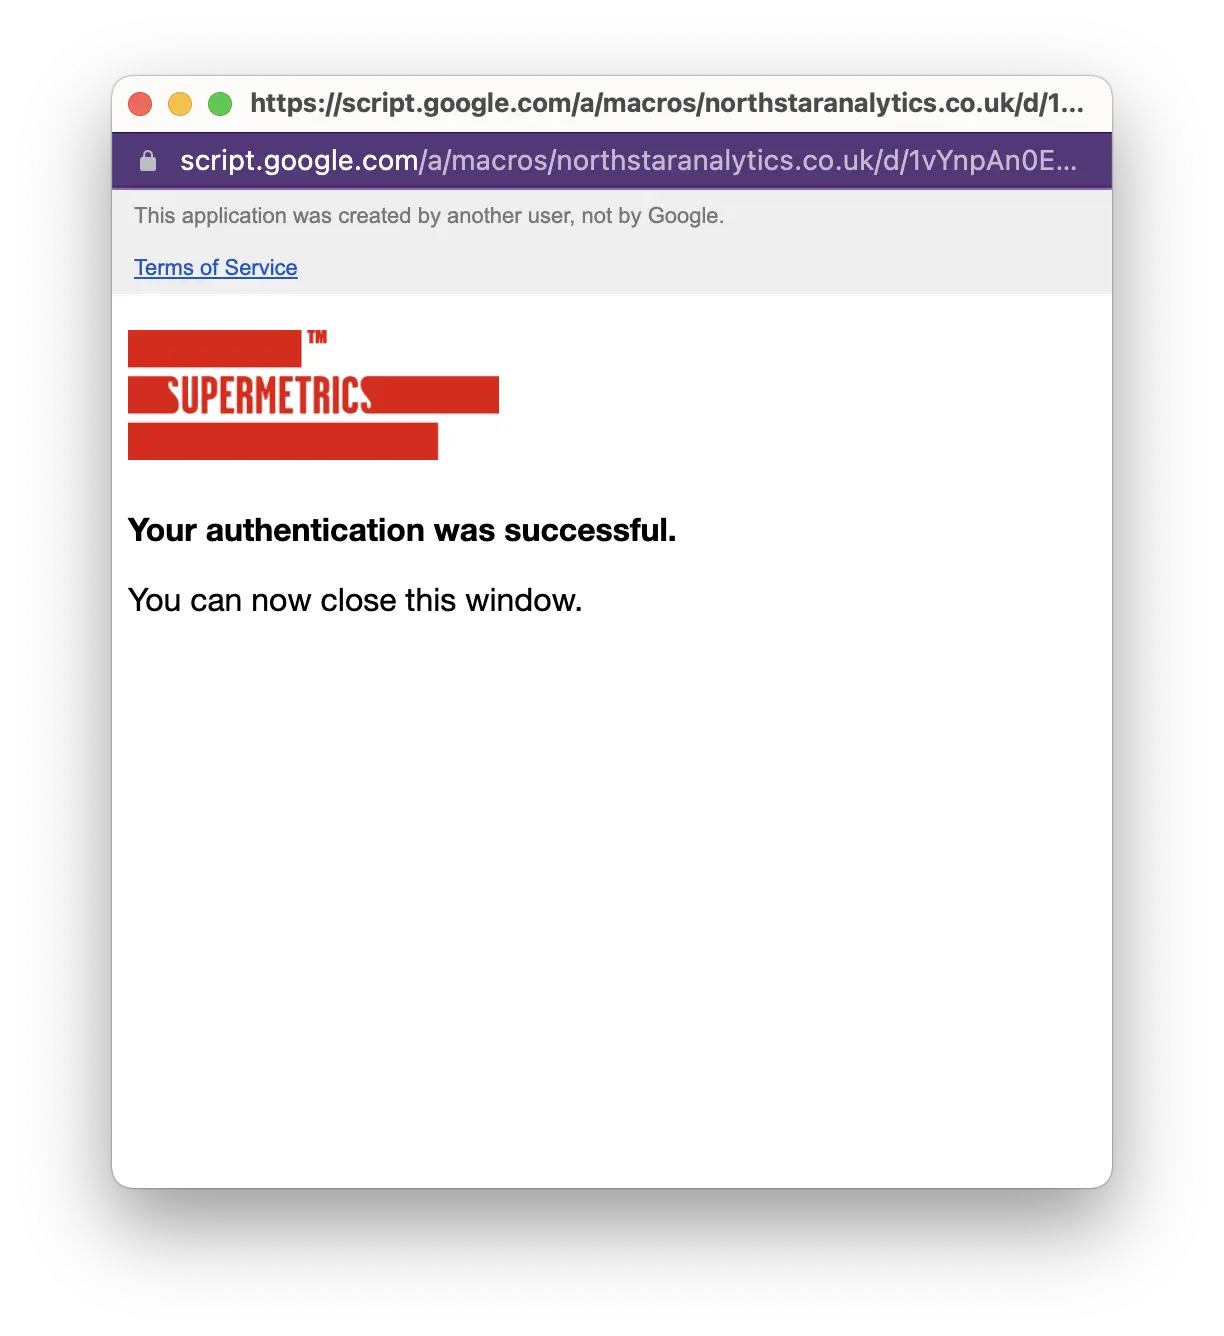
Select Klaviyo accounts
Select all the necessary Klaviyo accounts you would like to see on the dashboard. You'll have the account selector so, you can see each account's performance separetely.
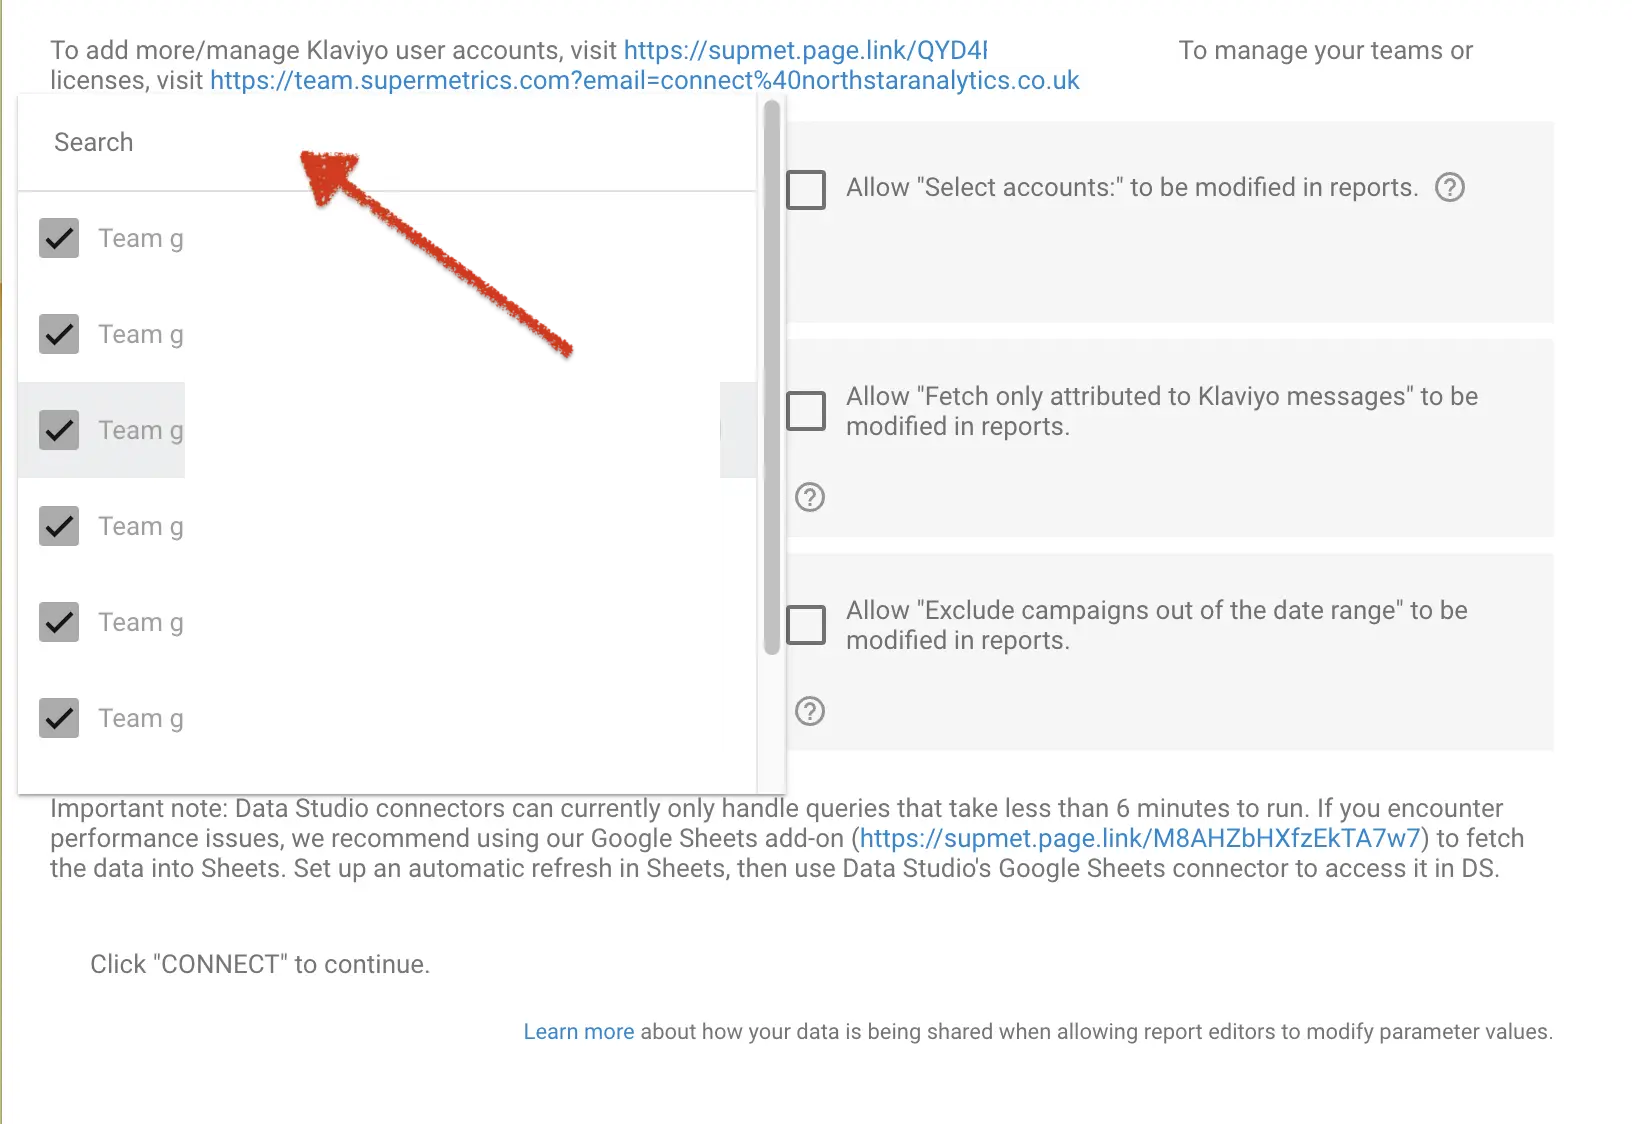
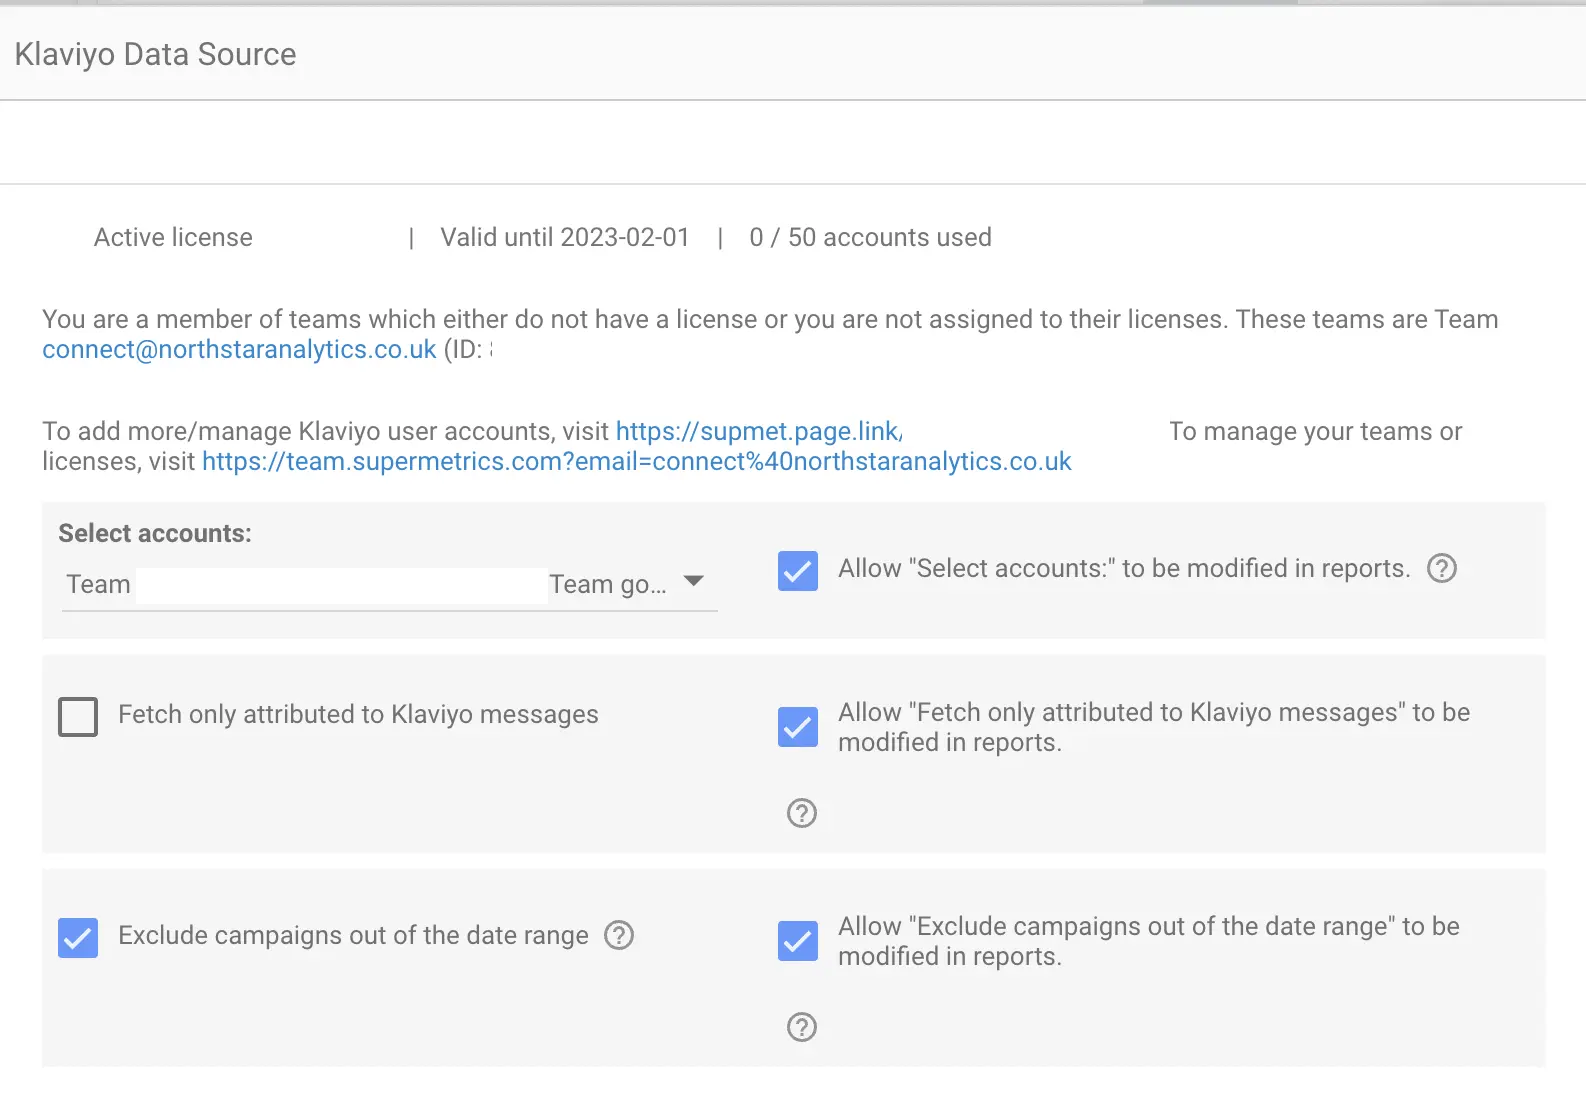
Connection Configuration
I suggest selecting the following options:
- Allow select accounts: This will allow us to see individual accounts.
- Exclude campaigns out of the date range: This will prevent you to not seeing all-null campaigns on the dashboard.
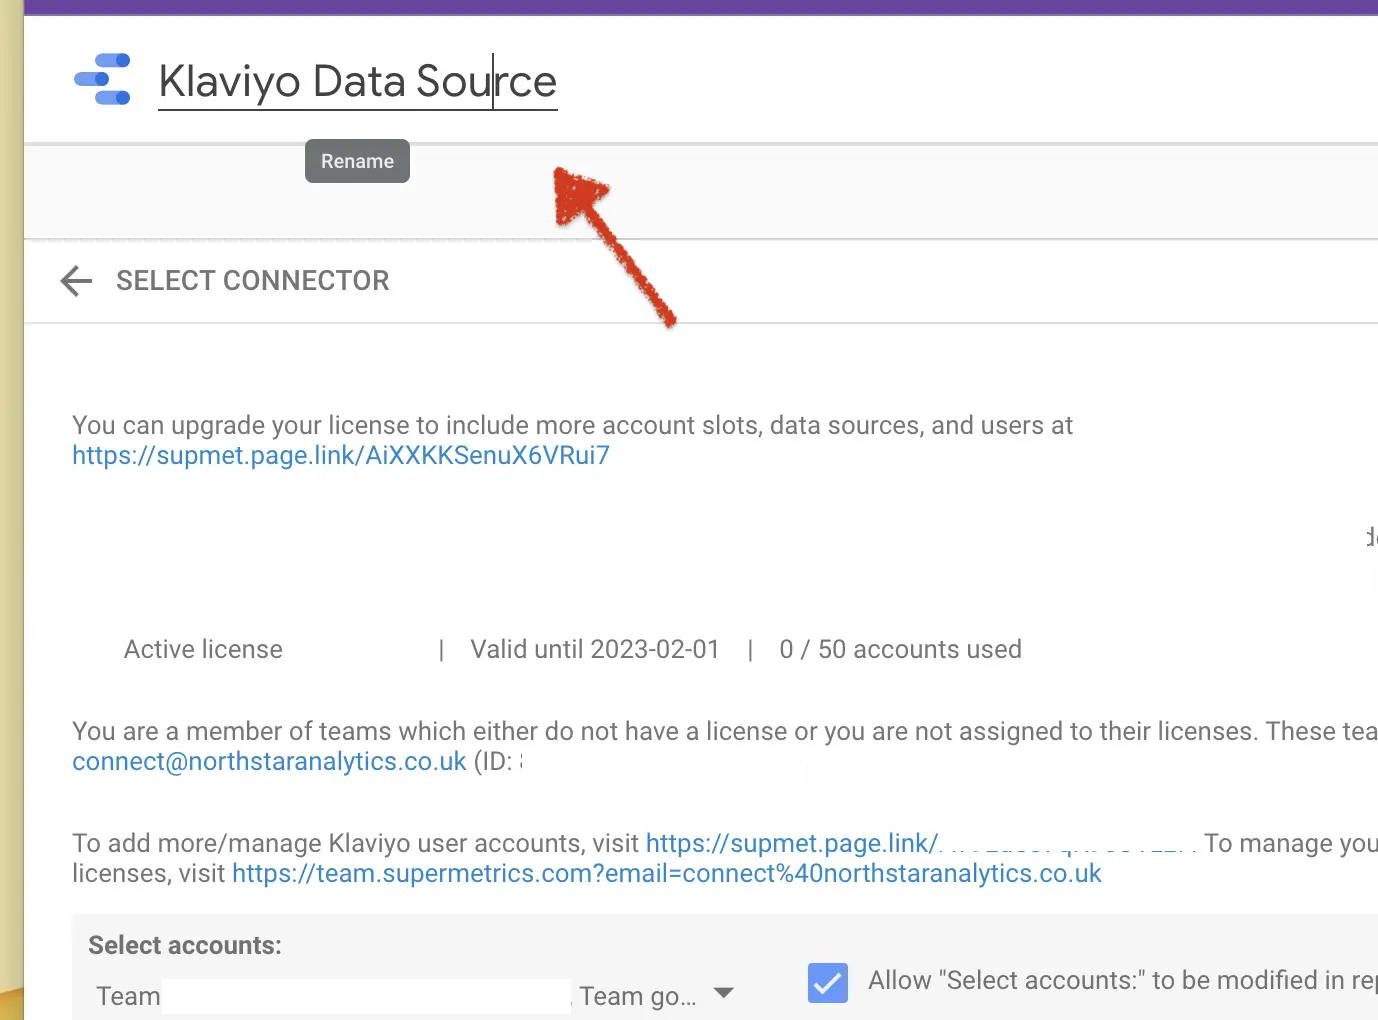
Name the source
Click the title (it should be Untitled Data Source) and change it by own taste. Then, please click the Google Sheets.
Step 2: Adding calculated metrics
Now we will add some custom metrics which Klaviyo doesn't give or need to be calculated when you view the dashboard. To start this process, please click the "Add a Field" plus icon.
You will find the instructions for Shopify, Woocomerce and Magento.

Custom Field Panel
Before proceeding, I'd like to explain the custom field panel:
- Field Name: The name of a new metric or dimension
- Formula: We can handle data in many different ways thanks to GDS functions.
- You need to click the blue button to add/update the field every time.

Custom Fields for Campaign Data
Let's add custom fields to not struggle when we copy the dashboard.
Please be sure to have the same field names in your data source. The fields are case sensitive.
$ per Recipient for Shopify → SUM(Shopify order value)/SUM(Emails received)
$ per Recipient for Woocommerce → SUM(Woocommerce order value)/SUM(Emails received)
$ per Recipient for Magento → SUM(Magento order value)/SUM(Emails received)
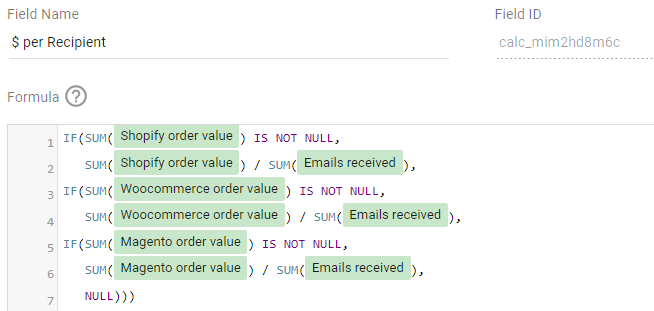
$ per Recipient ->
IF(SUM(Shopify order value) IS NOT NULL,
SUM(Shopify order value) / SUM(Emails received),
IF(SUM(Woocommerce order value) IS NOT NULL,
SUM(Woocommerce order value) / SUM(Emails received),
IF(SUM(Magento order value) IS NOT NULL,
SUM(Magento order value) / SUM(Emails received),
NULL)))
Basket Value for Shopify → SUM(Shopify order value)/SUM(Shopify orders)
Basket Value for Woocommerce → SUM(Woocommerce order value)/SUM(Woocommerce orders)
Basket Value for Magento → SUM(Magento order value)/SUM(Magento orders)
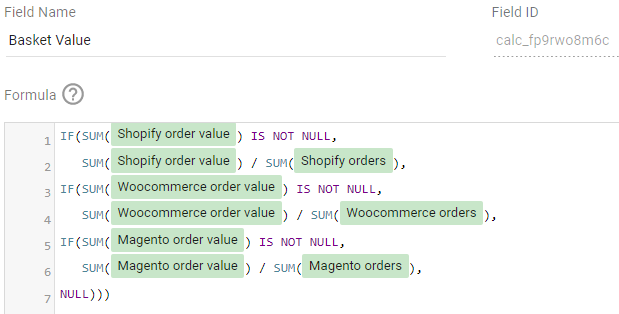
Basket Value →
IF(SUM(Shopify order value) IS NOT NULL,
SUM(Shopify order value) / SUM(Shopify orders),
IF(SUM(Woocommerce order value) IS NOT NULL,
SUM(Woocommerce order value) / SUM(Woocommerce orders),
IF(SUM(Magento order value) IS NOT NULL,
SUM(Magento order value) / SUM(Magento orders),
NULL)))
Click → Order % for Shopify → SUM(Shopify orders)/SUM(Emails clicked (unique))
Click → Order % for Woocommerce → SUM(Woocommerce orders)/SUM(Emails clicked (unique))
Click → Order % for Magento → SUM(Magento orders)/SUM(Emails clicked (unique))
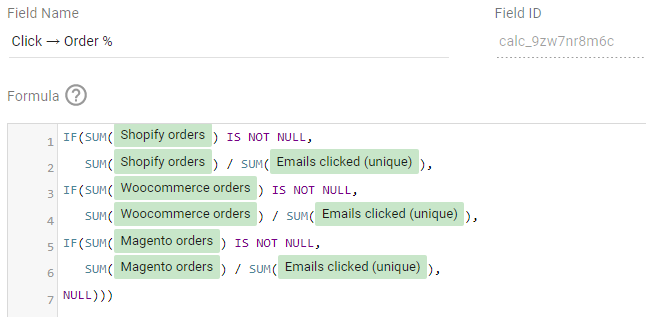
Click → Order % →
IF(SUM(Shopify orders) IS NOT NULL,
SUM(Shopify orders) / SUM(Emails clicked (unique)),
IF(SUM(Woocommerce orders) IS NOT NULL,
SUM(Woocommerce orders) / SUM(Emails clicked (unique)),
IF(SUM(Magento orders) IS NOT NULL,
SUM(Magento orders) / SUM(Emails clicked (unique)),
NULL)))
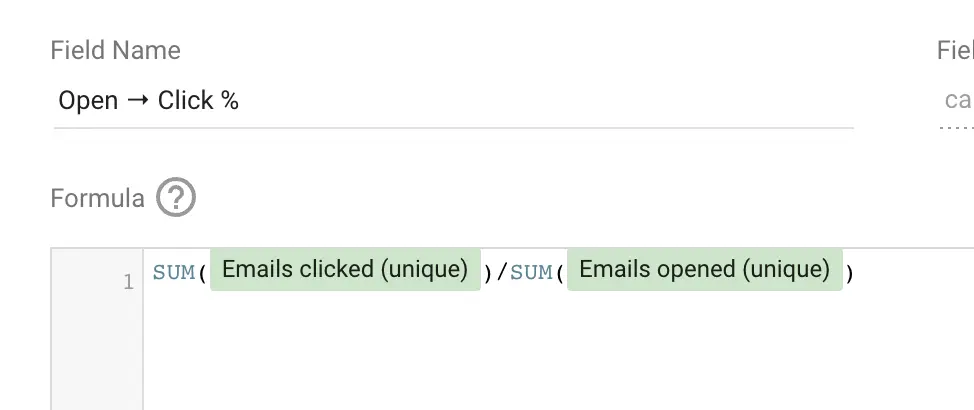
Open → Click % → SUM(Emails clicked (unique))/SUM(Emails opened (unique))
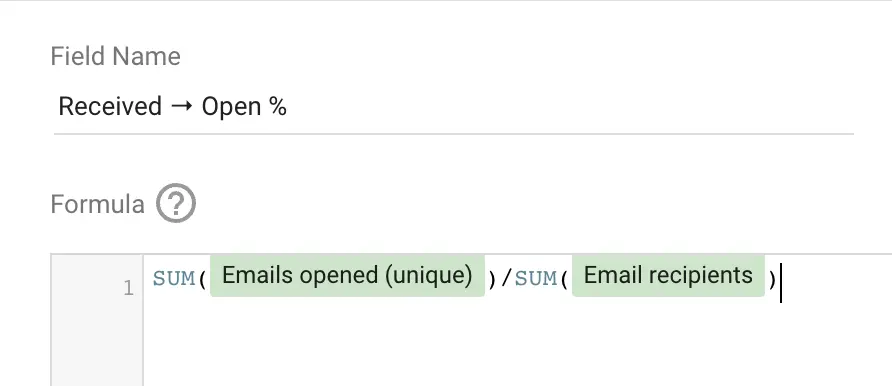
Received → Open % → SUM(Emails opened (unique))/SUM(Email recipients)
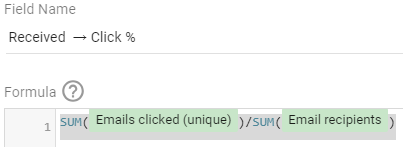
Received → Click % → SUM(Emails clicked (unique))/SUM(Email recipients)
The following part is for
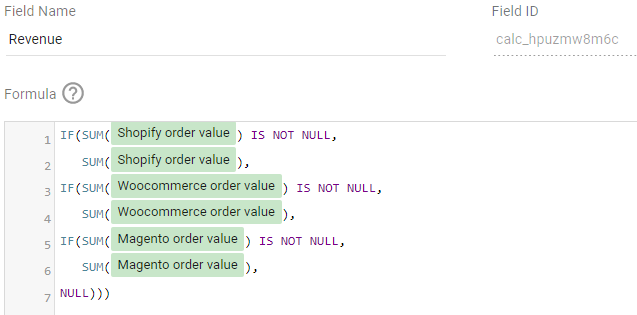
Revenue for Shopify → SUM(Shopify order value)
Revenue for Woocommerce → SUM(Woocommerce order value)
Revenue for Magento → SUM(Magento order value)
Revenue →
IF(SUM(Shopify order value) IS NOT NULL,
SUM(Shopify order value),
IF(SUM(Woocommerce order value) IS NOT NULL,
SUM(Woocommerce order value),
IF(SUM(Magento order value) IS NOT NULL,
SUM(Magento order value),
NULL)))
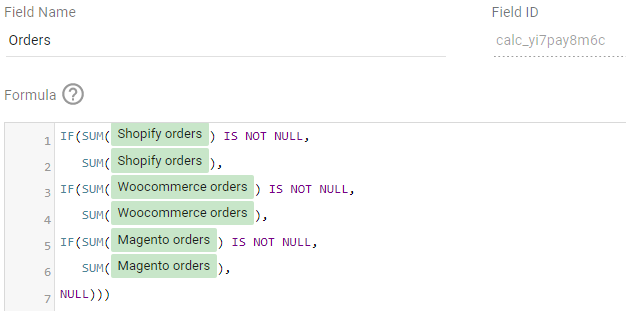
Orders for Shopify → SUM(Shopify orders)
Orders for Woocommerce → SUM(Woocommerce orders)
Orders for Magento → SUM(Magento orders)
Orders →
IF(SUM(Shopify orders) IS NOT NULL,
SUM(Shopify orders),
IF(SUM(Woocommerce orders) IS NOT NULL,
SUM(Woocommerce orders),
IF(SUM(Magento orders) IS NOT NULL,
SUM(Magento orders),
NULL)))
Adjust the format
Please change the metric format to below.

If your account has a different currency than $ then, you can click the dropdown on the right side of the metric and select the appropriate currency.

The data from Supermetrics is loading slowly, extracting the data will speed up your report.
How do create extract data?
You have learned how to create a data source. When you type 'extra' in the search bar of the data source, the 'extract data' option will appear as shown in the image below.
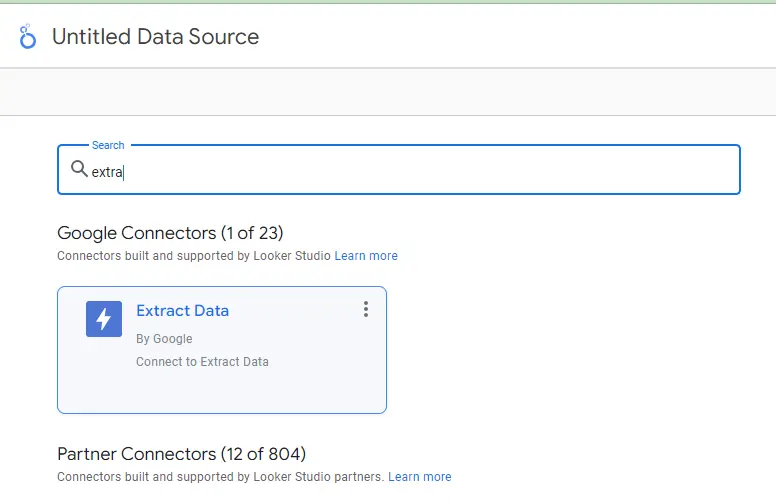
After clicking on it, a screen will appear where we can select the data source from which we extract the data, choose the specific data we want to extract, determine the frequency of data updates, and specify the date range for extracting the data.
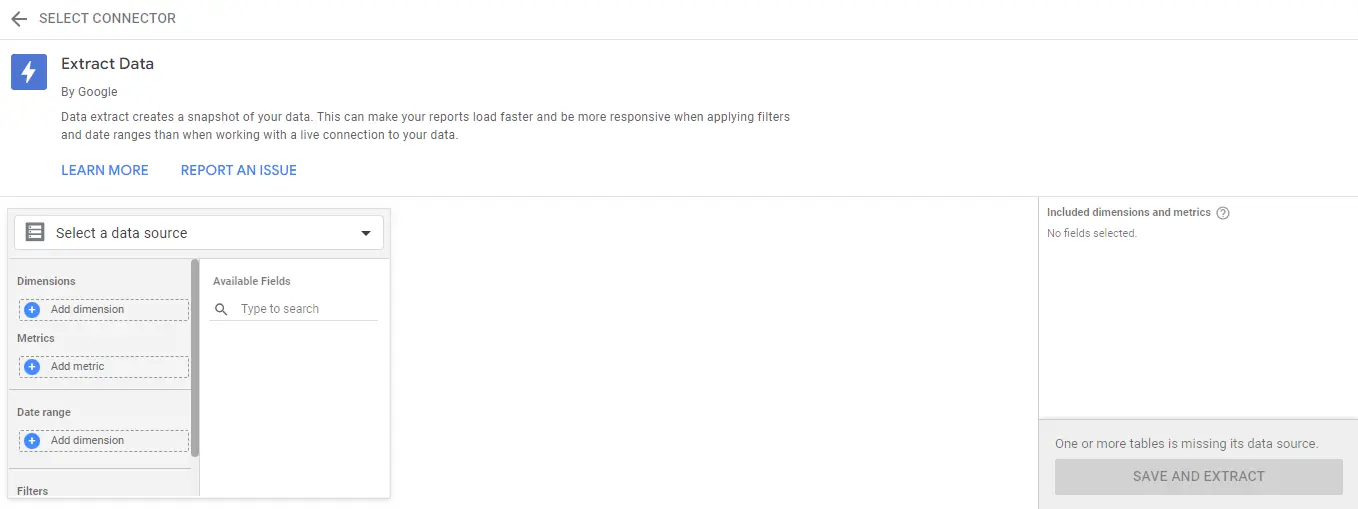
The data required for the report will be as in the image below.
I create two separate filtered data sources for Campaign and Flow when extracting data to ensure greater accuracy.
Extract Data - Campaign

The filter for Extract Data - Campaign

Extract Data - Flow

The filter for Extract Data - Flow

The date range where the data will be retrieved should be as in the image below.
Note: If it gives an error, you can start the data from the last 6 months, save and extract and edit it again after removing it without any errors, you can take the date back further, then it will not give an error.
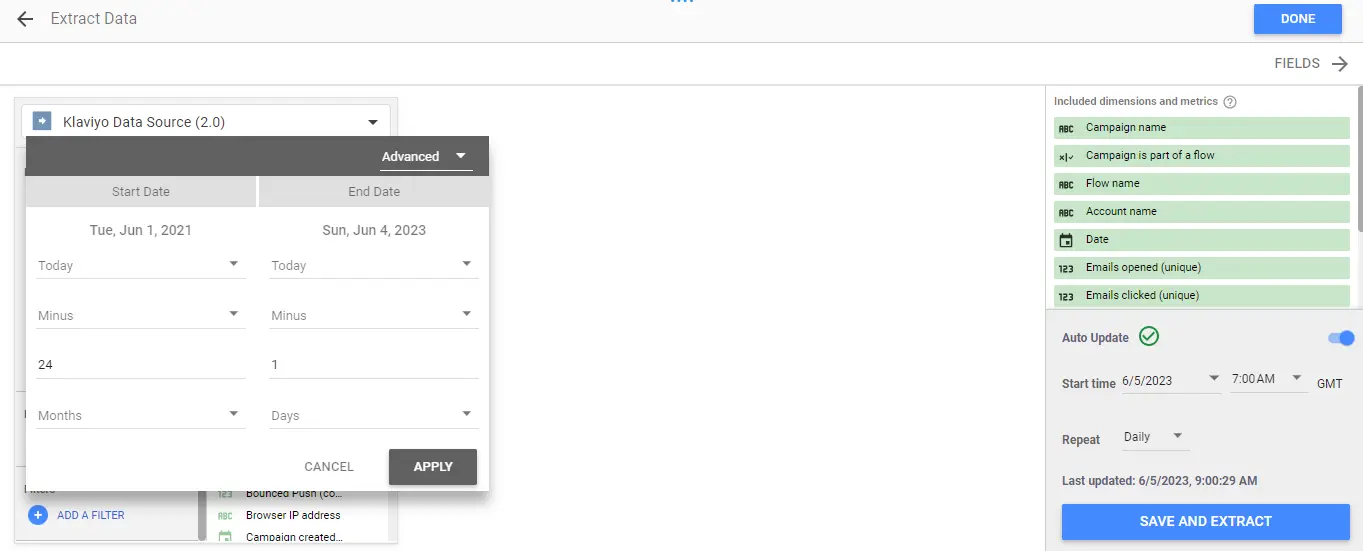
If you have made the auto update settings, you can now click save and extract.
After extracting the data without any problems, we create the calculated fields.

Note: If you want us to do this, we charge an additional fee.
Step 3: Copy the Dashboard
This is the most exciting part of the process. Please open the link to the dashboard you purchased. You should see errors on every widget. Don't be afraid of them. They are like that because of not showing another account's data to you.
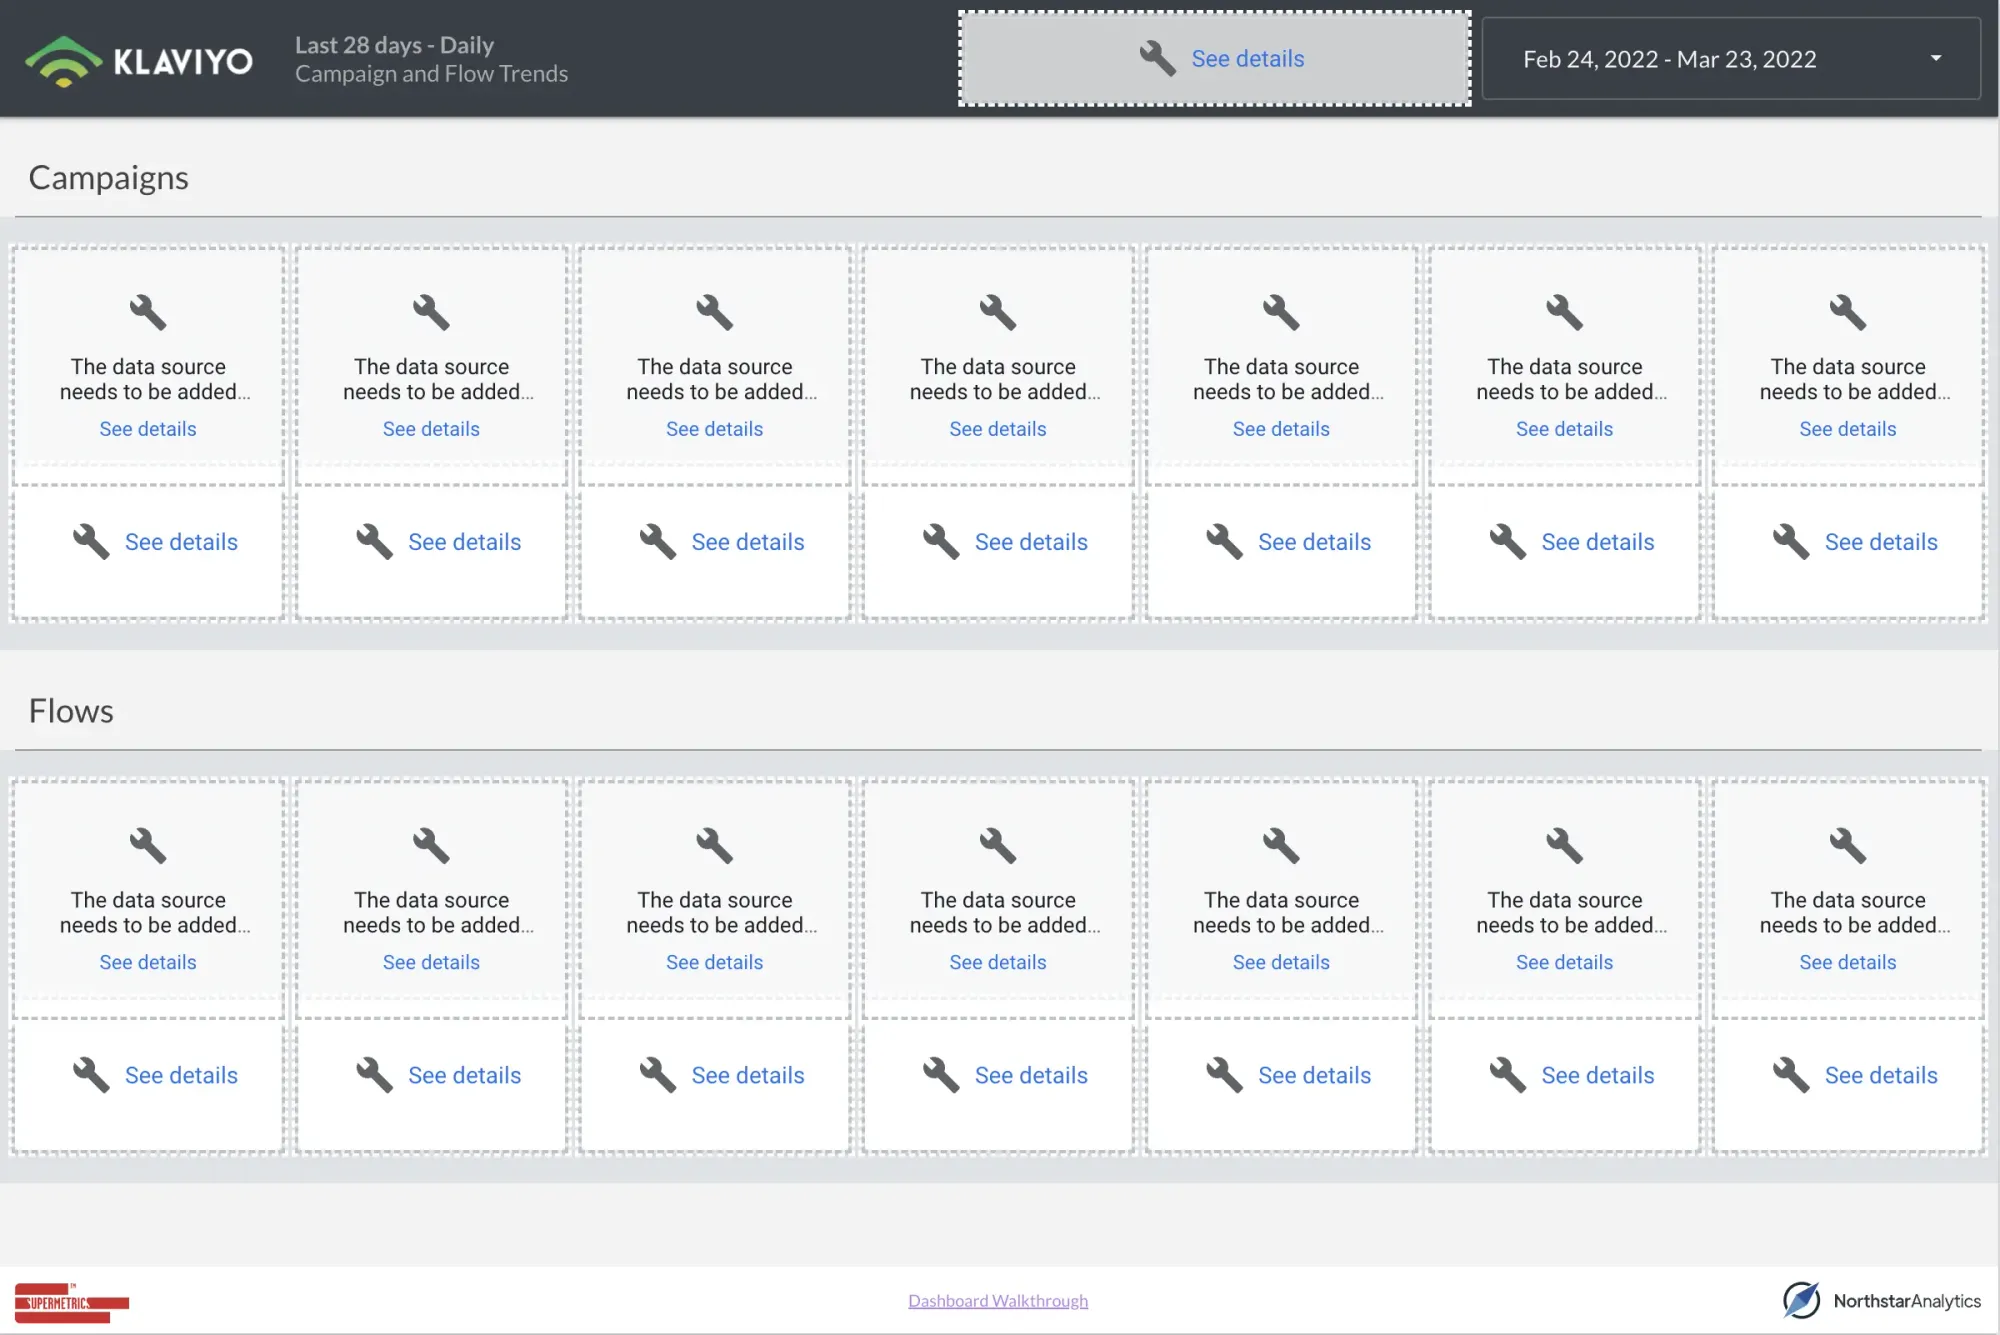
Click make a copy
You will find this option on the top right part of the dashboard. You may need to hover on the header for a few seconds to see these dots.

Select data sources
You'll see the unknown data source at first. Click there.
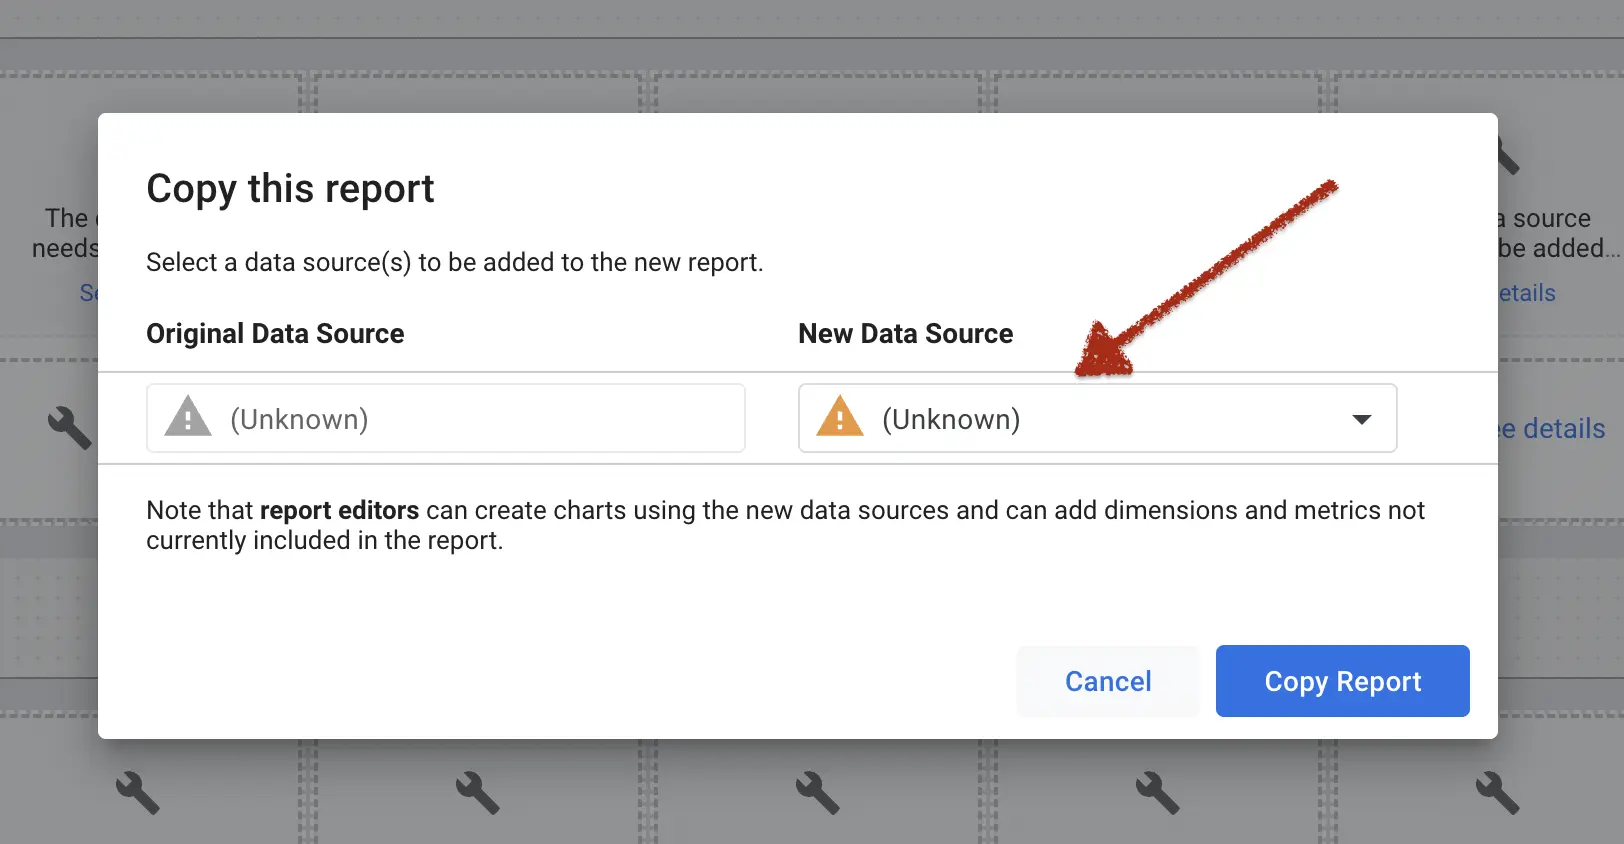
You have already prepared your data sources in the previous sections. So, please select these data sources by using the dropdown.
These data sources should be under the "Available data sources" part of the dropdown.
Copy the dashboard
Then, click the blue "Copy the report" button. If you did everything above, you should have your own dashboard right now.
Congratulations!

