Inventory Management System Spreadsheet Template
Inventory Management Excel Spreadsheet is an easy-to-use tool for businesses to manage their inventory. It helps to track product availability, keep track of stock levels, and create purchase orders.
With the help of this spreadsheet, businesses can stay organized and efficient. This guide will walk you through the steps of setting up and using the Inventory Management Excel Spreadsheet.
You can watch the YouTube video below if you don't want to read the whole page. Let's start.
Home Page
This is the main page of the inventory management system. It gives you a quick overview of the stock levels, incoming orders, and outbound shipments.
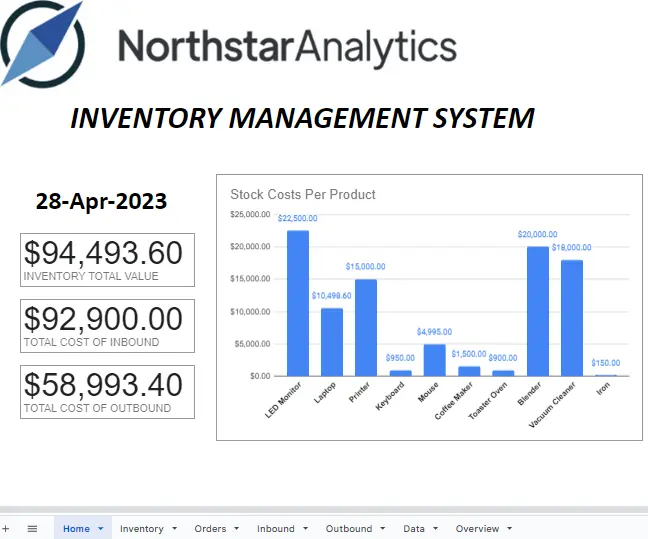
- To get today's date on this page, simply type =TODAY() in the formula bar on the left top side of the page. You can customize the appearance of the cell by merging cells and using formatting tools. To view the formula and formatting options, click on the cell.
- The "INVENTORY TOTAL VALUE" scorecard chart shows the sum of data from the "INVENTORY TOTAL VALUE" column in the table located on the Inventory page.
- The "TOTAL COST OF INBOUND" scorecard chart shows the sum of data from the "TOTAL COST OF INBOUND" column in the table located on the Inbound page.
- The "TOTAL COST OF OUTBOUND" scorecard chart shows the sum of data from the "TOTAL COST OF OUTBOUND" column in the table located on the Outbound page.
- The Combo chart displays the distribution of Stock Costs Per Product.
- In the context of "Stock Costs Per Product," the Combo chart would display the distribution of costs for different products, presenting the relationship between stock levels and corresponding costs. This visualization can help identify patterns, trends, and disparities in stock costs across various products, facilitating decision-making and strategic planning related to inventory management and financial analysis.
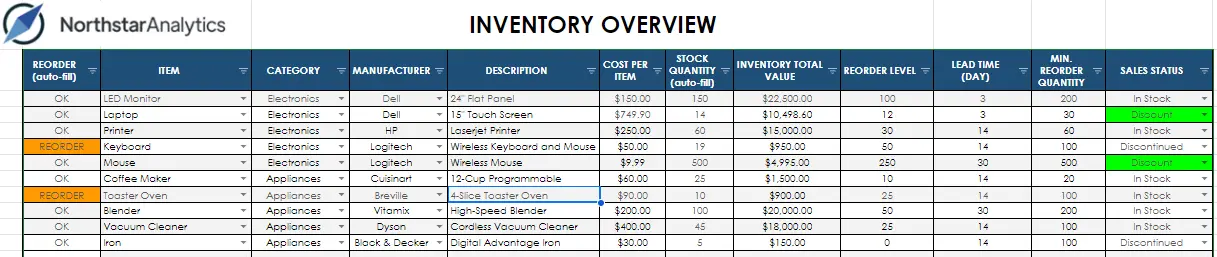
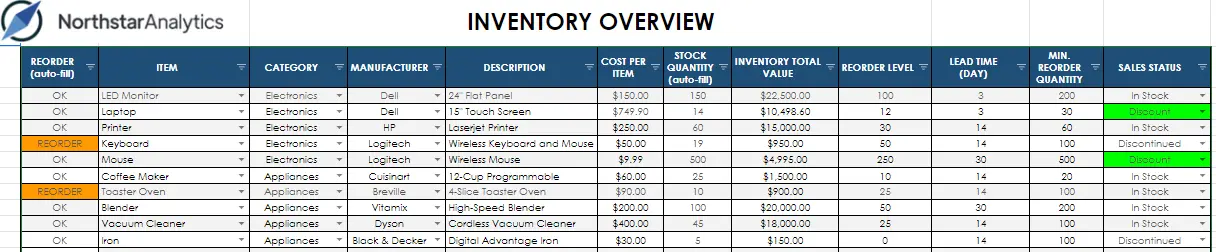
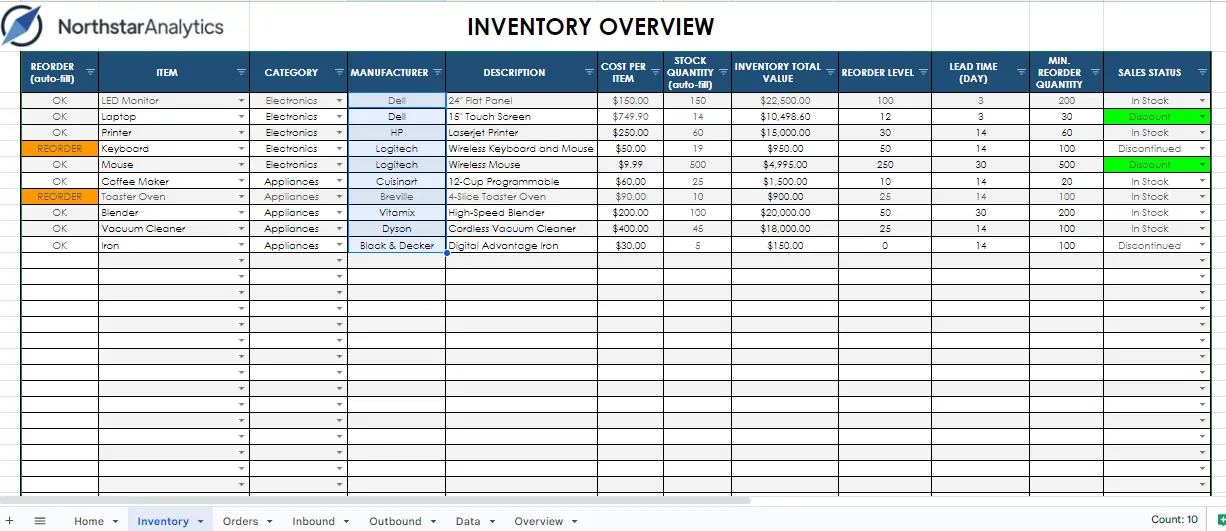
Inventory Page
This sheet shows the current inventory levels for each item in the warehouse. It also allows you to add new items and adjust the number of existing items.
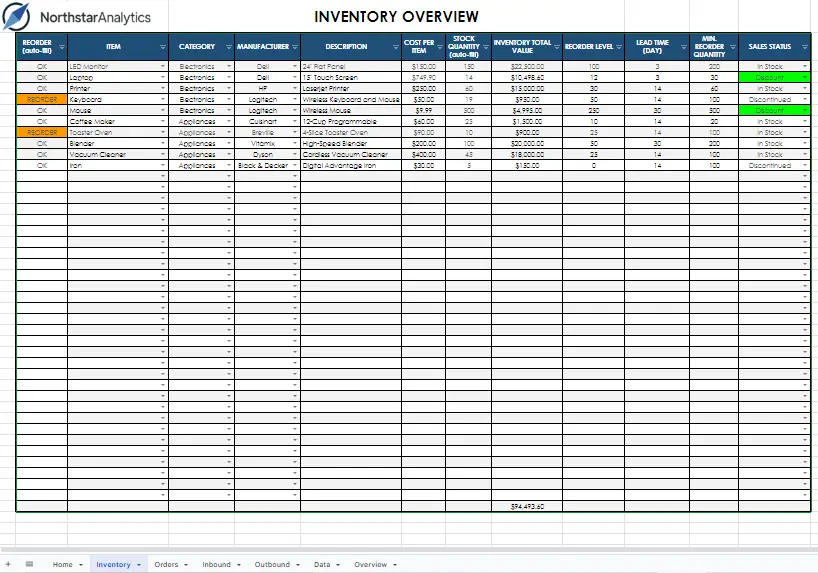
- REORDER (auto-fill): This column is automatically populated using the formula "=IFS(L4<J4, "OK", L4>J4, "REORDER"). The formula compares the value in column L (Reorder Level) with the value in column J (Stock Quantity) for each row. If the stock quantity is less than the reorder level, it displays "REORDER," indicating the need to replenish inventory. If the stock quantity is greater than or equal to the reorder level, it displays "OK," indicating that the inventory is sufficient.
- ITEM: The ITEM column represents the name of each inventory item. It helps identify and categorize different products or items within the inventory.
- CATEGORY: The CATEGORY column indicates the category or classification to which each inventory item belongs. It helps organize and group similar items together for easier management and analysis.
- MANUFACTURER: The MANUFACTURER column contains the name or details of the manufacturer or supplier of each inventory item. It helps track the source or origin of the item, which can be useful for quality control or reordering purposes.
- DESCRIPTION: This column provides a more detailed description or information about each inventory item. It may include specifications, characteristics, or any other relevant details that help in understanding the item better.
- COST PER ITEM: The COST PER ITEM column represents the unit cost or price of each inventory item. It indicates the amount paid for acquiring each unit of the item.
- STOCK QUANTITY (auto-fill): This column is automatically filled using the formula "=H3-I3". The formula subtracts the value in column I (Total Outbound comes from Quantity column of Outbound Page ) from the value in column H (Total Inbound comes from Quantity column of Inbound Page) for each row. It calculates the remaining stock quantity after deducting sold quantities from the total inventory quantity.
- INVENTORY TOTAL VALUE: This column is automatically populated using the formula "=J3*G3". The formula multiplies the value in column J (Stock Quantity) by the value in column G (Cost Per Item) for each row. It calculates the total value of the inventory for each item by multiplying the stock quantity with the cost per item.
- REORDER LEVEL: The REORDER LEVEL column specifies the minimum stock level at which a reorder should be triggered for each item. It helps maintain adequate inventory levels to avoid stockouts or disruptions in the supply chain.
- LEAD TIME (DAY): The LEAD TIME column represents the number of days required to fulfill an inventory reorders once it has been placed. It helps in planning and managing the timing of reorders to ensure a smooth supply chain process.
- MIN. REORDER QUANTITY: This column indicates the minimum quantity that should be reordered for each item. It helps determine the minimum quantity required to maintain optimal inventory levels and reduce the risk of stockouts.
- SALES STATUS: The SALES STATUS column provides information about the status of sales for each item. It helps track whether an item is available for sale or if it has been sold, providing insights into the current availability and sales performance.
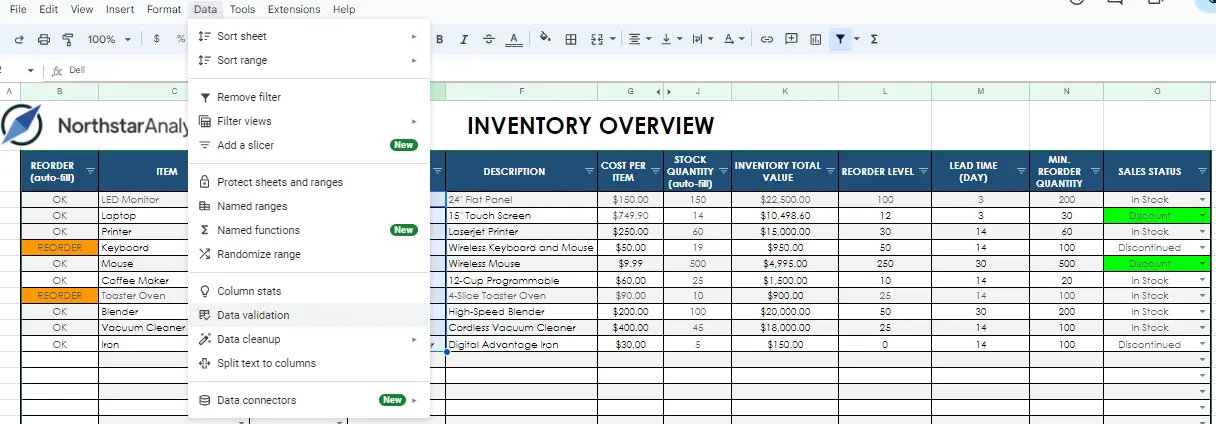
Colored cells have conditional formatting, which makes it easy for you to focus on the data.
After hovering over the colored column and right-clicking, a list will appear. When you hover over the 'view more cell actions' option in that list, you can access a submenu where you can select 'conditional formatting'.
Alternatively, you can click on the Conditional Formatting option from the Format tab.
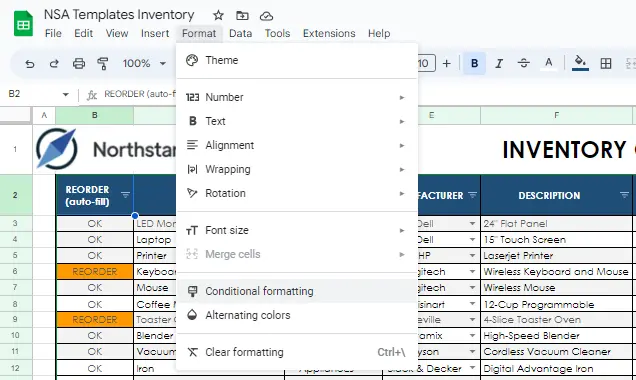
By clicking on this option, you can make necessary adjustments (Add rule, edit rule, delete rule) or explore the features of conditional formatting.
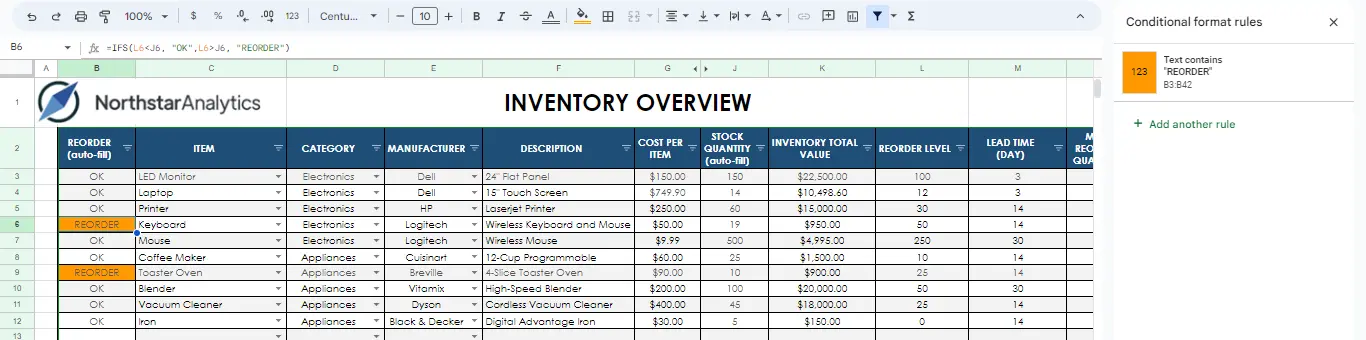
For the "REORDER (auto-fill)" column values, It appears that there is a conditional formatting rule that sets the background color of a cell to orange if the value in column B, is a text containing "REORDER".
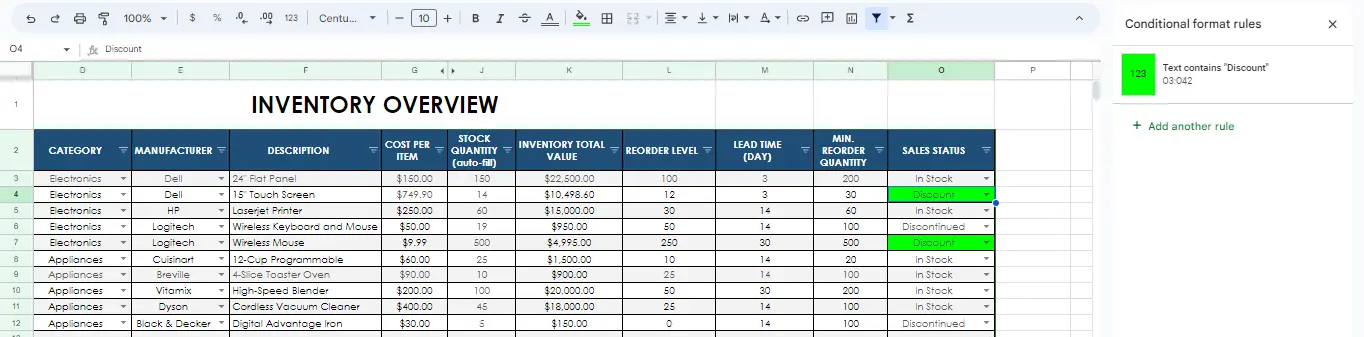
For the "SALES STATUS" column values, It appears that there is a conditional formatting rule that sets the background color of a cell to orange if the value in column O, is a text containing "Discount".
Orders Page
This sheet shows all the orders that have been placed with the warehouse. It allows you to track the status of each order and also add new orders.
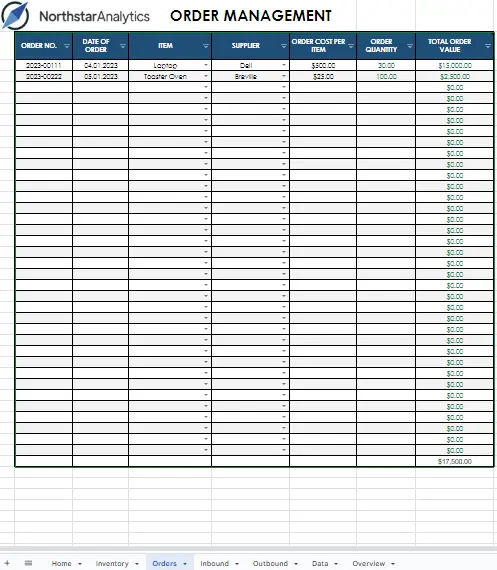
- ORDER NO.: The ORDER NO. The column represents the unique identification number assigned to each order placed. It helps track and differentiate between different orders in the inventory management system.
- DATE OF ORDER: The DATE OF ORDER column records the date on which each order was placed. It provides important information regarding the timing and sequence of orders.
- ITEM: The ITEM column contains the names of the items that were ordered. It helps identify the specific products or materials included in each order.
- SUPPLIER: The SUPPLIER column specifies the name of the supplier from whom the order was placed. It helps track and manage the relationships with different suppliers.
- ORDER COST PER ITEM: The ORDER COST PER ITEM column represents the cost per item for each order. It indicates the price at which the items were purchased from the supplier.
- ORDER QUANTITY: The ORDER QUANTITY column specifies the quantity of each item that was ordered. It represents the number of units or items included in the order.
- TOTAL ORDER VALUE: The TOTAL ORDER VALUE column calculates the total value of each order by multiplying the order quantity with the order cost per item. It provides the overall cost or value of the order.
Inbound Page
This sheet shows all the items that have been received from suppliers. It also allows you to add new items and adjust the number of existing items.
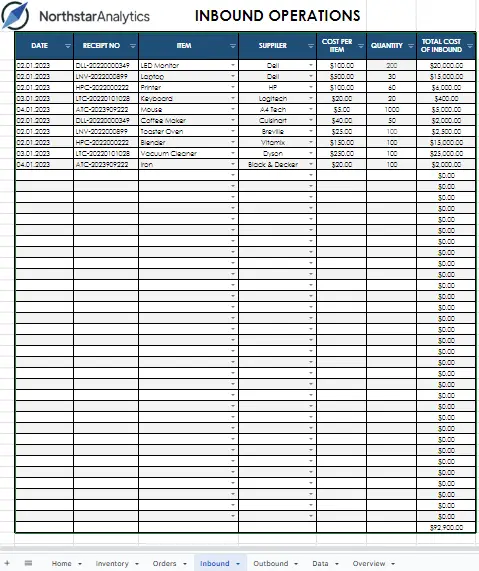
- DATE: The DATE column represents the date on which an inbound transaction or receipt occurred. It helps track the timeline of incoming inventory items and provides a reference for historical analysis.
- RECEIPT NO: The RECEIPT NO column contains the unique identification numbers assigned to each inbound receipt or transaction. It helps in identifying and referencing specific transactions within the system.
- ITEM: The ITEM column specifies the name or identification of each inbound item. It helps identify and distinguish different items received into the inventory.
- SUPPLIER: The SUPPLIER column provides information about the supplier or vendor from whom the items were purchased or received. It helps track and manage the relationships with various suppliers.
- COST PER ITEM: The COST PER ITEM column represents the unit cost or price of each inbound item. It indicates the cost incurred for each individual item received.
- QUANTITY: The QUANTITY column denotes the number or quantity of each inbound item received. It helps track the number of items added to the inventory.
- TOTAL COST OF INBOUND: The TOTAL COST OF INBOUND column calculates the total cost of each inbound transaction by multiplying the cost per item with the quantity received. It provides the overall cost incurred for each receipt or transaction.
Outbound Page
This sheet shows all the items that have been shipped out of the warehouse. It allows you to track the status of each shipment and also add new shipments.
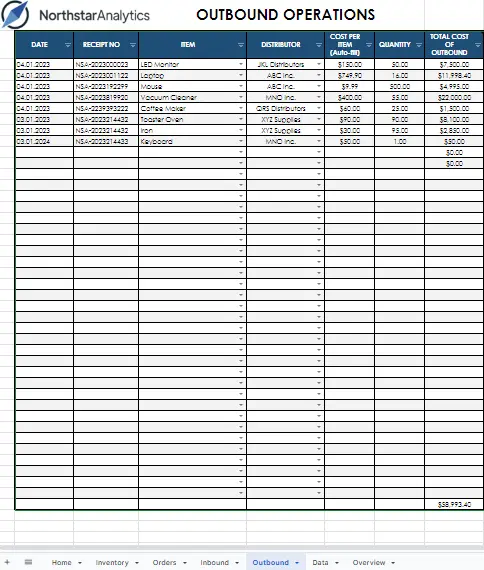
- DATE: The DATE column represents the date when the outbound transaction occurred. It helps track the timing of each transaction, providing a chronological order for reference and analysis.
- RECEIPT NO: The RECEIPT NO column contains the unique identification numbers or codes associated with each outbound transaction. It helps uniquely identify and reference specific transactions for record-keeping and tracking purposes.
- ITEM: The ITEM column lists the names or identification numbers of the items being sent out or distributed. It helps identify the specific products or goods involved in the outbound transactions.
- DISTRIBUTOR: This column provides information about the distributor or recipient of the outbound items. It helps track and manage the parties involved in the distribution process, such as customers, suppliers, or internal departments.
- COST PER ITEM: The COST PER ITEM column represents the unit cost of each item being sent out. It indicates the cost associated with each individual item in the outbound transaction.
- QUANTITY: The QUANTITY column specifies the quantity or number of items being sent out in each outbound transaction. It helps track the volume or amount of goods involved in the distribution process.
- TOTAL COST OF OUTBOUND: The TOTAL COST OF OUTBOUND column calculates the total cost of the outbound transaction for each item, taking into account the cost per item and the quantity sent out. It provides the overall cost associated with the distribution of goods.
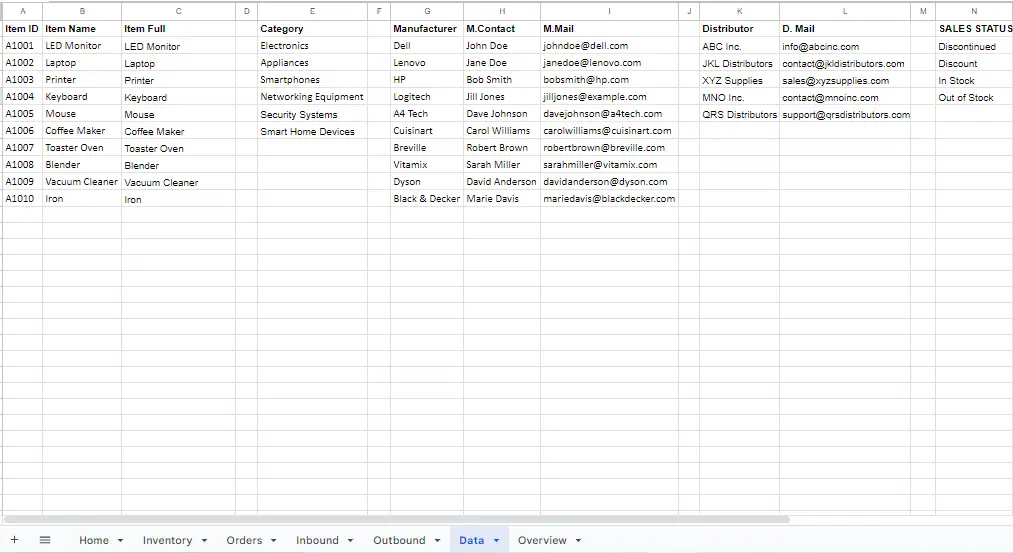
Data Page
This sheet contains all the data related to the inventory management system. It allows you to add, view, edit, and delete data as needed.

- Item ID: The Item ID column represents the unique identification number assigned to each item in the inventory. It helps in identifying and differentiating items within the inventory management system.
- Item Name: The Item Name column contains the name or title of each item in the inventory. It provides a descriptive label for easy identification and reference.
- Item Full: The Item Full column represents the full description or details of each item, including specifications, features, or any other relevant information that provides a comprehensive understanding of the item.
- Category: The Category column specifies the category or classification of each item. It helps group similar items together for better organization and analysis.
- Manufacturer: The Manufacturer column contains information about the company or entity that produces or manufactures the item. It helps identify the source or origin of the item.
- M.Contact: The M.Contact column represents the contact name of the manufacturer.
- M.Mail: The M.Mail column contains the email address of the manufacturer. It provides a convenient means of contacting the manufacturer via email.
- Distributor: The Distributor column specifies the company or entity responsible for distributing or supplying the item. It helps track the distribution channels and partners associated with each item.
- D.Mail: The D.Mail column represents the email address of the distributor. It allows for easy communication with the distributor, if necessary.
- SALES STATUS: The SALES STATUS column tracks the sales status of each item. It helps monitor whether an item is actively being sold, out of stock, discontinued, or has any other sales-related status.
How to create dropdown cells?
Let's assume that you want to add your customer data to the customer table and make it selectable in the customer name column.
Create the Manufacturer header and paste your manufacturer data.
Note: If the data includes formatting, you can select "paste values only " from the paste options.
Navigate to the table you want to connect your data to and select the cells you want to connect.
Choose data validation from the data tab.
Select "add a rule" from the window that pops up.
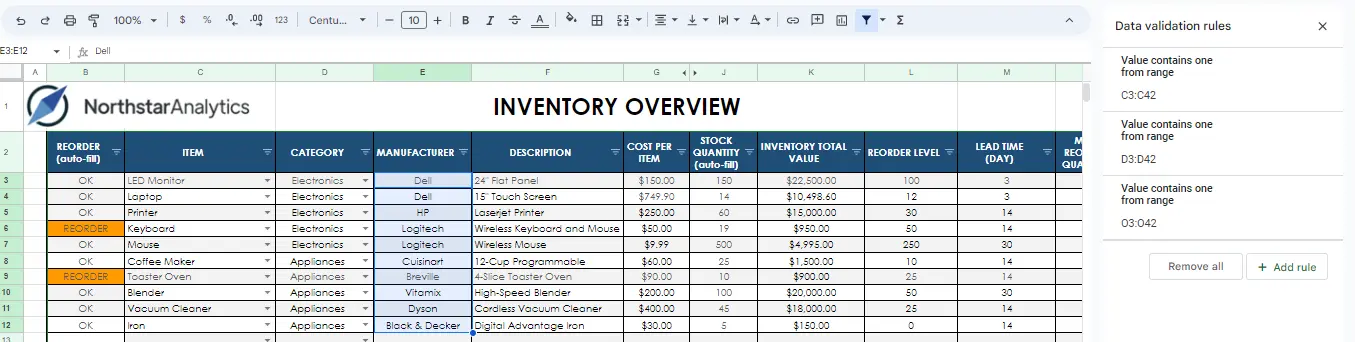
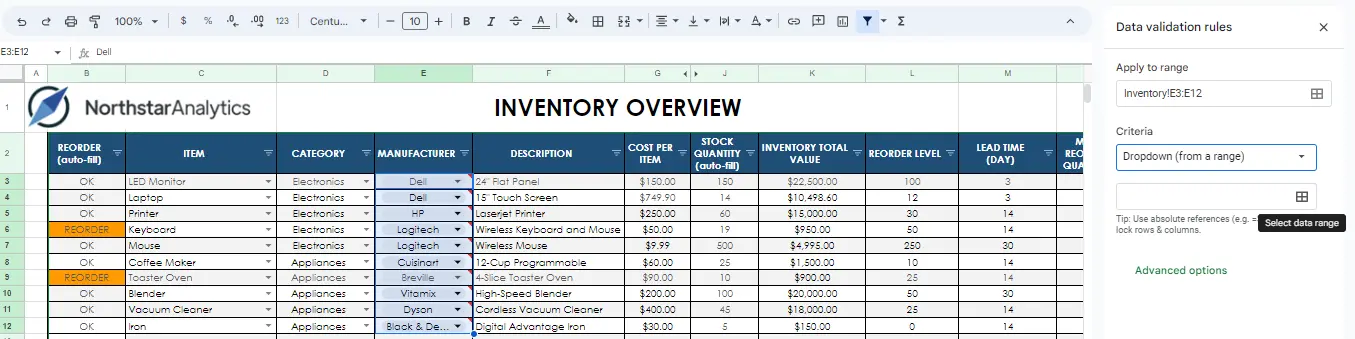
The applied field automatically appears as the field we selected. Under "criteria", select "from a range" from the dropdown menu. Hover over the box and click "Select data range".
Go to the data page and select your source data.
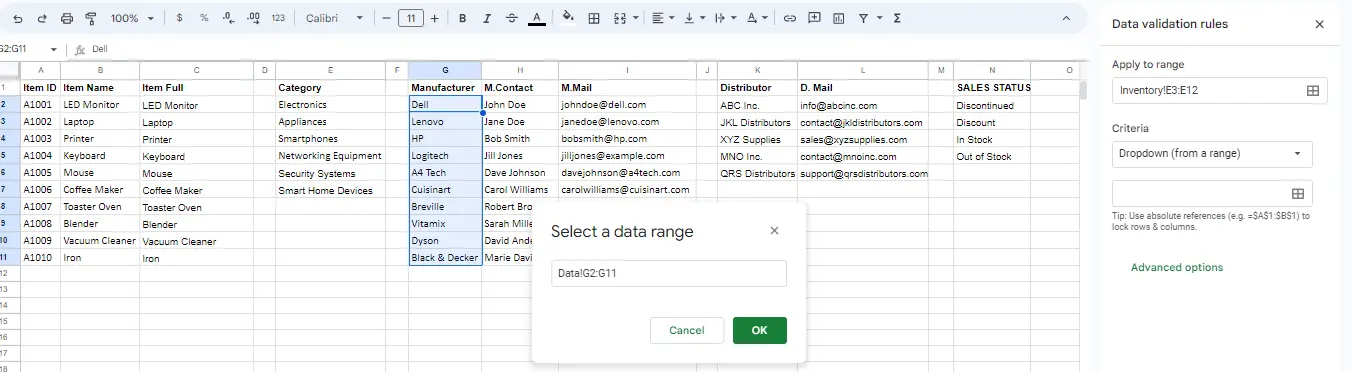
The window that pops up will be automatically filled based on the cells you selected. Then click OK.
Advanced options allow you to make adjustments. I chose to display it as an arrow in the Display Style because I wanted it to look like the others.
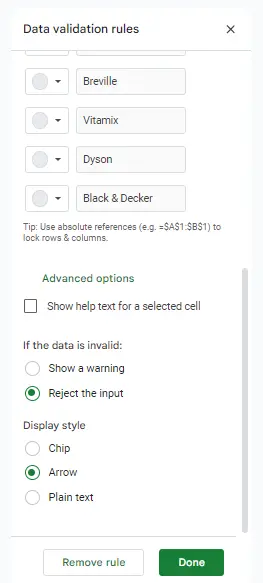
After making the necessary adjustments, click Done. It's ready now.