Sales Management System Spreadsheet Template
The Sales Management Excel Spreadsheet is a powerful tool for businesses to track and manage their sales. It helps to analyze customer behavior, forecast sales, and optimize marketing campaigns.
With the help of this spreadsheet, businesses can stay organized and efficient. This guide will walk you through the steps of setting up and using the Sales Management Excel Spreadsheet.
You can watch the YouTube video below if you don't want to read the whole page. Let's start.
Home Sheet
This page provides a dashboard overview of the sales management Excel file. It displays graphs and charts representing sales performance, goals, and customer data.
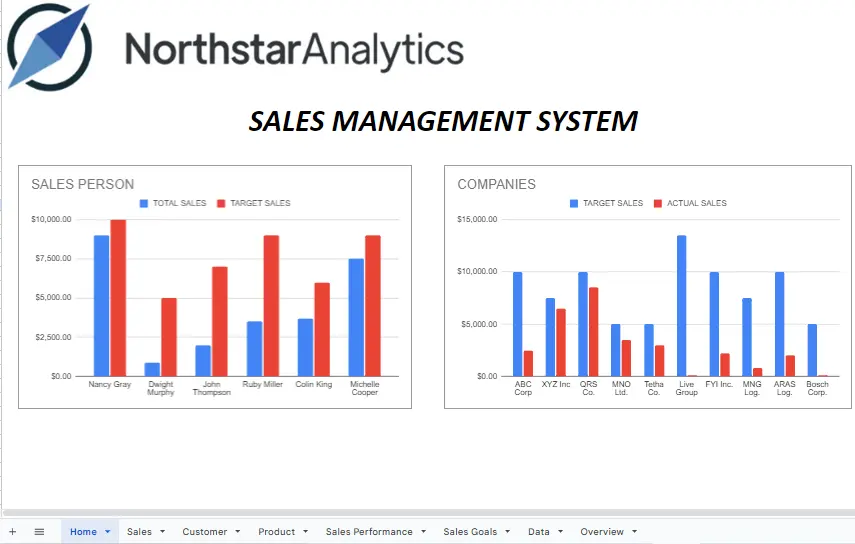
The column chart titled "SALES PERSON" displays the distribution of TOTAL SALES and TARGET SALES based on SALES REPRESENT. SALES REPRESENT is derived from the Sales sheet, while TOTAL SALES and TARGET SALES are sourced from the Sales Performance sheet.
The column chart titled "COMPANIES" displays the distribution of TARGET SALES and ACTUAL SALES based on COMPANY. The data for COMPANY, TARGET SALES (ESTIMATED SALE CAPACITY), and ACTUAL SALES is derived from the Customer sheet.
Sales Sheet
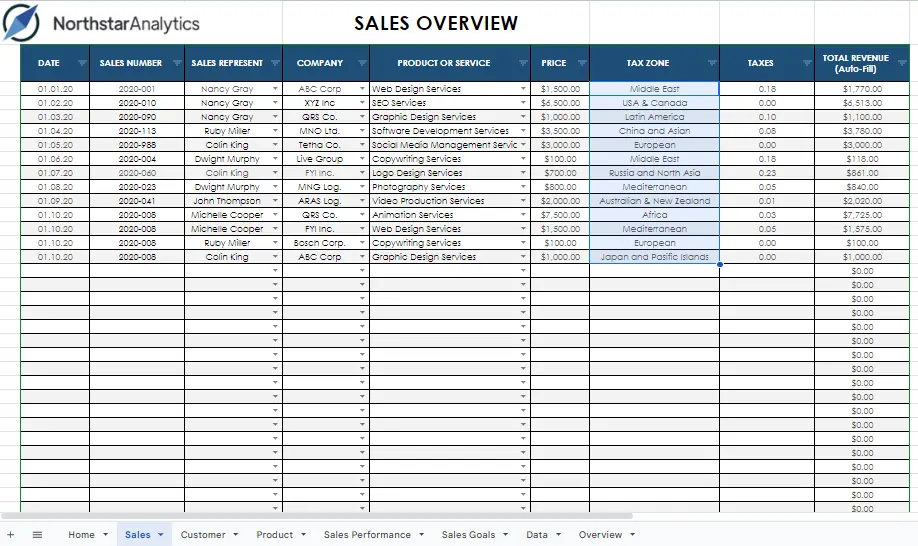
This page displays the sales data for each customer. It includes information such as customer name, total sales, and average sales.
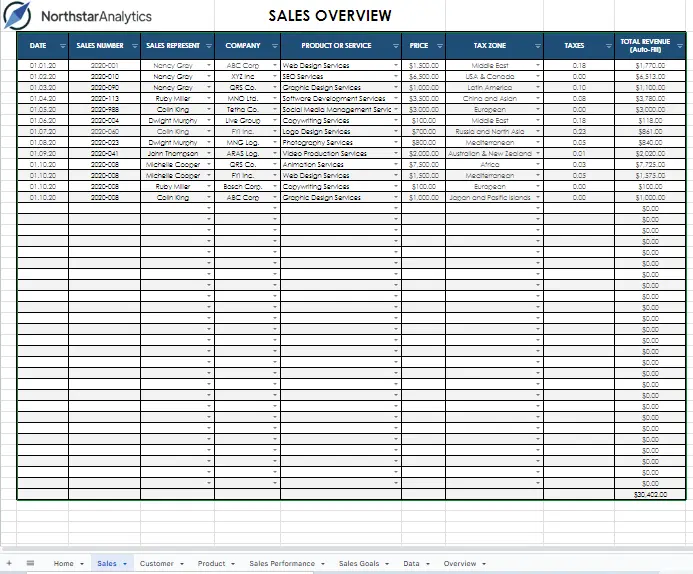
- DATE: The DATE column represents the date when the sales transaction took place. It helps track the timing and chronological order of sales activities.
- SALES NUMBER: This column contains a unique identification number for each sales transaction. It allows for easy reference and tracking of individual sales records.
- SALES REPRESENT: The SALES REPRESENT column indicates the name or identifier of the sales representative who handled the transaction. It helps attribute sales activities to specific individuals.
- COMPANY: This column contains the name of the company with whom the sales transaction was conducted. It helps identify the business or organization associated with each sale.
- PRODUCT OR SERVICE: The PRODUCT OR SERVICE column specifies the name or description of the product or service sold. It provides details about the specific item or service involved in the sales transaction.
- PRICE: The PRICE column is automatically filled using the formula "=VLOOKUP(F3, Product!$B$3:$F$12, 4, FALSE)". This formula retrieves the price of the product or service from the "Product" sheet based on the value in cell F3. It ensures that the prices are automatically populated for each sales record.
- TAX ZONE: This column indicates the tax zone or region associated with the sales transaction. It helps determine the applicable tax rates or regulations for the sale.
- TAXES: The TAXES column is automatically filled using the formula "=VLOOKUP(H3, Data!$G$2:$H$11, 2, FALSE)". This formula retrieves the tax rate from the "Data" sheet based on the value in cell H3. It automatically calculates the taxes based on the specified tax zone.
- TOTAL REVENUE (Auto-Fill): The TOTAL REVENUE column is automatically filled using the formula "=G3+(G3*I3)". This formula calculates the total revenue for each sales record by multiplying the price (column G) with the tax rate (column I) and adding it to the price. It ensures that the total revenue is calculated and populated automatically for each sales transaction.
Customer Sheet
This page displays the customer information for each customer. It includes the customer's name, address, phone number, and email address.
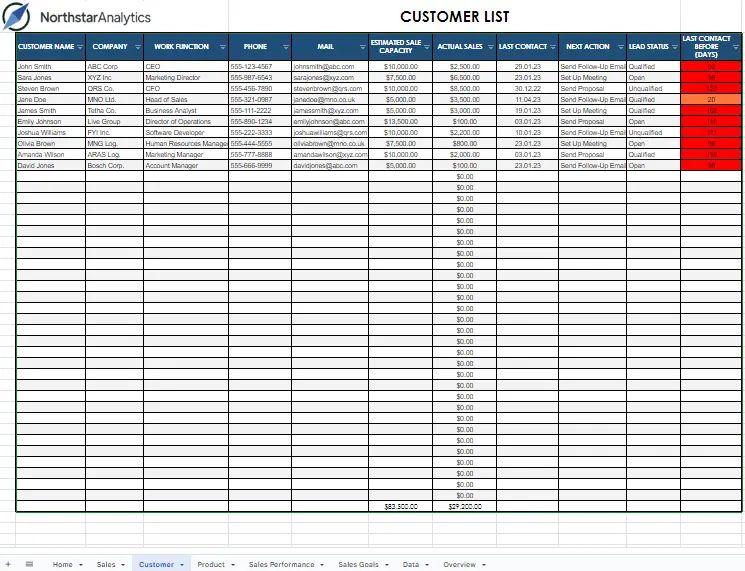
- CUSTOMER NAME: This column represents the names of your customers or clients. It allows you to identify and keep track of individual customers within your sales management system.
- COMPANY: The COMPANY column contains the names of the companies associated with each customer. It helps in organizing and managing customer data based on the companies they represent.
- PHONE: This column is used to store the contact phone numbers of your customers. It provides a convenient way to access and communicate with your customers when needed.
- MAIL: The MAIL column stores the email addresses of your customers. It enables you to reach out to them electronically, send important updates, or maintain a record of communication.
- ESTIMATED SALE CAPACITY: This column represents the estimated sales capacity or potential of each customer. It provides insight into the expected business volume or revenue that can be generated from each customer.
- ACTUAL SALES: The ACTUAL SALES column records the actual sales made to each customer. It helps in tracking the real-time sales figures and comparing them against the estimated sales capacity.
- LAST CONTACT: This column indicates the date of the most recent contact or interaction with each customer. It allows you to keep track of when you last communicated with a customer and maintain a regular follow-up schedule.
- NEXT ACTION: The NEXT ACTION column specifies the next step or action to be taken with each customer. It serves as a reminder and helps you plan and prioritize your interactions or follow-ups accordingly.
- LEAD STATUS: This column represents the status of each customer as a lead, prospect, or qualified opportunity within your sales management system. It helps in tracking the progress of customer relationships and identifying potential sales opportunities.
- LAST CONTACT BEFORE (DAYS): This column is automatically calculated using the formula "=TODAY()-I3". It calculates the number of days that have passed since the last contact with each customer. It provides a time reference for monitoring customer engagement and ensuring regular communication.
Colored cells have conditional formatting, which makes it easy for you to focus on the data.

After hovering over the colored column and right-clicking, a list will appear. When you hover over the 'view more cell actions' option in that list, you can access a submenu where you can select 'conditional formatting'.
Alternatively, you can click on the Conditional Formatting option from the Format tab.

By clicking on this option, you can make necessary adjustments (Add rule, edit rule, delete rule) or explore the features of conditional formatting
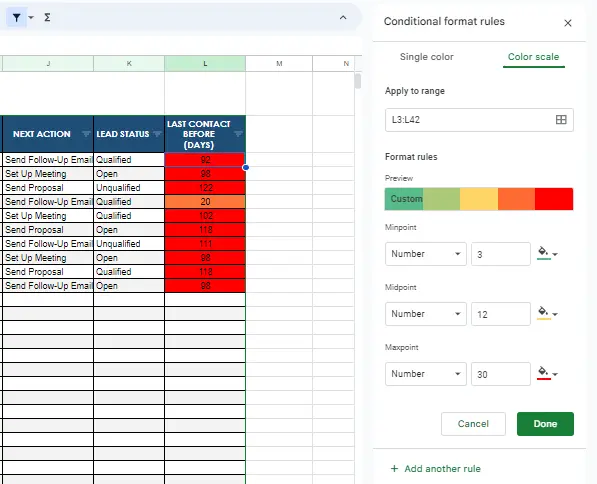
A conditional formatting rule has been applied to the column titled 'LAST CONTACT BEFORE (DAYS)', which utilizes a color scale with shades of green up to 3, shades of yellow up to 12, and shades of red for 30 days and beyond.
Product Sheet
This page displays the products available for sale. It includes product name, price, and description.
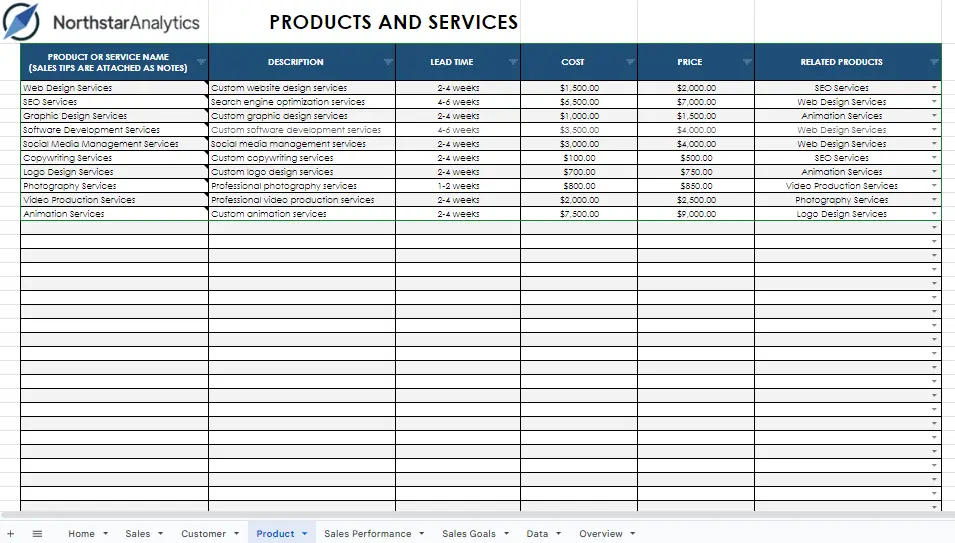
- PRODUCT OR SERVICE NAME: This column is used to list the names of your products or services. It helps identify and distinguish each item you offer in your sales management system.
- DESCRIPTION: The DESCRIPTION column provides a brief description or details about each product or service. It helps provide additional information to sales representatives or potential customers, allowing them to understand the features or benefits of the offering.
- LEAD TIME: The LEAD TIME column represents the time it takes from the initiation of an order until the delivery or fulfillment of the product or service. It helps estimate the time required for processing and delivering customer orders.
- COST: The COST column denotes the cost associated with producing or acquiring each product or service. It helps calculate the expenses incurred for manufacturing, purchasing, or providing the item.
- PRICE: The PRICE column indicates the selling price or the amount charged to customers for each product or service. It helps determine the revenue generated from sales transactions.
- RELATED PRODUCTS: The RELATED PRODUCTS column provides information about any related or complementary products or services that are associated with each item. It helps suggest additional offerings that may be of interest to customers, encouraging cross-selling or upselling.
Sales Performance Sheet
This page displays the sales performance data for each customer. It includes information such as total sales, average sales, and total sales goals.
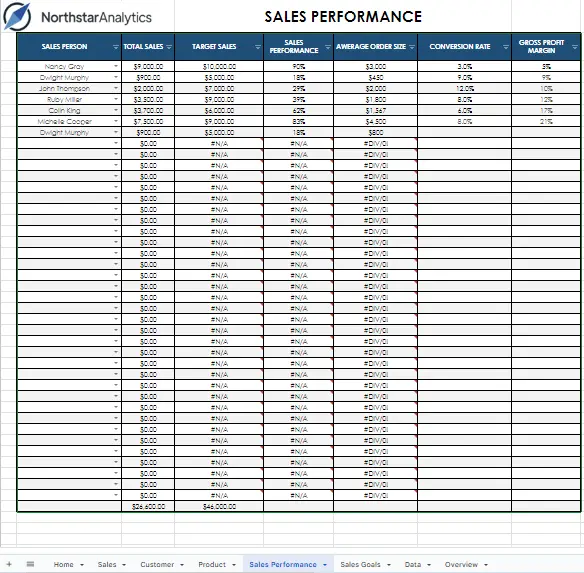
- SALES PERSON: This column represents the names or identifiers of the salespersons. Each row corresponds to a different salesperson in your sales team.
- TOTAL SALES: The TOTAL SALES column is automatically populated using the formula "=SUMIF(Sales!$D$3:$G$12,B3, Sales!$G$3:$G$12)". It calculates the total sales generated by each salesperson. The formula sums the values from the Sales sheet in the range D3:G12, based on the criteria specified in cell B3, and retrieves the corresponding sales amounts from column G.
- TARGET SALES: The TARGET SALES column is automatically filled using the formula "=VLOOKUP(B3, 'Sales Goals'!$B$3:$C$8, 2, FALSE)". It retrieves the target sales value for each salesperson from the Sales Goals sheet. The formula uses the VLOOKUP function to search for the value in cell B3 in the Sales Goals sheet's range B3:C8, and returns the corresponding value from the second column (column C).
- AVERAGE ORDER SIZE: The AVERAGE ORDER SIZE column is populated automatically using the formula "=AVERAGEIF(Sales!D3:G15,B3,Sales!G3:G15)". It calculates the average order size for each salesperson. The formula uses the AVERAGEIF function to calculate the average of the values in the Sales sheet's column G (order size), based on the criteria specified in cell B3 (salesperson's name) in column D.
- CONVERSION RATE: The CONVERSION RATE column represents the conversion rate achieved by each salesperson. It indicates the percentage of leads or prospects successfully converted into sales. The calculation for this column may vary based on your specific requirements or methodology.
- GROSS PROFIT MARGIN: The GROSS PROFIT MARGIN column indicates the gross profit margin associated with the sales generated by each salesperson. The calculation for this column typically involves subtracting the cost of goods sold (COGS) from the sales revenue, divided by the sales revenue, and multiplying by 100 to express it as a percentage. However, the specific formula for this column is not provided in your request.
Sales Goals Sheet
This page displays the sales goals for each customer. It includes the monthly sales goals and the total sales goals.
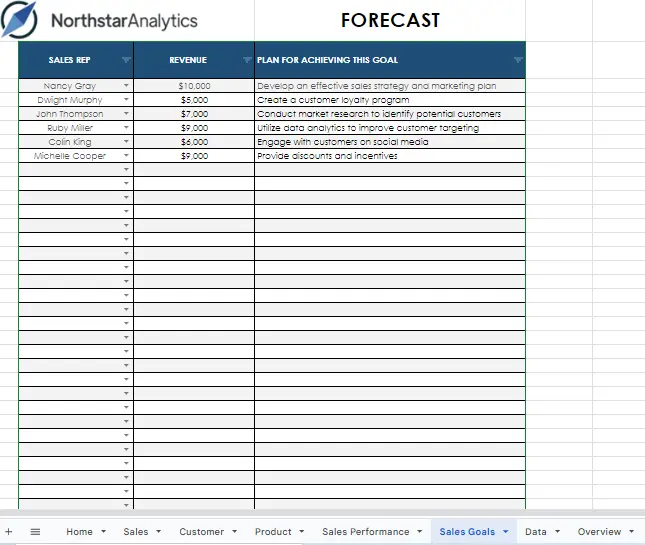
- SALES REP: This column represents the sales representatives or individuals responsible for achieving the sales goals. It helps track and assign specific goals to different members of the sales team.
- REVENUE: The REVENUE column records the revenue generated by each sales representative. It reflects the sales performance and contributes to measuring the success of the sales team.
- PLAN FOR ACHIEVING THIS GOAL: This column outlines the plan or strategy devised by each sales representative to achieve their respective sales goals. It may include specific actions, targets, or approaches tailored to their unique circumstances and market conditions.
Data Sheet
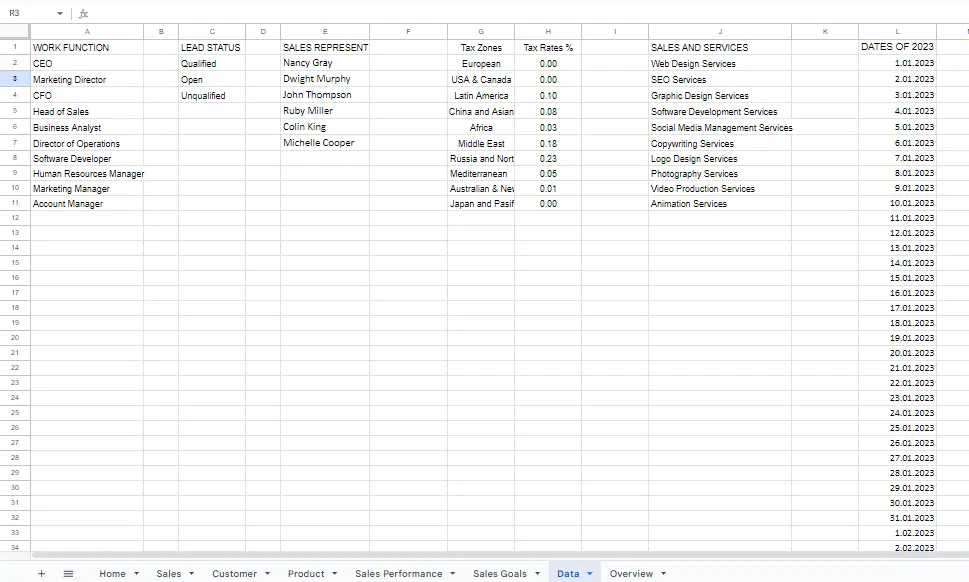
This page displays the raw data used to generate the graphs and charts. It includes customer name, product name, price, total sales, and average sales.
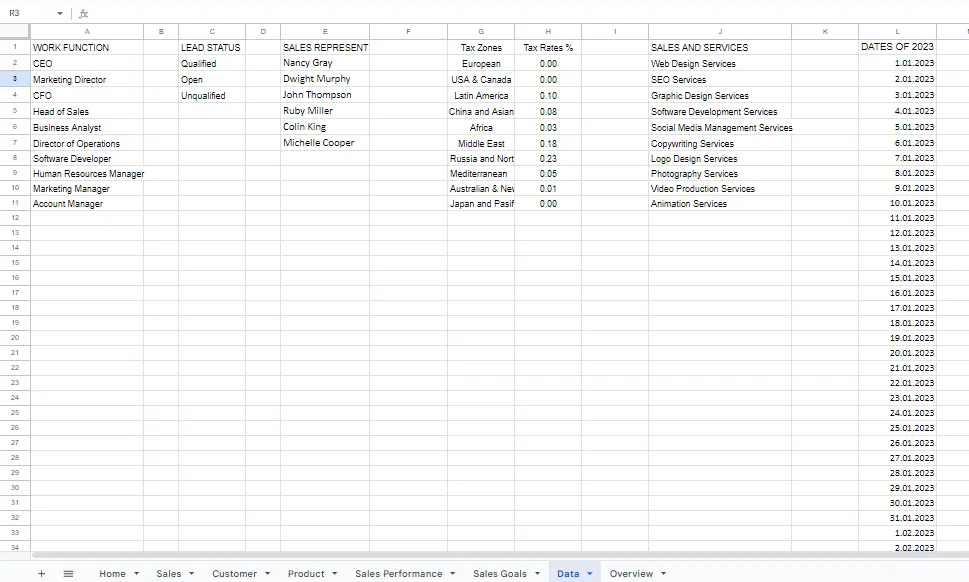
- WORK FUNCTION: This column represents the specific work functions or tasks associated with the sales management system. It helps categorize and identify the different types of work or activities performed within the system.
- LEAD STATUS: The LEAD STATUS column contains information about the status of leads or potential customers. It categorizes leads as "Qualified," "Open," or "Unqualified," providing insights into the progress and quality of leads in the sales pipeline.
- Tax Zones: The Tax Zones column specifies different geographical tax zones or regions. It helps ensure accurate taxation calculations based on the applicable tax rates for each zone.
- Tax Rates %: This column indicates the tax rates expressed as percentages for the corresponding tax zones. It provides the necessary information to calculate taxes on sales and services based on the applicable rates.
- SALES AND SERVICES SALES REPRESENT: The SALES AND SERVICES SALES REPRESENT column records the sales representatives or individuals responsible for managing sales and services. It helps associate sales transactions with the respective sales representatives.
The sheets contain an excessive number of dropdown cells, which offer the same data as related cells without the need for rewriting, thus saving you time. The data in the dropdown lists can be easily deleted, added, or edited directly from the DATA sheets in each file.
How to create dropdown cells?
Let's assume that you want to add your customer data to the customer table and make it selectable in the customer name column.
Create the TAX ZONE header and paste your tax zone data.
Note: If the data includes formatting, you can select "paste values only " from the paste options.
Navigate to the table you want to connect your data to and select the cells you want to connect.
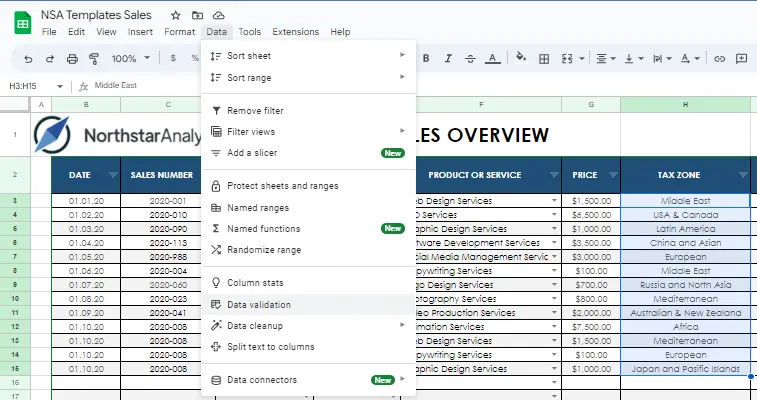
Choose data validation from the data tab.
Select "add a rule" from the window that pops up.
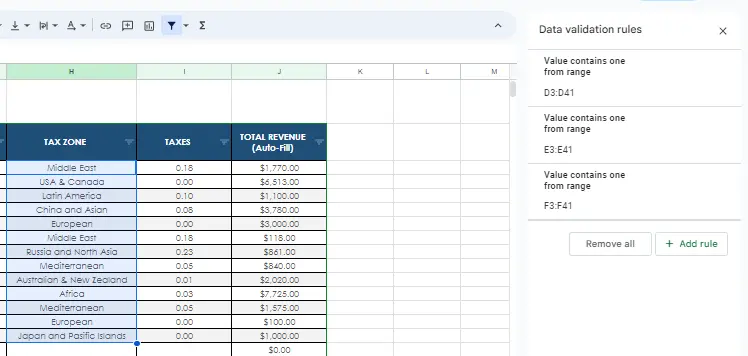
The applied field automatically appears as the field we selected. Under "criteria", select "from a range" from the dropdown menu. Hover over the box and click "Select data range".
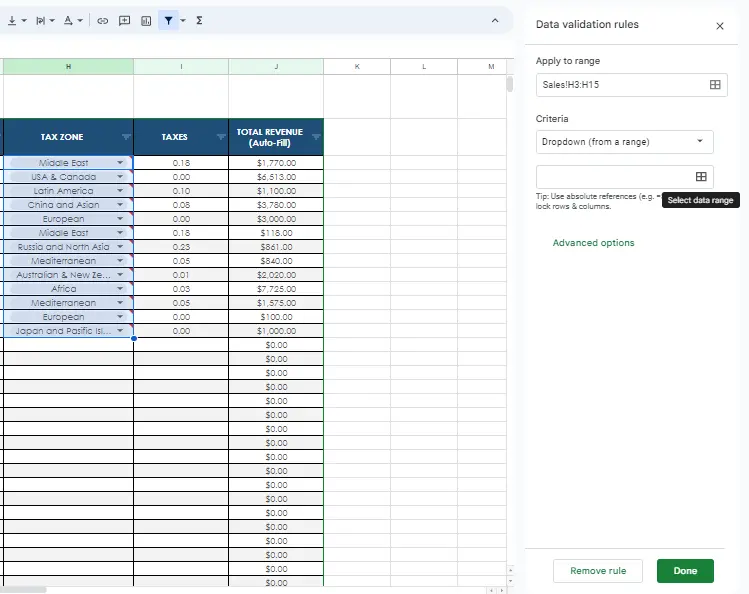
Go to the data page and select your source data.
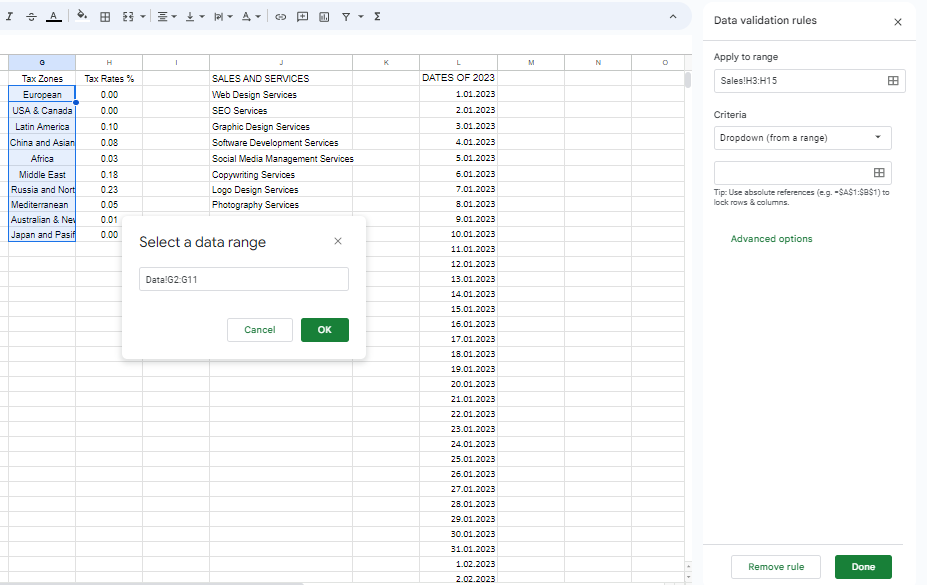
The window that pops up will be automatically filled based on the cells you selected. Then click OK.
Advanced options allow you to make adjustments. I chose to display it as an arrow in the Display Style because I wanted it to look like the others.
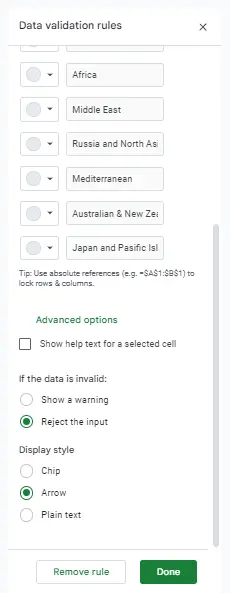
After making the necessary adjustments, click Done. It's ready now.

