Practical Dashboard Design Principles

We have built hundreds of dashboards and found some common principles which help us to bring the most efficient dashboard with relatively small effort.
In this article, we'll share only practical principles we use in our everyday operations.
Don't have time? Here are the basics:
- Choose your dashboard type according to the audience. Don't build for everyone.
- Include only the most important KPIs and solve a max of 3 questions per dashboard page.
- Put the most important KPIs to the top → then graphs → then tables to filter.
- Don't use too many different chart types. Rely on the basics. (Table/Line/Bar charts)
- Design for a smooth experience.
- Make users junior analysts with basic dashboard interactions.
- Don't create new definitions. Use the existing ones.
- Speed is everything. Focus on the loading time.
- We shouldn't talk about data accuracy. This is a prerequisite. And please don't change the reality. Just present as it is.
- Don't focus on the perfect dashboard. Just deliver and focus on the feedback then evolve.
Ready to deep dive? Let's start.
Step 1: Choose a dashboard type
I thought there is only one type of dashboard a couple of years ago before focusing on this niche and it is a "dashboard". But, once I learned more about the data visualisations then, I noticed that there are 3 distinct dashboard types.
Some of these dashboards focus on giving data in a visual way while others are intended for ad-hoc analysis for more technical experts.
| Name | Audience | Function |
| Strategic | Upper management | Optimise the business by monitoring all operational departments. |
| Operational | Experts | Dashboards that are laser-focused. Assist people in saving time in their everyday tasks. |
| Analytical | Analysts | Whatever Robin means for Batman, these dashboards serve the same purpose for analysts. |
So, learning the target audience will be the first and most important step while designing your dashboard. This is our suggested structure for small/mid-level businesses:
- A strategic (cockpit) dashboard for the manager/founder
- Operational dashboard for every team leader and the team members
- Weekly huddles to talk about only data and the drivers which affect the data
Step 2: Focus on the most important KPIs
The human brain can understand around 7-8 different metrics at a time. That means you have limited seats to fill per page.
The dashboard users won't have time like you to spend hours on the dashboard. They need to get what they need in under a minute and return to their daily life.
You can imagine your car dashboard. Which widget does it contain? I remember only 3 things:
- Speed
- Remaining fuel and distance
- Alerts (you don't see any of these if there is no problem)
Probably there are hundreds of different numbers to show but, they make them available only if you need them.
So, put max 7 metrics a page and remove the rest of the metrics and elements. Here are ideas about what you can remove from the dashboard:
- KPIs which don't use by anybody
- Duplicated charts
- Chart grids and decorations
- "Cool" but, exaggerated charts
Step 3: Information hierarchy
There are lots of dashboard page design methodologies but, we like practical working every time. So, here is what we are doing %80 of our dashboards:
- Put the most important metrics as a funnel step at the top of the page.
- Add a trend line either on top of these metrics or below these metrics.
- Add tables that contain the same metrics as columns so, it'll be easy to break down a metric if necessary.
- Give filter functionality to every table to show the trend of sub-dimension when the user clicks on it.
Below is one of our latest dashboards which contains the same methodology.
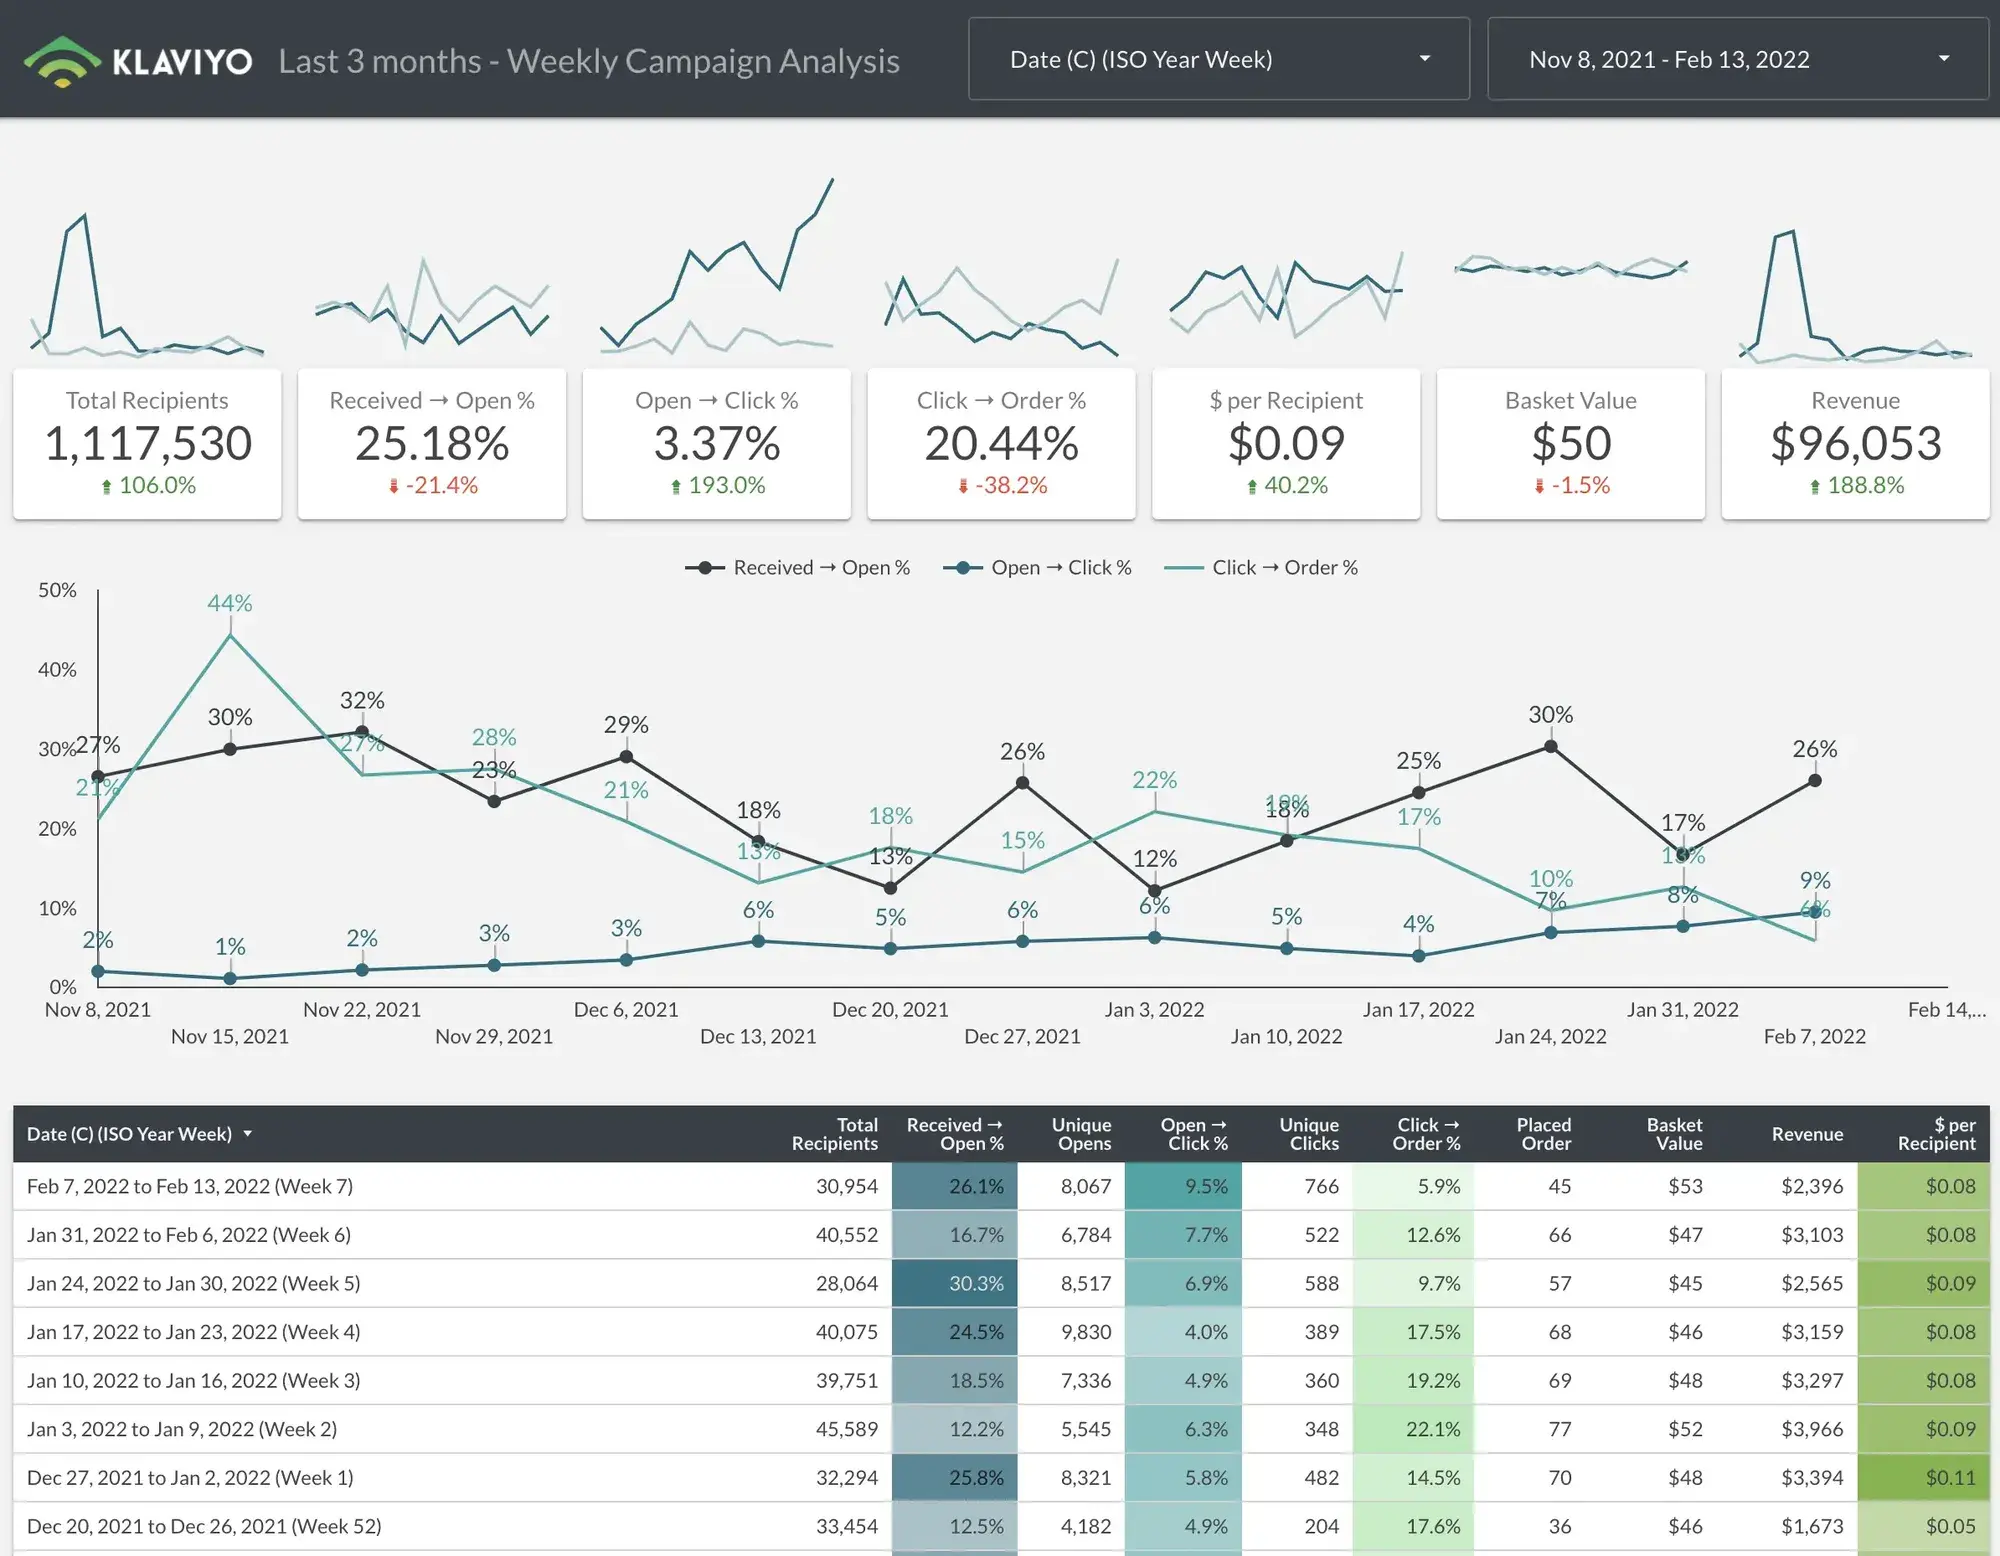
Dashboard users should see the most important indicators at the top of the page and if there is something wrong then, they should scroll the page and break down to understand the root cause of this problem.
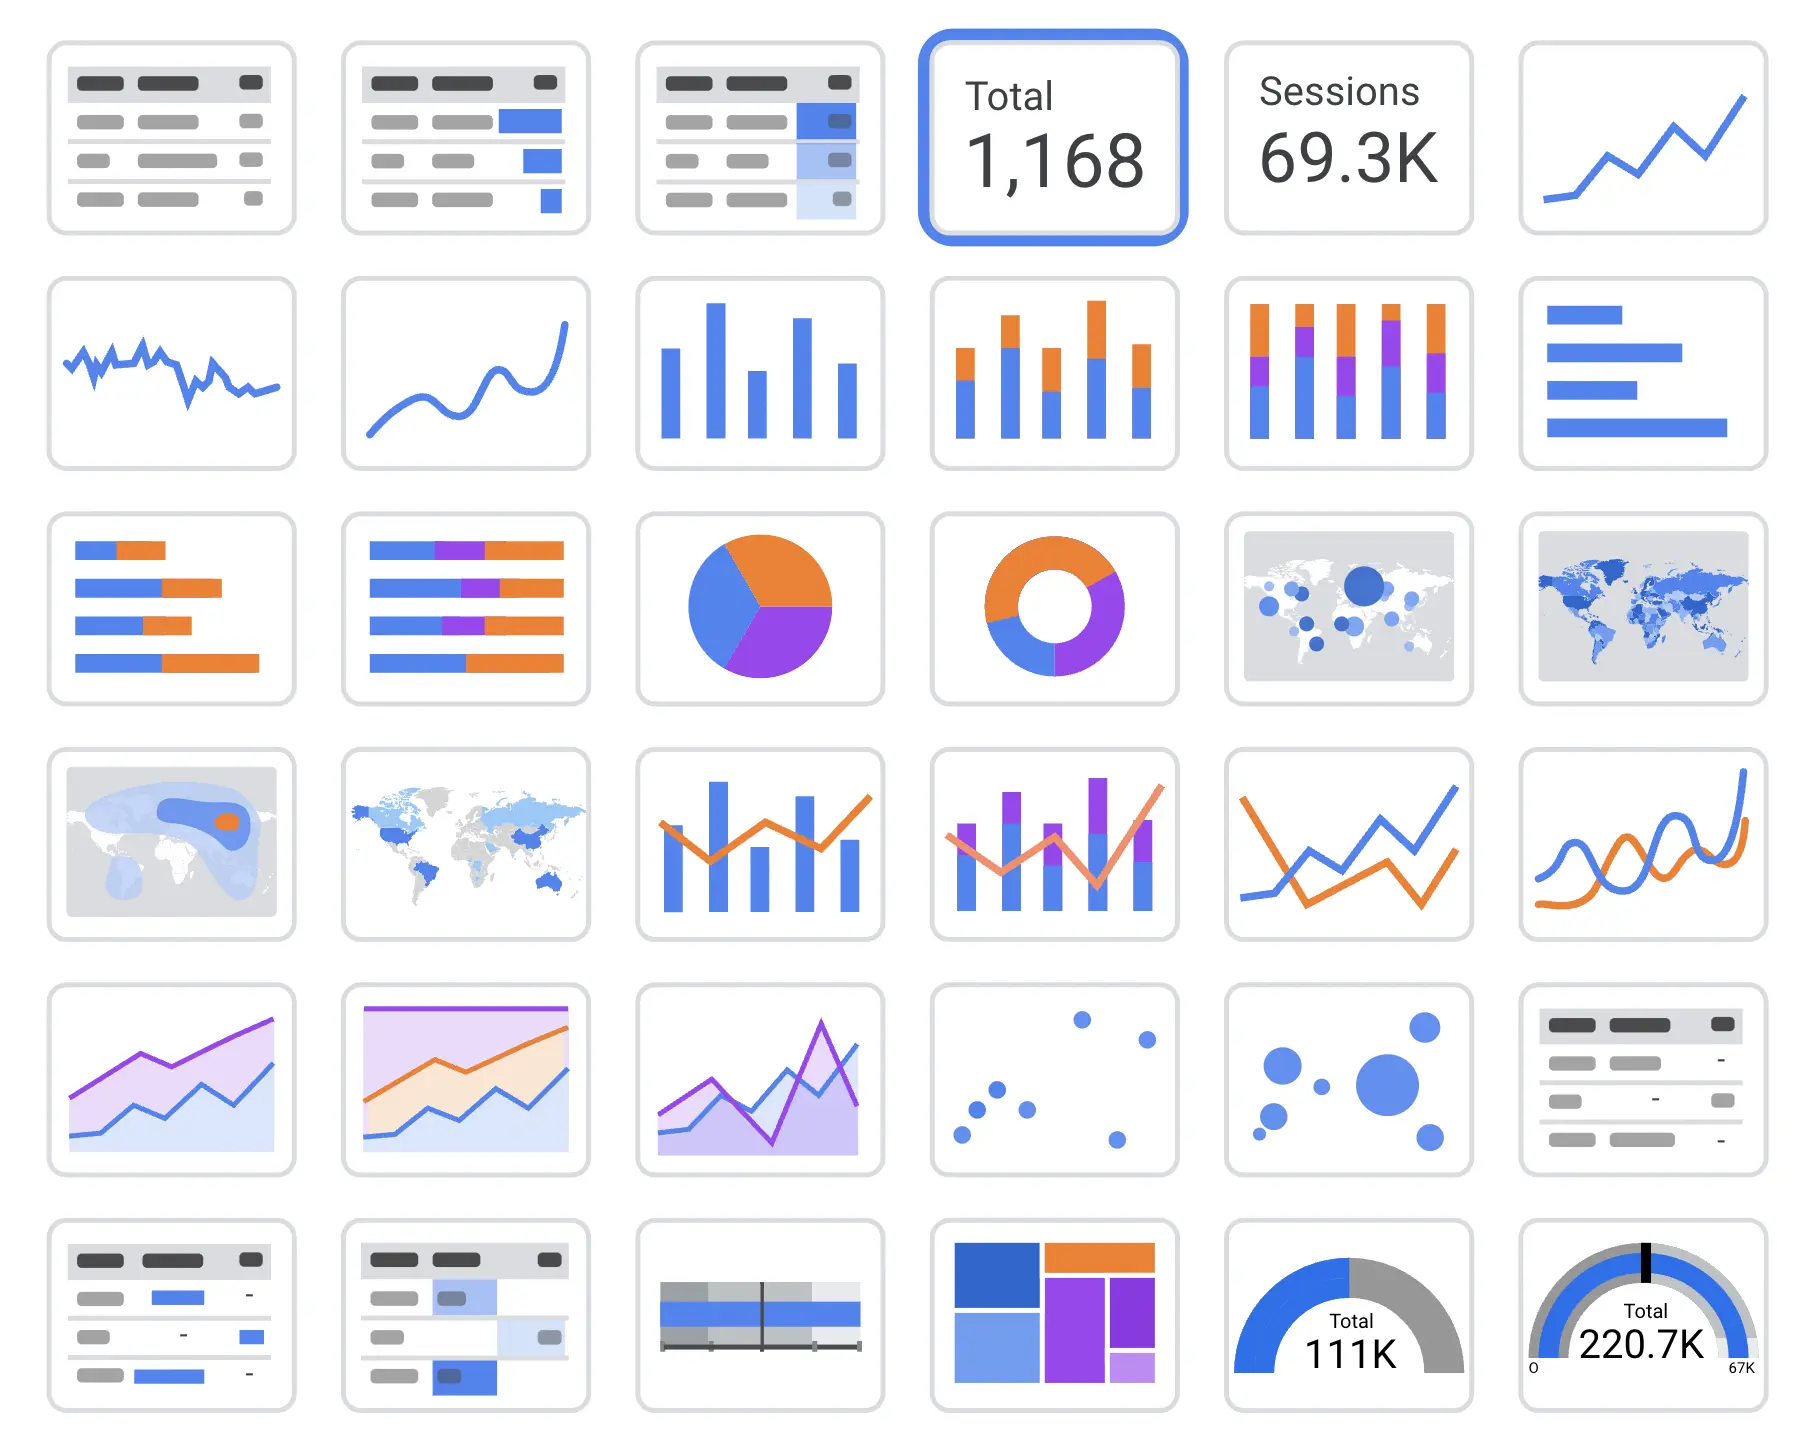
Step 4: Choose the Right Chart Type
There are tens of different chart types in Google Data Studio but, do you want my honest view about using these charts?
Just use these 3 types:
- Scorecards: To give the total amount of a metric
- Bar/Line Charts: To show the trend of a metric
- Tables: To give users the power to breakdown a metric
You can create %90 of the dashboard with only these 3 widgets.
There are lots of fancy dashboard templates out there but, our focus is to drive cultural change toward data-informed decisions, not prolong the learning curve and make the onboarding process more complex.
If you want to see:
- The relationship then goes with bubble and scatter chart
- The comparison then uses bar, line, column charts and scorecard
- Scatter charts and histograms are great for distribution
- Any stack charts, pie charts, heat/treemaps are useful when you see the composition of the data
Step 5: Adapt the design
You don't need to be a good UI designer to generate a beautiful dashboard. We have some tricks for you :)
Trick 1: Copy the design elements
You are building a dashboard to save time for dashboard users. One of the main ingredients is to reduce the time of adaptation to the dashboard.
So, learn about the data source and use this data source's design elements in your dashboard. For example, if you are using Google Analytics as a data source then, make your dashboard looks like Google Analytics. The same applies to another data sources such as Shopify.
If dashboard users are keen to use the Shopify reporting interface and you make the dashboard looks like Shopify reporting. Their adaptation to the dashboard will be super easy.
Trick 2: Be consistent about everything
You'll use the same elements many times on different pages. Use the same colour/chart/size to make your dashboard easier to understand for users.
These are short tips about visual consistency:
- Use the same colour for the same dimensions even in different chart types.
- Page titles should have the same structure and contain hints from the page context.
- The header and the footer should be the same on every page. You can make them "report-level" to keep this consistency.
- Look at the spaces between the elements. Every element has the same space around it.
- If you use shadow, border radius or border colour, you should use it on almost every possible widget.
- Try to use only one font (we suggest Montserrat).
- User "Sections" to create a dropdown at page navigation.
- Red is for warning, green is always a good thing.
Step 6: Efficient interactions
You should hide many features as you can while keeping them functional for users. The Cross-filtering function is one of our favourites since it is like a hidden gem.
You can add a filtering function by enabling this toggle to the tables. So, users can click on any row of any dashboard to filter the entire page.
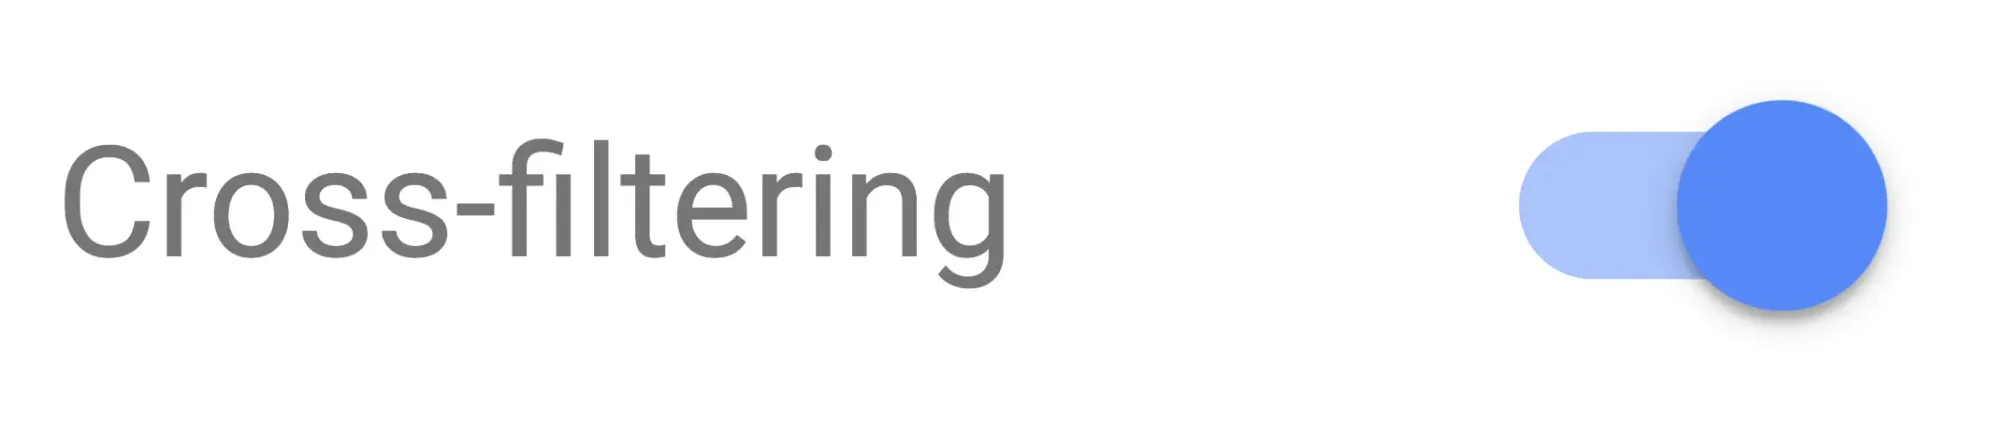
You can make every chart interactive only by activating this toggle. So, users will have practically unlimited filtering options and cases with these simple improvements.
We won't talk about dropdown filters which are obvious to use in many cases such as if you have more than one:
- Accounts
- Products
- Clients
- etc.
Step 7: Effective use of language
The primary aim of the dashboard is to give users the insight that they needed in a short time. So, we need to remove the barriers to prevent users to use the dashboard.
One of the barriers is the language of the dashboard. If your dashboard has:
- Different terminology than the user is used to in daily life
- Inconsistency naming between pages for the same metric
- Technical names you can only use on your SQL queries
- Looong naming structure
Then, your dashboard will have friction in user experience. The users will always think twice to understand the charts which will lead them not to use the dashboard in time.
Don't obsess with your own naming even if it is more accurate. Ask for your user's own terminology and use them on your dashboard. This will make your dashboard theirs.
Step 8: Loading time is everything
You will design the simplest, most effective and charming dashboard but there is a problem. The loading time is over a minute!
Users are waiting to see the page for a minute. But, the real problem is that they have to wait this 60 seconds every time they try to change the data range or click a filter. What a pain!
Think about we have 2 options:
- The super fast standard dashboard
- The fittest but, slow dashboard
The users will select these options evenly but, none of the second option's users will keep using the dashboard.
So, if your aim is to design a dashboard that lasts longer then, you should really focus on the speed as you spend time on design.
Step 9: Don’t manipulate reality
You have the power of manipulating the data but, don't use this power to change the reality. The dashboard should give the hard and cold reality to the team so, they can act accordingly.
Step 10: Keep evolving
The business won't be the same when the dashboard is operational. They will start seeing new insights every time they look at the dashboard. Their data analysis maturity will be increased over time. So, they will need new chats, data sources and pages over time.
That is why you shouldn't deliver the most complete dashboard as phase 1. You should deliver what they need then, evolve together.
You can add a GA4 ID to track the usage of this dashboard. If they don't use it, you can get their honest feedback to improve the dashboard and make it operational again.

Also, the dashboard will evolve once the business priorities and goals change. Make sure to update your board regularly so that it serves as your heartbeat.
Bonus: Characteristics of great dashboards
There are some characteristics of great dashboards that deliver impact to the business. They:
- are clear
- deliver information effectively
- can be customisable
- provide all the necessary metrics together
- have drill-down options when necessary
- include smart filter options
- are easy to understand and use
- have descriptive labels and definitions
- use the same language with your department


