What is a Marketing Dashboard?

To achieve the best outcomes from their initiatives, marketing professionals must effectively employ a blend of art and science. Not only does a strategy need to be forward-thinking and creative, but it also needs to be supported by relevant data and metrics to ensure that every dollar spent on advertising is profitable for the company's bottom line.
A marketing dashboard is one of the tools that modern enterprises may utilize to gain insight into the key performance indicators (KPIs) of their initiatives that are taking place behind the scenes.
An intuitive dashboard makes it simple to see marketing KPIs that clearly illustrate what an organization must do to allow the best possible connections with its clients.
A decent dashboard should be able to be customized to meet the specific marketing objectives of each company.
Generally, dashboards gather information from various data sources, such as social media, your website, campaign management tools, Excel spreadsheets, and other similar sources.
This marketing data may then be exported and used to create a marketing report for your company. The findings of the research can be utilized to improve marketing, websites, and an organization's entire digital presence, among other things.
Chapter 1
Do you need a Marketing Dashboard?
In real-time, marketing dashboards enable marketers to gain visibility into their success by monitoring important campaign metrics and key performance indicators (KPIs).

It is possible to make course adjustments and gradual improvements that add up over time when there is clear visibility.
A marketing dashboard may give your department an instant overview of your progress toward accomplishing established goals by bringing your disparate data from several MarTech tools together in one place.
Dashboards may provide a quick and trustworthy overview of information; without them, it could take hours to collect and combine data to obtain the same insight manually.
Chapter 2
Elements of a Great Marketing Dashboard
The marketing funnel stage will determine the metrics a marketer will choose to track that the marketer is attempting to improve.
Each funnel stage would require a different dashboard with different metrics because there are three levels: awareness, deliberation, and decision.
Create a dashboard containing top-level data demonstrating reach, engagement, audience size, and impressions to track the awareness stage. These measurements will be used to determine the size of your audience and how the brand is perceived.
Create a dashboard with more detailed information to keep track of the contemplation stage. This entails concentrating on conversion rates as well as search engine performance.
Inbound calls, call kinds, website user retention, leads in nurture campaigns, and the rate at which leads become opportunities are measurable indicators of prospects proceeding to the decision stage.
Construct a dashboard containing relevant indicators, such as conversion data and insights into ad success to track the decision stage.
Top 4 elements of a great marketing dashboard;
1. Channels or lead sources are the most important
This is a very straightforward exercise! You, as a company, are well-represented on the internet. You have a website, social media platforms, advertisements, posters, banners, films, infographics, and probably more to promote your brand or business.
But which channel is responsible for the majority of calls? Which aspects of digital and conventional marketing should you pay more attention to? What are the channels in which you may make the cost savings?
2. Keywords
Using keywords drives call not only traffic but also other actions such as clicks, likes, comments, and so on. All of these elements combine to form the whole client journey.
It's critical to remember that diverse attribution categories such as channels, mediums, sources, and keywords are all just variations on the same theme. It would help if you continued to build on the characteristics that distinguish each of those sectors as essential components of your marketing strategy.
Aside from call traffic, you can go into greater detail by concentrating on the following critical features.
3. Pay-Per-Click (PPC) expenditure
Many of our customers in the digital marketing industry place a strong emphasis on their pay-per-click (PPC) expenditures. Their primary concern is ensuring they receive the appropriate degree of attribution.
4. ROI (return on investment)
Marketers want to know how much money they make on every dollar they spend. Our Marketing Dashboard enables businesses to narrow their attention to these PPC-related terms. They can quickly identify which PPC keywords and concepts are generating calls.
You may even track which phone calls result in purchases. As a result, you can identify the calls that result in conversions on the marketing dashboards. This is the level at which enterprises must concentrate their efforts to determine what the calls are truly doing.
That you may have a firm that generates hundreds of calls based on a specific search term but that those calls never result in appointments or visits is fascinating to me. To the extent that organizations spend money to drive attention to keyword strategies that never actually result in a sale, they are effectively wasting their money.
Chapter 3
What should a marketing dashboard include?
Identify patterns and tendencies, Find answers to internal inquiries ...

- Make data-driven communication possible.
- Investigate potential opportunities
- Track your progress toward your key performance indicators (KPIs).
- Observe pacing
- Include key performance indicators (KPIs) and metrics that will drive future action.
- Colors and themes that are visually digestible should be used.
- Select charts that require a higher level of comprehension.
- Design elements that are distracting and superfluous should be eliminated.
- Make it simple for people to collaborate and share information.
Chapter 4
How to Make a Marketing Dashboard
When you ask yourself - how to build a marketing dashboard? - you might feel overwhelmed.
Let’s divide and conquer. Here are 3 steps to make a marketing dashboard.
Design
The most effective marketing dashboards are frequently pretty straightforward. They strike the correct mix between the most valuable indicators and the available data points. Each firm, on the other hand, takes a unique strategy to market. The selection of prominent marketing metrics can be influenced by the aims of a company.
If the primary goal of marketing is to increase sales, the most important data to demonstrate will probably be the number of customers and the rise in revenue. When it comes to the growing knowledge of your offerings, metrics such as visibility and interaction are critical.
Build
It is critical to organize a dashboard in such a way that it is easily accessible to everyone. The longer it takes to scan over the document, the worse the visual arrangement is. A good rule of thumb is that any relevant material should be retrieved within 5 seconds after entering the search term.
The insights are to be displayed from top to bottom in the order of importance, starting with the most significant. If possible, keep the number of visualizations on a single dashboard to no more than 7-9 for the sake of visual clutter prevention.
Visualize
Different sorts of data necessitate the use of various forms of visualizations. Line charts are the most effective way to display continuous data (such as marketing expenditure) over an extended period. Comparisons between discrete categories are shown by bar charts (like conversions from multiple channels).
Pie charts are particularly well suited for comparing parts or sub-sections of a complete section (say traffic sources). Funnel charts are excellent for demonstrating the various stages of a process (marketing conversion funnel).
Chapter 5
Benefits of Marketing Dashboards
Increased return on marketing investments. Marketing dashboards give firms aggregated data that can be used to identify strategies that are not generating revenue and replace them with more revenue-creating and financially beneficial ones.
2. Improved teamwork and collaboration
Dealing with a plethora of data sources in a fragmented online marketing environment can be difficult and time-consuming.
Combining and presenting useful information in a centralized location saves a great deal of time and makes any decision-making process far more efficient and less time-consuming.
3. A tool for motivation
Dashboards provide employees with a visual representation of their performance in relation to their objectives. They may see a direct correlation between their efforts and improvements in the indicators.
Employees are more motivated when they see the tangible consequences of their efforts, which is especially important when transitioning to performance-driven workplace culture.
4. Making well-informed decisions
The use of a dashboard allows for a better understanding of the relationships that exist within the data as well as the ramifications of certain marketing actions when they are implemented.
Incorporating crisp graphics and powerful analytic methods, well-designed dashboards aid in this process by assisting users in both their day-to-day business operations and their long-term strategic decisions.
5. Keep track of the latest developments
In order to create actionable insights based on current developments, relevant key performance indicators (KPIs) can be extracted from strategic goals and shown on a dashboard in order to track progress.
Chapter 6
Example of marketing dashboards
1. Marketing Performance Dashboard, 2. Digital Marketing Dashboard, 3. SEO Analytics Dashboard, 4. Online Marketing Dashboard, 5. Social Media Dashboard, 6. Google Analytics Dashboard, 7. Content Marketing Dashboard, 8. Email Marketing Dashboard, 9. Web Analytics Dashboard and 10. E-Commerce Marketing Dashboard.
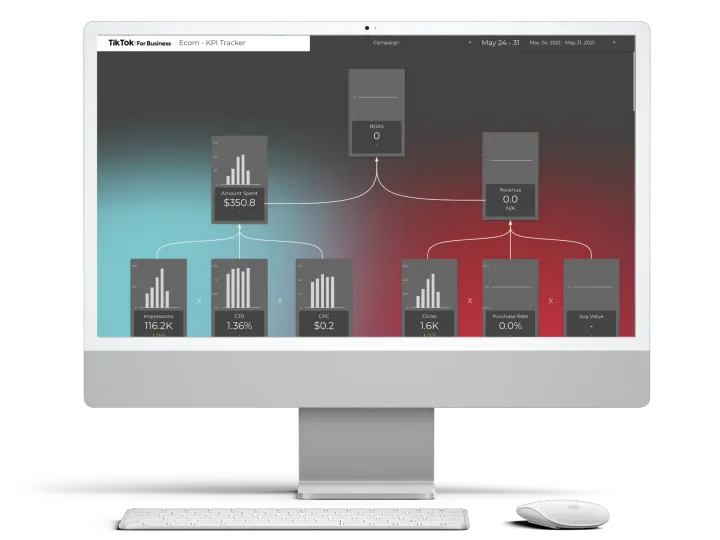
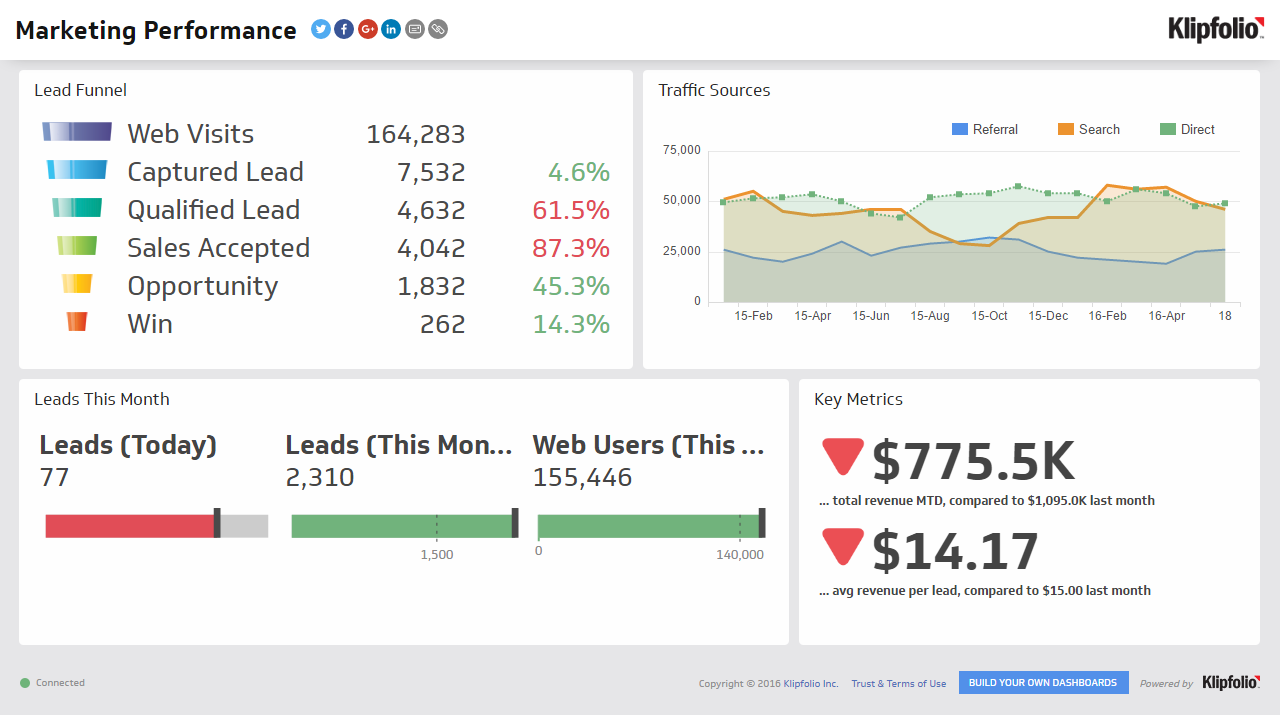
1. Marketing Performance Dashboard
a) What Exactly is it?
This type of dashboard gives a better overview of the conversion funnel as well as other relevant statistics. It enables marketers to make more educated decisions about conversions, revenue, and lead creation by providing them with data.
b) What it is trying to track?
In order for marketers to determine what makes a successful marketing campaign, it measures data such as leads, site visits, and conversions through the use of real value.
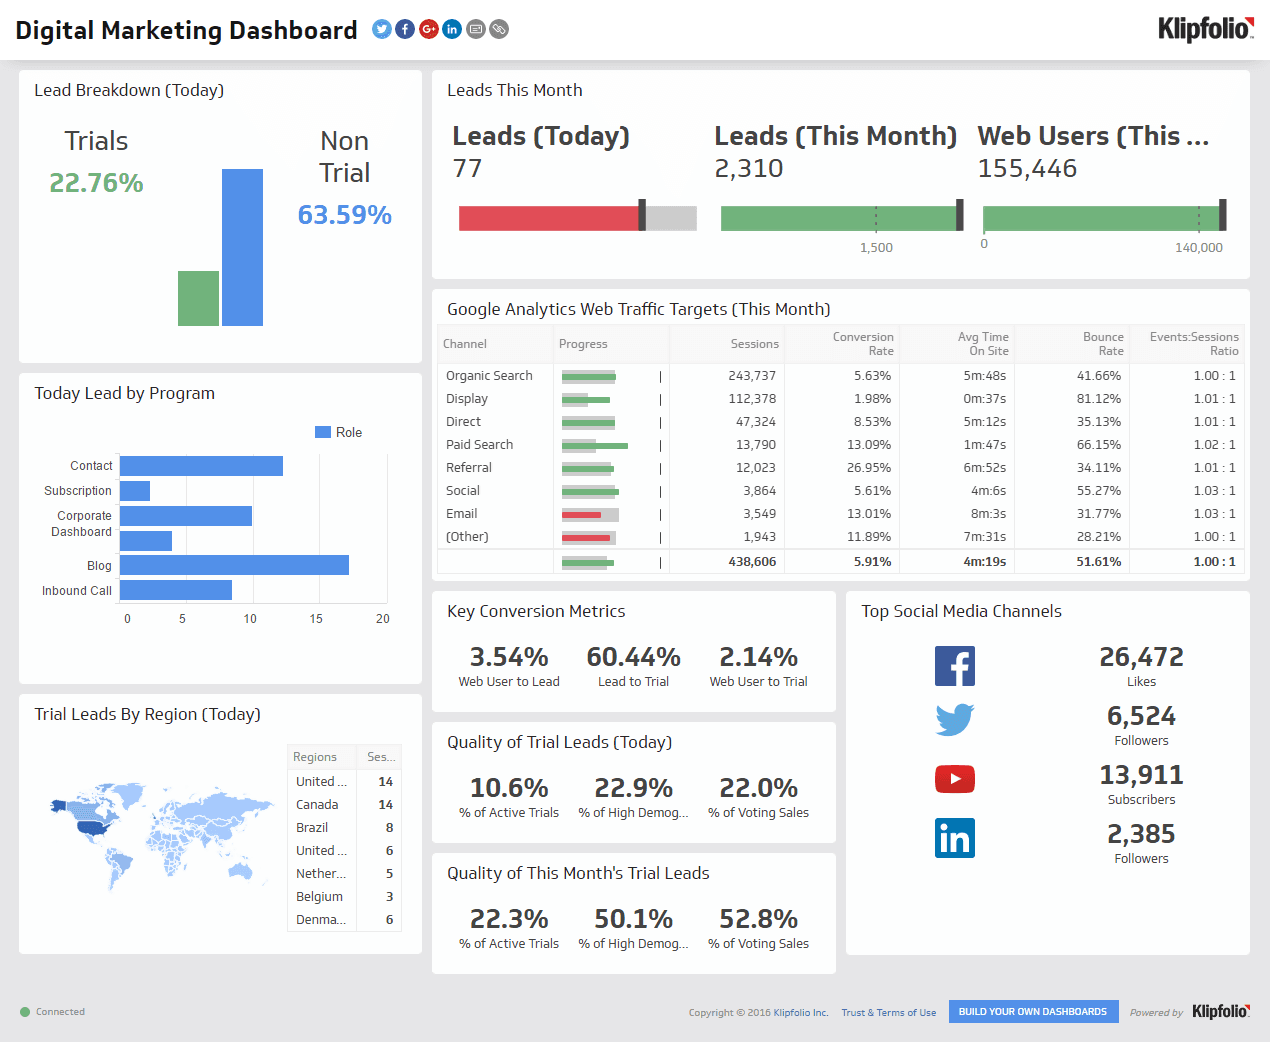
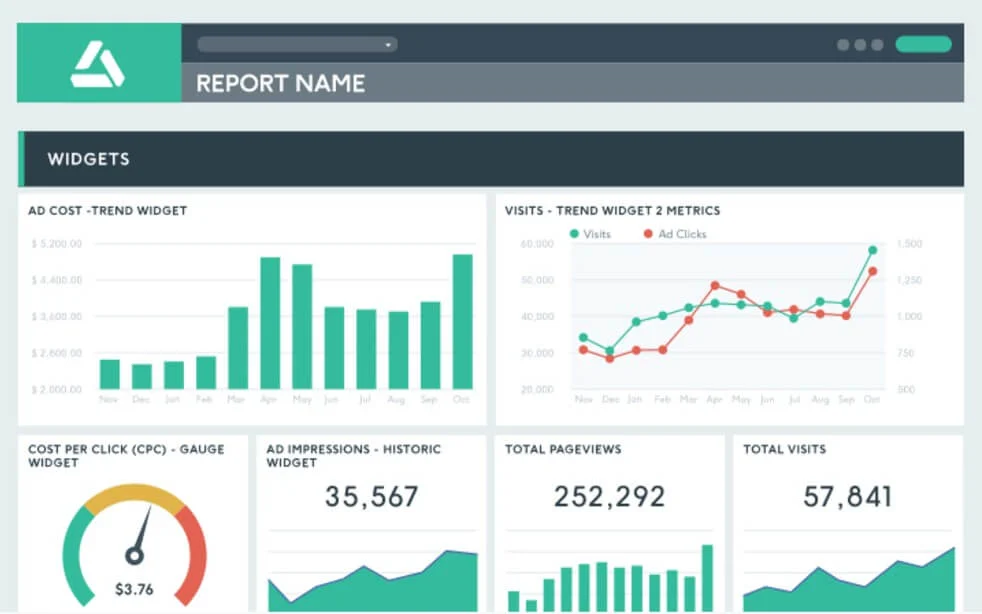
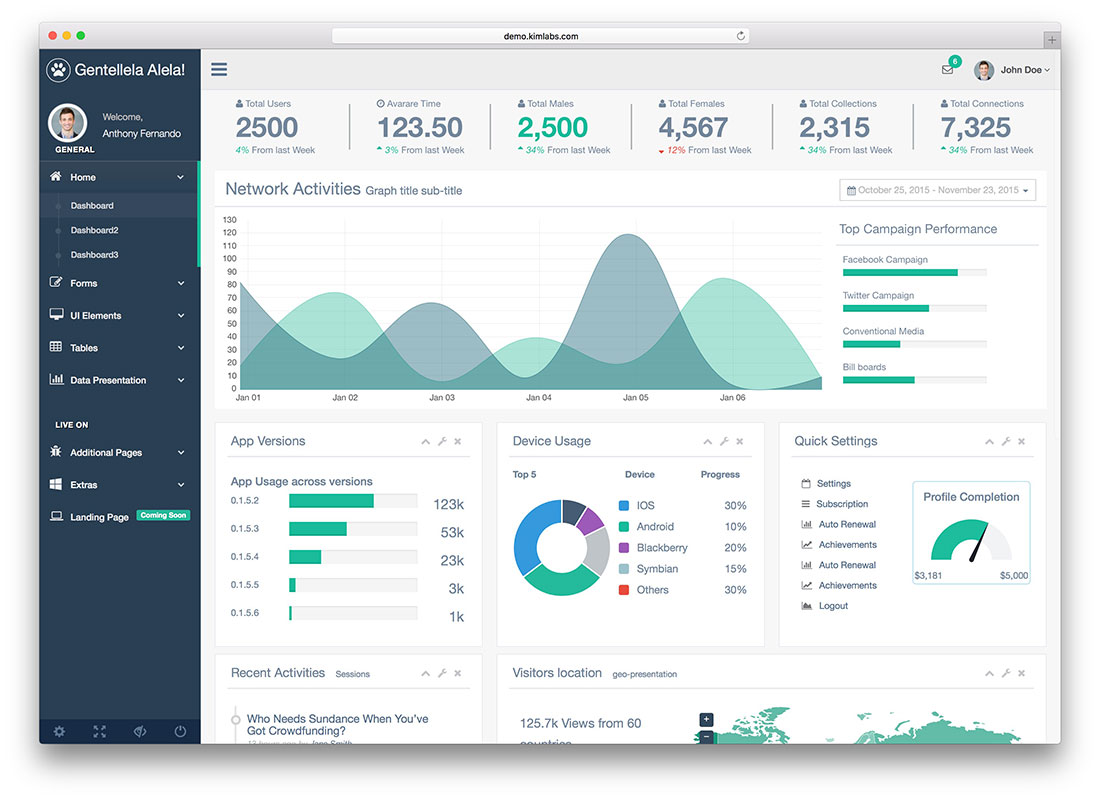
2. Digital Marketing Dashboard
a) What Exactly is it?
This is a data dashboard that keeps track of a company's digital and online marketing initiatives, helping marketers to make more informed decisions about budgets and strategy.
b) What it is trying to track?
In addition to tracking campaign results in real-time, it will also track several other digital marketing indicators.
Social media marketing, email campaigns, AdWords (now Google Ads), campaigns, Facebook ads, and website traffic are some of the metrics that are tracked to assist prioritize spending and demonstrate progress toward goals.
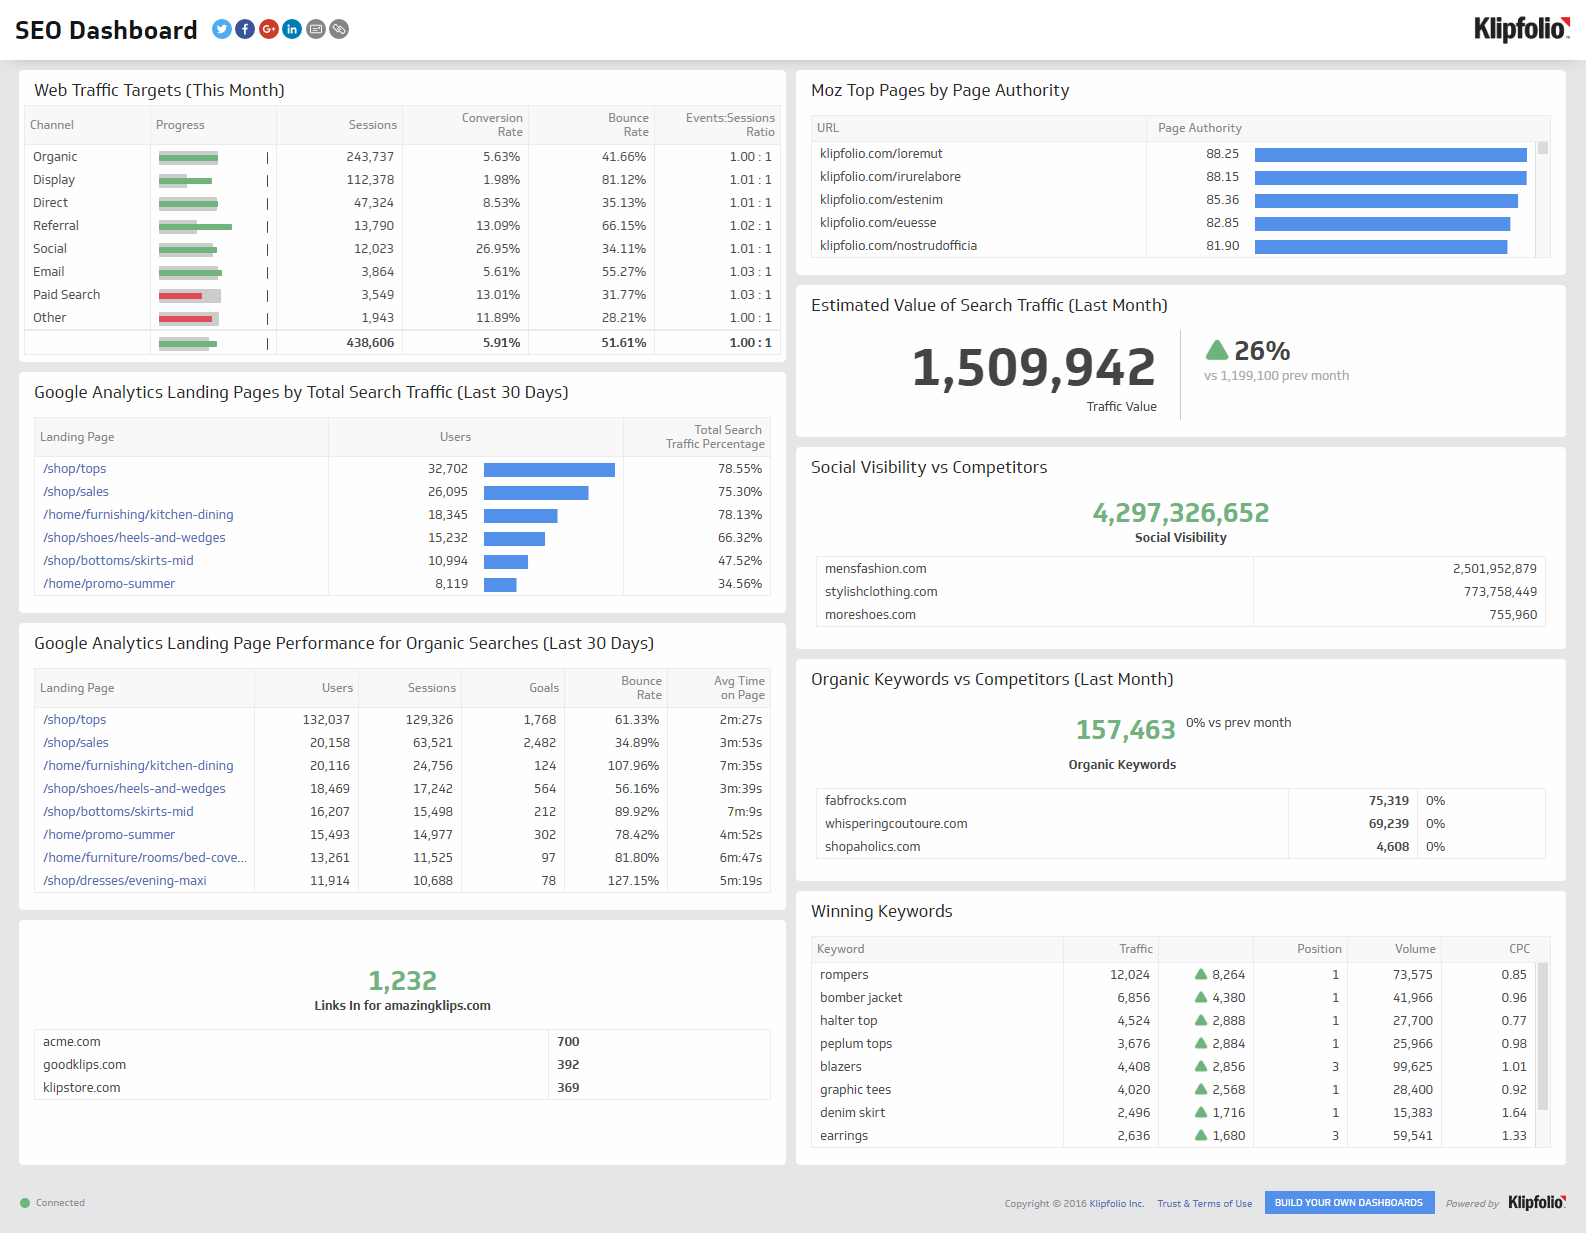
3. SEO Analytics Dashboard
a) What Exactly is it?
This type of dashboard is used to track the performance of SEO campaigns using a variety of parameters. In order for the marketing team to be able to track the progress of their website on organic search engine results pages, this information is essential.
It identifies regions that require improvement in optimization, the best-converting keywords, the top-performing pages, and other relevant information.
The goal of SEO is to increase traffic to a company's website through the use of backlinking, internal linking, and other techniques.
b) What it is trying to track?
This dashboard keeps track of data from several analytics systems, such as Google Analytics. It keeps track of factors like the number of keywords on a website, the ratio of organic traffic to other sorts of traffic, the speed at which a page loads, the number of indexed pages, the number of backlinks to a page, and many other things.
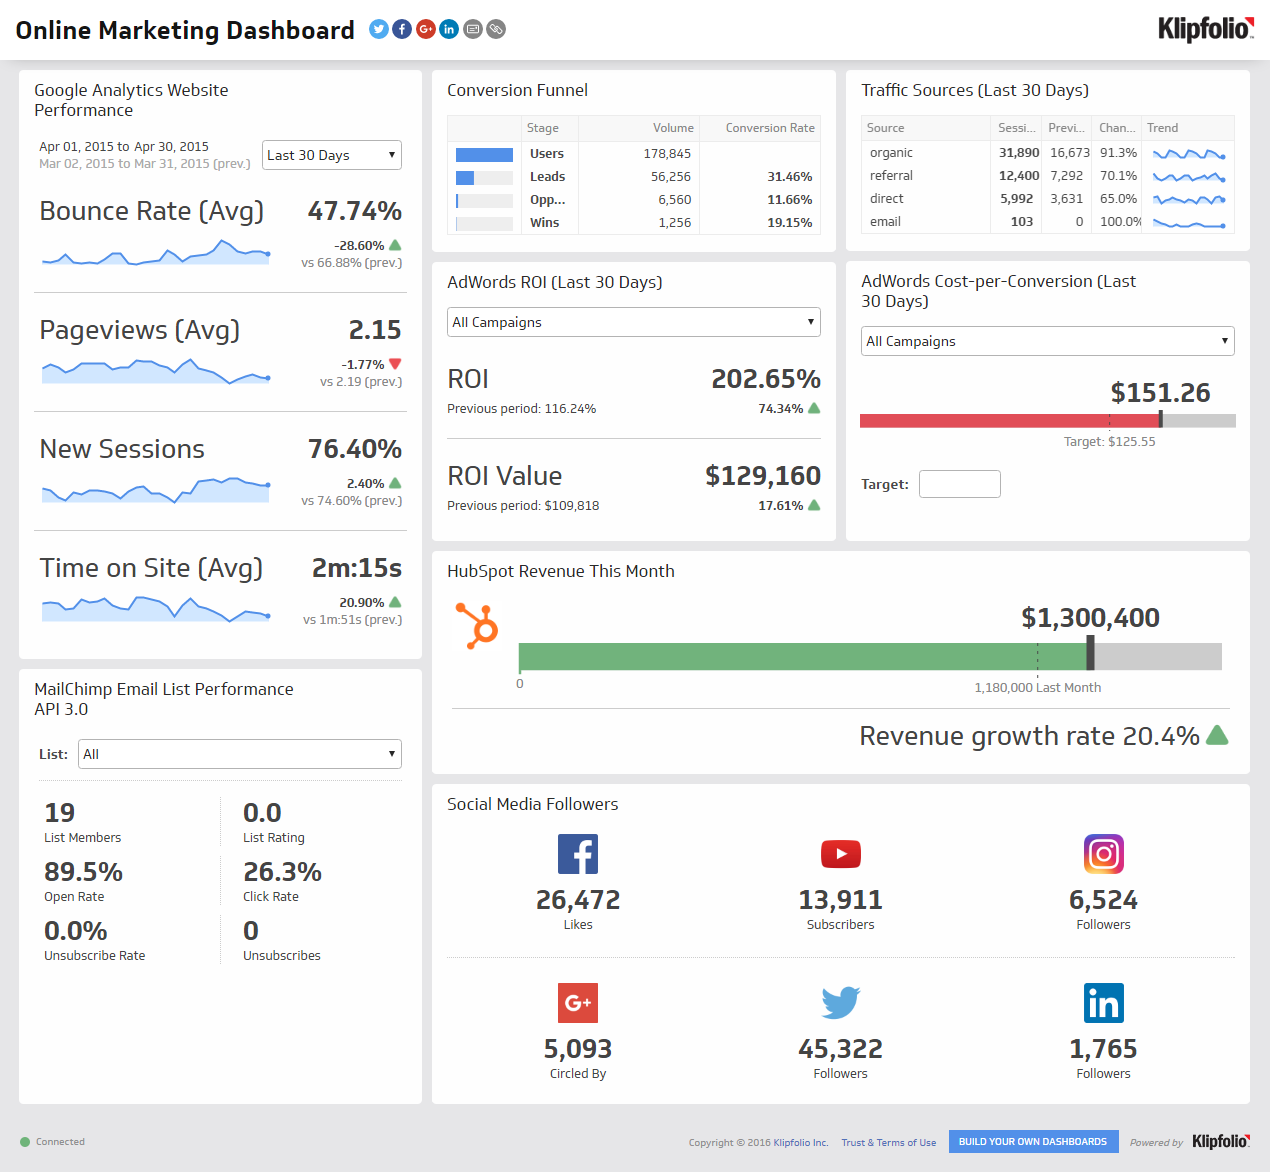
4. Online Marketing Dashboard
a) What Exactly is it?
This dashboard offers marketers a high-level overview of their online marketing initiatives. It consolidates and analyzes data from a variety of marketing channels, providing a high-level overview with the option to dive down by marketing channel.
b) What it is trying to track?
In addition, it will track the performance of various channels such as email marketing, social media platforms such as LinkedIn, and pay-per-click (PPC) campaigns, among other things.
In terms of income generated, incoming leads created, and website performance, it can break down methods and campaigns in a variety of ways.
The conversion rate is the most crucial parameter that has to be tracked. A conversion rate measure should be included on all dashboards because it indicates the number of visitors who become leads or customers after visiting a landing page or a comparable page.
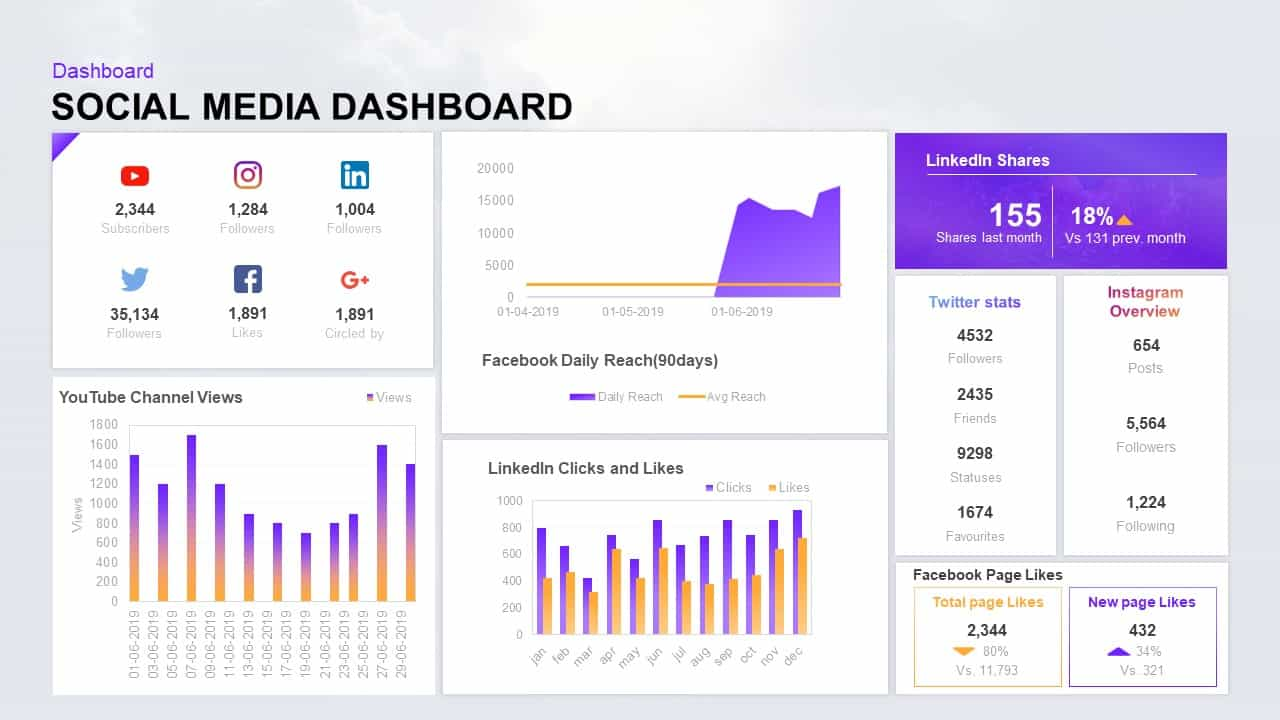
5. Social Media Dashboard
a) What Exactly is it?
This dashboard template keeps track of key performance indicators (KPIs) for social media. Social media is becoming a significant source of traffic, but it can be difficult to track because the corporate website is not often the first point of contact.
As a result, marketers must frequently get analytics and data directly from the social media platform.
b) What it is trying to track?
It will watch social media analytics in order to offer marketers a comprehensive picture of performance and engagement on social media, as well as if leads are going through to the company's web page. Likes, shares, new followers, engagement, top posts, growth, and loss are just a few of the metrics that may be monitored.
Every social media platform has the ability to track its own information, but the dashboard consolidates all of that information into one location rather than scattered across many sites.
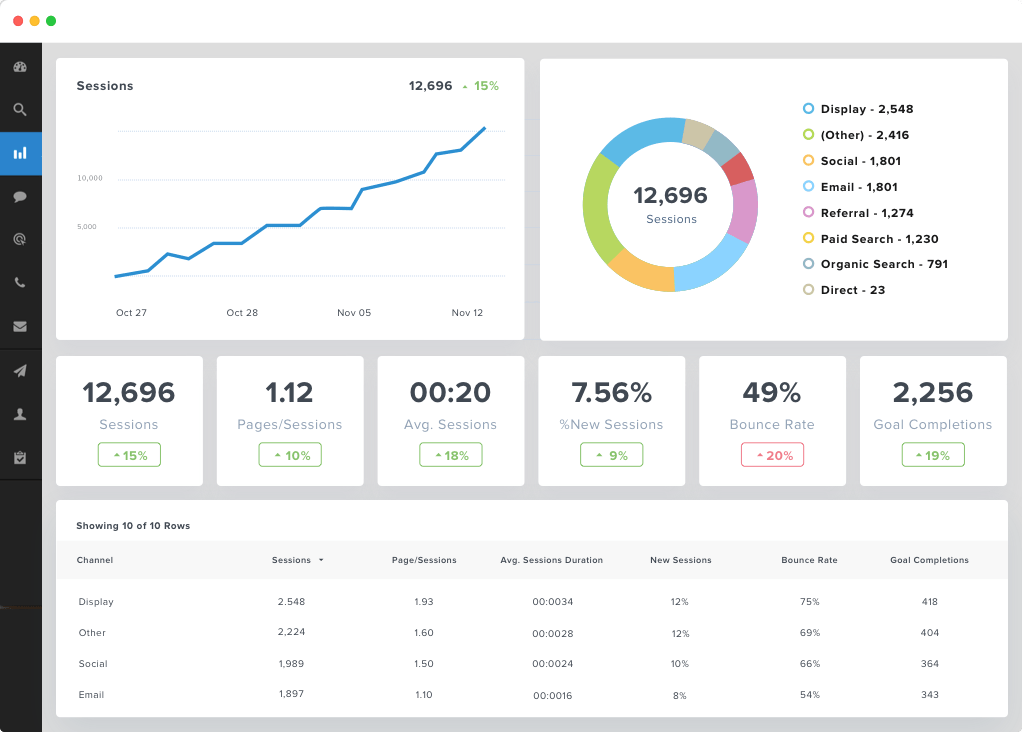
6. Google Analytics Dashboard
a) What Exactly is it?
The term "Google Analytics dashboard" refers to the dashboard supplied by Google Analytics, which is widely regarded as one of the most essential marketing key performance indicators (KPI) dashboards for website data.
Data from Google Analytics, on the other hand, may be imported into other dashboards, as you'll see in our demonstration below. It provides marketers with easy and rapid access to key performance indicators (KPIs) for instant assessment of success, as well as the ability to analyze and adjust approaches as needed.
b) What it is trying to track?
This one keeps track of all of the important metrics for website traffic in one convenient location. This comprises key performance indicators (KPIs) such as bounce rate, session length, conversions, interactions, channel performance, source, and overall traffic, among others.
7. Content Marketing Dashboard
a) What Exactly is it?
This sort of dashboard examines the specifics of content marketing and determines whether or not an organization's content marketing activities are successful or ineffective. The information is tracked, monitored, and then evaluated in order to offer content marketers actionable items.
Making content adjustments in response to analytics offers a stronger return on investment in terms of lead generation, which allows the sales force to quickly take over and convert prospects that are already highly qualified.
b) What it is trying to track?
Because it provides regular monitoring, it allows marketers to correctly review and alter their content marketing techniques in order to assure positive change and improvement over time.
In addition to metrics that measure content interaction such as downloads, reads, comments, shares, and likes, metrics that monitor sales, conversions, inbound links, and referral traffic may be used.
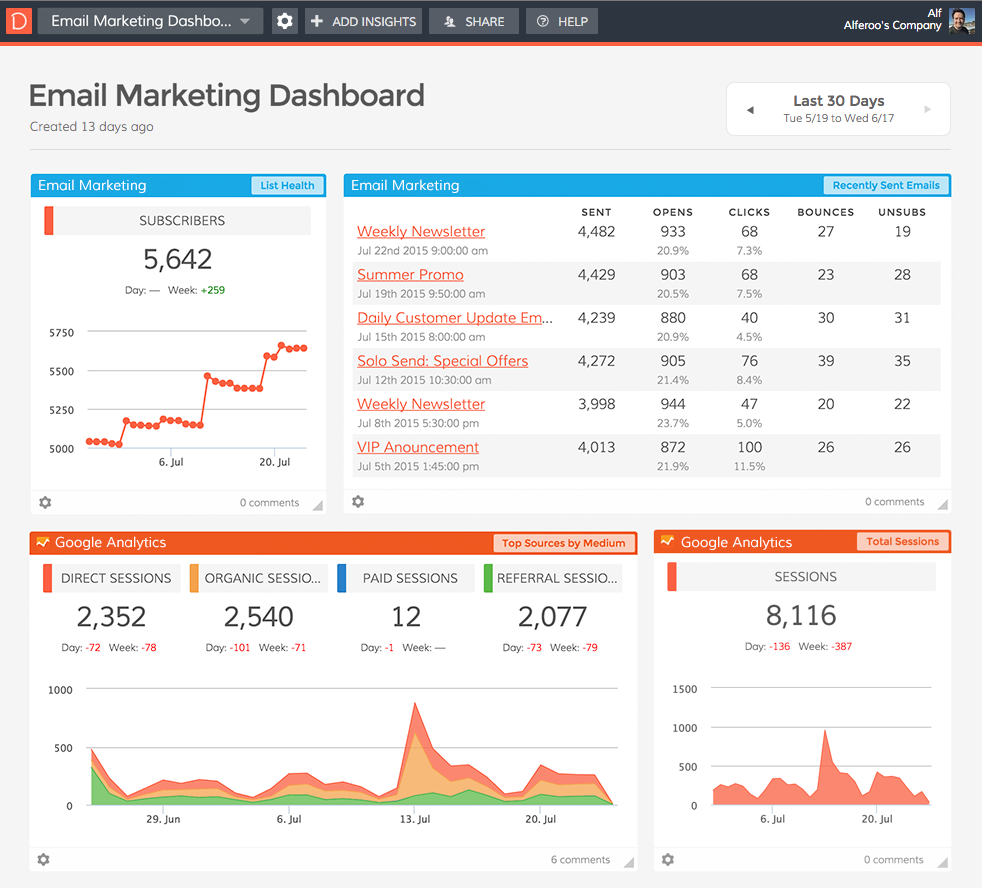
8. Email Marketing Dashboard
a) What Exactly is it?
In order to provide a rapid snapshot of anything related to email marketing, an email marketing dashboard should be able to do so. It is compatible with the majority of email marketing applications and can integrate with other applications such as Google Analytics. When it comes to email marketing, you should be able to tell at a glance how well your campaigns are functioning and how much interaction you are creating.
b) What it is trying to track?
An email list's health (i.e., the quality of leads on your email list) is tracked, as is engagement over a specified period of time, bounces, unsubscriptions, new subscribers, open rates, and click-through rates, among other things.
9. Web Analytics Dashboard
a) What Exactly is it?
In real-time, this dashboard examines the performance of the website in relation to the marketing objectives. It can also be applied to a variety of different time spans, including historical data. Users will be able to study both real-time data and patterns over a period of time.
b) What it is trying to track?
Bounce rate, page views, new visitors, returning visitors, traffic referrals, and other key performance indicators (KPIs) will be tracked to determine how customers interact with the website.
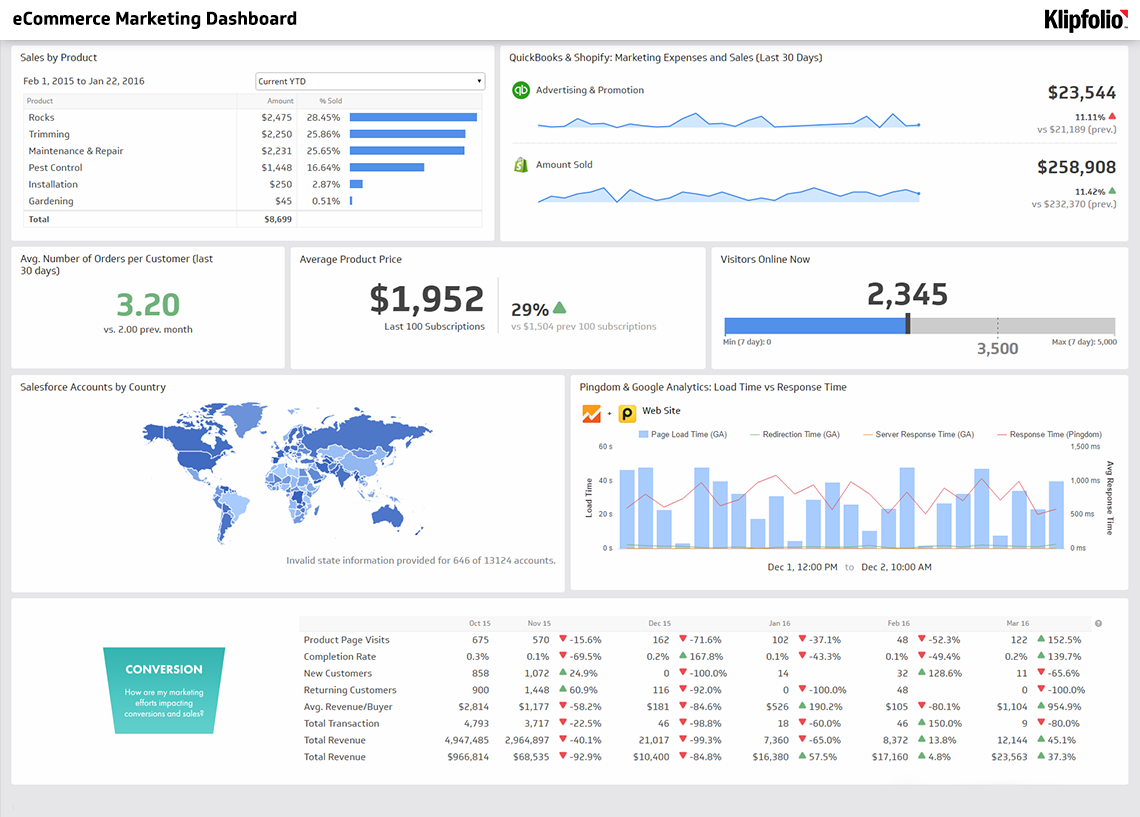
10. E-Commerce Marketing Dashboard
a) What Exactly is it?
This type of dashboard displays the analytics and key performance indicators (KPIs) related to an e-commerce site on an ongoing basis, allowing marketers to make informed decisions about e-commerce marketing methods and budgets.
Marketers will be able to adapt to new trends and keep up with the ever-changing e-commerce marketplace as a result of this.
b) What it is trying to track?
It may track metrics such as return on investment, churn rate, cost per lead, traffic source(s), cart abandonment, conversions, total revenue, and completed transactions.
Conclusion
Marketing dashboards that keep track of your important metrics and key performance indicators (KPIs) are essential for keeping up with your rivals and advertising your company or nonprofit.
The information they provide will assist you in making decisions and allocating budgets, as well as determining if your strategies are effective or not.