Calculated Fields in Google Data Studio

Calculated fields in Google Data Studio let you to manipulate, categorize, and apply mathematical formulas to your information.
Calculated fields can be used to create additional metrics and dimensions based on the data in your database. Data from your data sources can be extended and transformed using calculated fields, which then allows you to view the results in reports.
What are they?
Calculated fields in Google Data Studio assist you in answering questions that would be difficult to answer using only the fields that are offered in the data set on their own. Making use of calculated fields allows you to construct additional metrics and dimensions to help you answer more precise questions you may be asking yourself.
What are they for?
The term "calculated field" refers to a "additional formula that performs some action on one or more other fields in your data source," according to Google. What this means is that data studio allows you to apply computations or functions to data in order to generate additional metrics and dimensions for analysis.
Calculations and mathematics, manipulation of text, dates, and geographic information, and the use of branching logic to evaluate your data and deliver different results are all covered.
Calculated fields in Google Data Studio are classified as follows:
- Formula fields that are specific to a data source schema: When you create a formula field in a data source schema, the field becomes available in any report that uses the data source schema as a source.
- A chart specific calculated field is one that is only available in the chart for which it was made. When you create a chart specific calculated field, it is only available in that chart. You can also utilize the field with a combination of data types.
For example, you might want to calculate the overall revenue value. You multiply the quantity sold field (Quantity) by the unit price field (Price) (Qty Sold).

How do they work?
A calculated field is a formula that interacts with one or more fields in your data source in order to perform an action. If you use calculated fields, you may do arithmetic and math operations on your data, change text, date and geographic data, review your data, and return alternative findings based on branching logic.
In charts that include that field, the output of a computed field can be presented for each row of data, which is useful for displaying trends over time. The manner in which this new information is shown is governed by the manner in which it is utilised.
What are the basic calculations?
You can do simple arithmetic calculations using the normal operators:
- Addition: +
- Subtraction: -
- Division: /
- Multiplication: *
You can create a calculated field by combining any of the operators above with static numeric values and unaggregated numeric fields from your data source to create a calculated field. To force the calculation order, use parentheses.
What are the functions of the Google Data Studio?
When applied to computed fields, Data Studio functions allow for the manipulation and combination of existing fields in more advanced and intricate ways than basic arithmetic allows.
Data Studio functions are similar to formulas in spreadsheet applications such as Microsoft Excel or Google Sheets in that they each have a specified purpose and syntax.
Google categorizes its 64 Data Studio features, which are currently available, into six categories:
- Aggregation (for example: using AVG to compute the average)
- Arithmetic (for example: using ROUND to round numbers)
- Date (for example: using WEEKDAY to return the weekday of a date)
- Geo (for example: using TOCOUNTRY to return country names for ISO codes)
- Text (for example: using CONCAT to concatenate text)
- Miscellaneous (for example: using CASE to return values based on conditional statements)
More calculated field examples
Consolidating Goals
It is common to have multiple goals but, it may be great, to sum up "some" goals to track the business success accurately.
Goal 1 + Goal 2
Merging dimensions
If you need to use 2 (or more) dimensions together then, the CONCAT function is the best formula:
CONCAT(Device Type, Landing Page)
Hate query parameters?
Do you? Personally, I have a problem with query parameters. They break my reports' consistencies and make them look ugly. The below formula will help you to clean your landing page report.
REGEXP_REPLACE(Landing Page, ‘\\?.+’, ”)
Or you can replace Landing Page with page dimensions to clean your all pages report.
REGEXP_REPLACE(page, '\\?.+', '')
5 Calculated field situations which will supercharge your report
Situation 1: How can I re-create my Google Analytics "Custom Channel Groupings" in Google Data Studio after they have been deleted by Google?
Users have the ability to establish "Custom Channel Groupings" in Google Analytics, which allows them to categorize and arrange users based on how they arrived at their website (eg. direct, organic search and etc). The Google Analytics native connector for Data Studio, on the other hand, does not provide those classifications. As a result, you must create them manually using a CASE, which is actually a plus because Data Studio provides significantly more functionality as compared to the "Custom Channel Groupings" feature in Google Analytics.
In this case, you would have to construct a new calculated field at the data source level, just like you would normally. Because the "Custom Channel Groupings" will include a lengthy number of "Source/Medium" attributes, your CASE may become a little congested as a result. There's nothing to worry about because we've already written the code for you, but here are a few pointers to keep in mind:
- When CASE statements are executed, they are executed in a sequential order. Consider the following scenario: if your rule for "Paid Search" is generic, it is possible that it will take up data from "Organic Search" before the specific rule for "Organic Search" has had the opportunity to execute.
- To make things easier to understand, you can employ OR and AND combinations within your CASE. That is something I strongly suggest.
- Always have a contingency plan in place! For example, you may have "Social Source Referral=Yes," but if Google Analytics incorrectly defines your social channel – "l.facebook" – as a "Referral," you will need to rectify this with a regular expression.
CASE
WHEN (Source="(direct)" AND Medium="(none)") OR (Source="(direct)" AND Medium="(not set)") THEN "Direct"
WHEN (Source="google" AND Medium="cpc") OR REGEXP_MATCH(Medium,"(cpc|ppc)") THEN "Paid Search"
WHEN Medium="organic" OR REGEXP_MATCH(Source, ".(^google|baidu|bing).|.(search).") THEN "Organic Search"
WHEN Social Source Referral="Yes" OR REGEXP_MATCH(Source,".(social|fb|facebook|twitter|linkedin|pinterest).") THEN "Social"
WHEN REGEXP_MATCH(Source, ".(mail|outlook).") THEN "E-mail"
WHEN REGEXP_MATCH(Source, ".(youtube).") THEN "Video YouTube"
WHEN Medium="affiliate" THEN "Affiliates"
WHEN (Source="dfa" AND Medium="cpm") OR REGEXP_MATCH(Source,"(display|banner|native|.(doubleclick).)") THEN "Display (Campaign Manager)"
WHEN Medium="referral" THEN "Referral"
ELSE "(Other)"
END
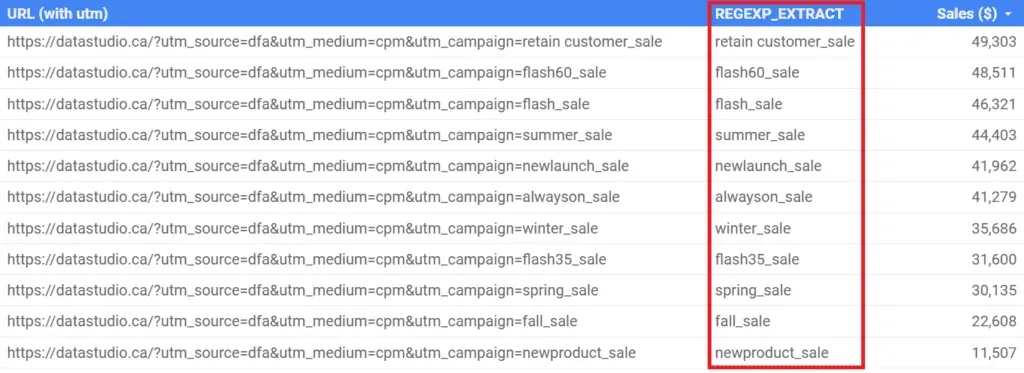
Situation 2: To extract a UTM parameter into a distinct dimension using REGEXP EXTRACT, follow the steps below.
The REGEXP EXTRACT function can save you a lot of time if you have numerous campaigns and want to evaluate how each one is contributing to your business's success. Let us take a look at an example. The URL provided below contains a campaign name that we wish to extract because that portion of the UTM is relevant to us.
https://datastudio.ca/?utm source=dfa&utm medium=cpm&utm campaign=summer sale
This is the situation, and you would be required to write the formula below. Selecting the dimensions from which you wish to extract information – "URL (with utm)" – is the first step. As a result, the regular expression simply states, "beginning with campaign= match everything until you reach another &."
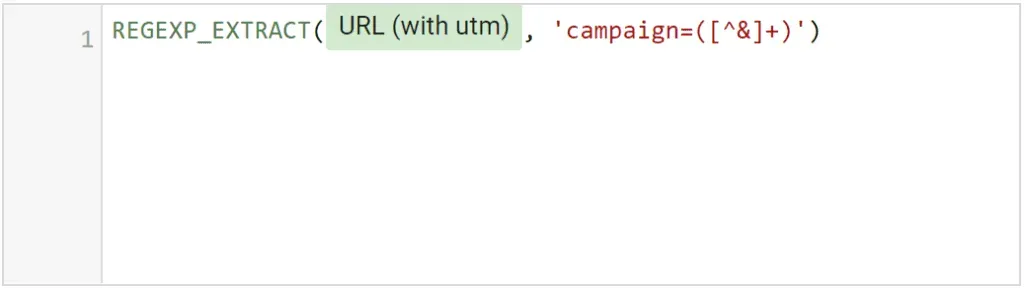
Once you've used the function, you'll see that the outcome is quite impressive. The campaign name has been separated and placed in a separate and far more aesthetically pleasing dimension.
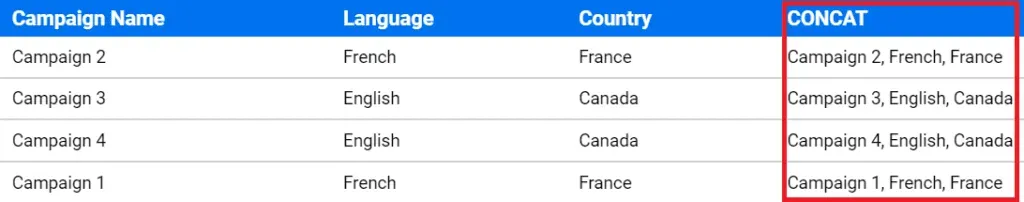
Situation 3: How do you combine dimensions with the help of CONCAT?
The ability to export data from Campaign Manager (CM) or Google Ads might be quite beneficial, especially if you are working with either of these programs. "Naming conventions" are significant for many businesses since they make data parsing easier and allow for more accurate results. The CONCAT function, on the other hand, allows you to combine a number of previously created fields into a single, more powerful dimension. The way it works is as follows:
Fortunately, the function has a straightforward syntax. Firstly, you type your first dimension, which in this example is "Campaign Name," followed by a delimiter character. When separating dimensions from one another, the delimiter determines how the dimensions will be divided. The delimiters "|" (pipe) and "," are two of the most commonly used (comma).

As a result, a more compact and informative dimension is created by combining all three components into a single dimension. Remember that you can include as many dimensions as you wish, as long as the final field is relevant to you at the time of creation.
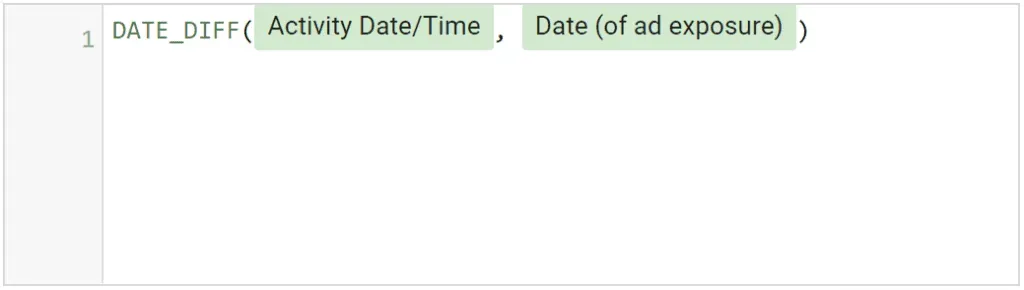
Scenario 4: How do you calculate the difference between two dates using DATE_DIFF?
For those of you who work with SQL on a regular basis, this will be a familiar scenario. When two date/time data are compared, the function returns the difference between them in a numeric format. The usage of paid media for eCommerce is an interesting case in which I found this feature to be useful. We frequently examine the time between when a user was exposed to an advertisement and when he or she actually made a purchase. This provides us with a feeling of what we would refer to as "time-lag," which suggests that the user requires some time to consider their options before making a purchase. This is precisely where the DATE DIFF function comes into play.
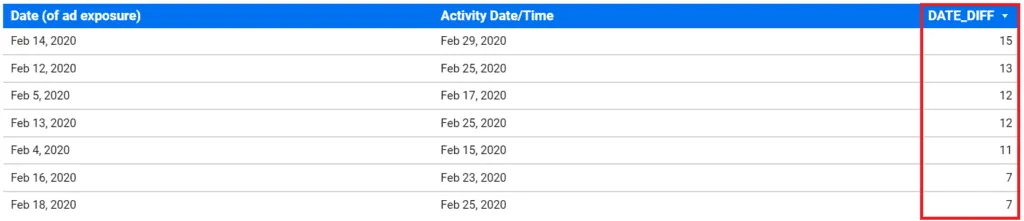
Date-based comparison table with the DATE DIFF function and date columns
The calculation is straightforward; all that is required is that you include the two date fields that must be removed from the total.
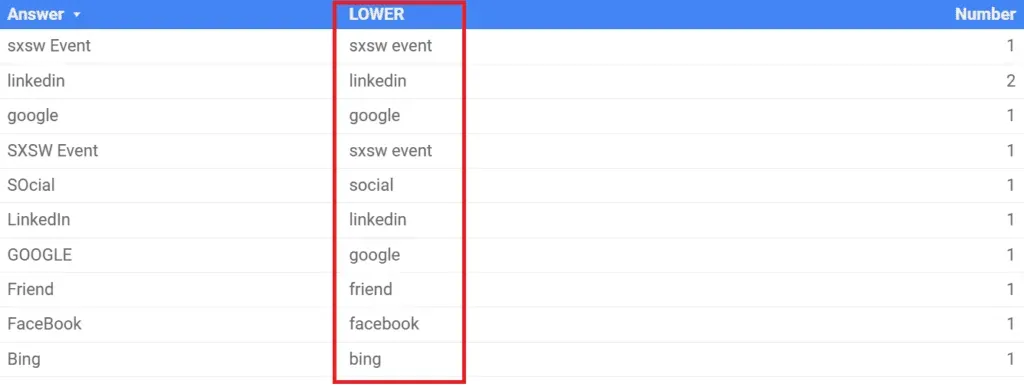
Scenario 5: Is it possible to normalize text strings by using the LOWER and UPPER functions?
Finally, but certainly not least, this function allows you to normalize the size of your text. Consider the following scenario: you have an online form on your website that includes a free-form input area that asks "How did you learn about us?" and the input field is free-form in nature. Because the user may enter any type of capitalization, we may use the LOWER keyword to clean up the mess.
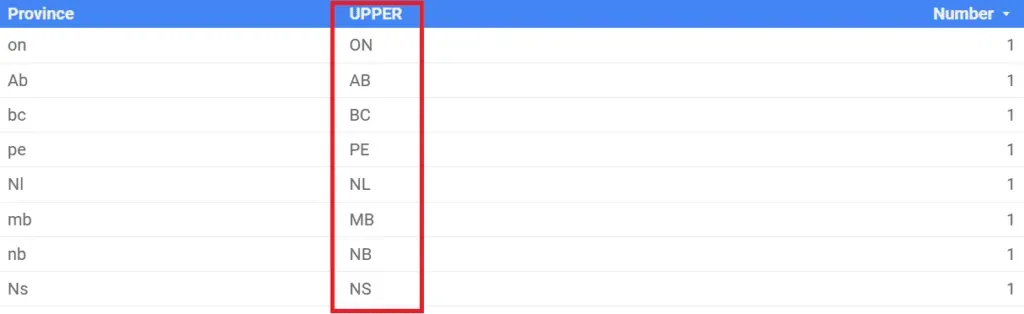
A similar function, UPPER, can be used to convert all provinces to their normal uppercase acronyms, which can be found in the table below.
We hope you found this information useful and that you are now able to use all of the Data Studio methods in your own projects!


![Working with Google Data Studio Filter [Guide]](/content/images/size/w720/2022/02/Filters.svg)

