How to Blend Data in Google Data Studio? [2022 Updated]
![How to Blend Data in Google Data Studio? [2022 Updated]](/content/images/size/w1200/2022/02/Data-blending-1.svg)
Data Blending is one of the marvels of Google Data Studio. This function helps you join information from multiple sources and gives you a unified view.
There's no need to learn new software or master additional query languages to get the insights you need.
By default, charts in Data Studio get their information from a single data source. The term "blended data source" refers to a graphic that is created using data from many different sources.
Examples:
- Google Analytics data from both your app and website can be combined into a single visual representation.
- You can blend Google Ads and Facebook Ads data into one blended data source and you can see combined ad impressions, clicks and more.
Blending can reveal valuable relationships between your data sets. Making blended charts directly in Data Studio saves you time and effort by eliminating the need to alter your data first in other apps.
Blending data in Data Studio has always been a great function of data analysts. But there were some issues and some room for development, nothing is perfect. However, Google released an update in February 2022 with many upgrades and some bug fixes.
Why it is useful?
The amount of data available in any business is increasing. Blending data sources can enable you to discover insights faster and use that information to make better decisions.
💡Data blending is typically used for ad hoc reporting and rapid analysis.
Data blending tools let non-technical users do things they couldn't before. In marketing departments, for example, data from their CRM system and a spreadsheet may simply be combined with data on product profitability.
Advantages of data blending
- Rapid analysis
- Fewer data silos
- Greater efficiency
- No need to rely on data scientists
- More revenue (as a bi-product of efficient evaluation of your data)
What's new in the February 2022 update?
New additional joint connections
In the blend, you can now specify different join conditions between pairs of tables. Previously, every table had to include the same join condition.
More join operators
You can now use the following join operators when configuring the blend:
- Inner join - Returns only matching rows from the left and right tables.
- Left outer join - Returns matching rows from the right table, plus non-matching rows from the left table.
- Right outer join - Returns matching rows from the left tables, plus non-matching rows from the right table.
- Full outer join - Returns all matching rows from the left table or the right table.
- Cross join - Returns every possible combination of rows from the left and right tables.
Before we could only use left outer join and this was causing many limitations.
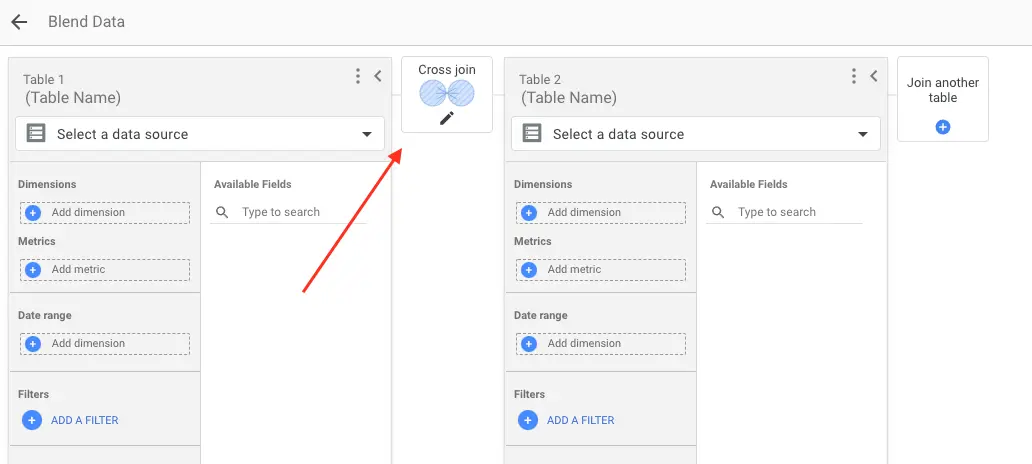
User experience
The looks of the blend editor also changed. We’ll now see a join configuration linking each table in the blend. Click the join configuration to edit the join condition and join operator.
Terminology
Terms used in the blend editor or related to data blending have changed too.
| Old | New | Notes |
|---|---|---|
| Blended data source | Blend | A blend has always differed from standard data sources in several ways. |
| Data source (in the blend) | Table | Data sources are actually just tables of data. These new terms make this clearer. |
| Join key | Join condition | A join condition determines which rows in a pair of tables are considered to be matching."Join condition" is an industry standard term and more accurately reflects the functionality. |
| (none) | Join operator | A join operator specifies how the matching and non-matching rows of the tables are combined. This is a new term introduced in this release. |
| (none) | Join configuration | A join configuration consists of the join conditions and join operator for a given pair of tables in the blend. This is a new term introduced in this release. |
How to Blend Data in Google Data Studio?
Database programmers use SQL join statements to blend data from different tables. In Data Studio, you can blend data without writing a SQL statement. You can use the blend editor dialogue box to configure the join. The dialogue box is shown in the following screenshot:
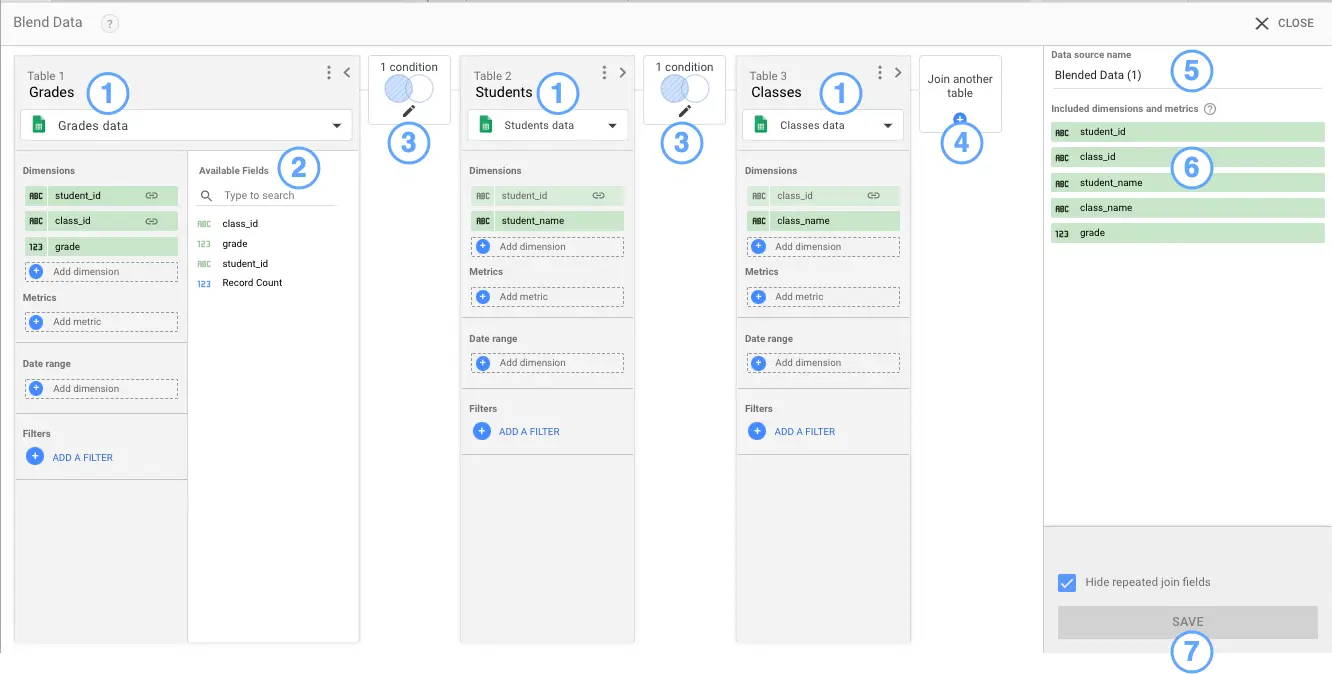
Here is the legend:
- Tables (old - data sources)
- Fields list
- Join configuration
- Join another table
- Blend name
- Included fields list
- Save button
Tables
Tables create blends. While creating or editing blends, we see its tables displayed on the page. Each table contains a set of fields extracted from the underlying data source. A blend can have up to 5 tables.
- To add data to a table, open the Available Fields list by clicking the right icon. (>)
- Fields used in join conditions are shown with a link icon used to show fields in a join condition (🔗 )
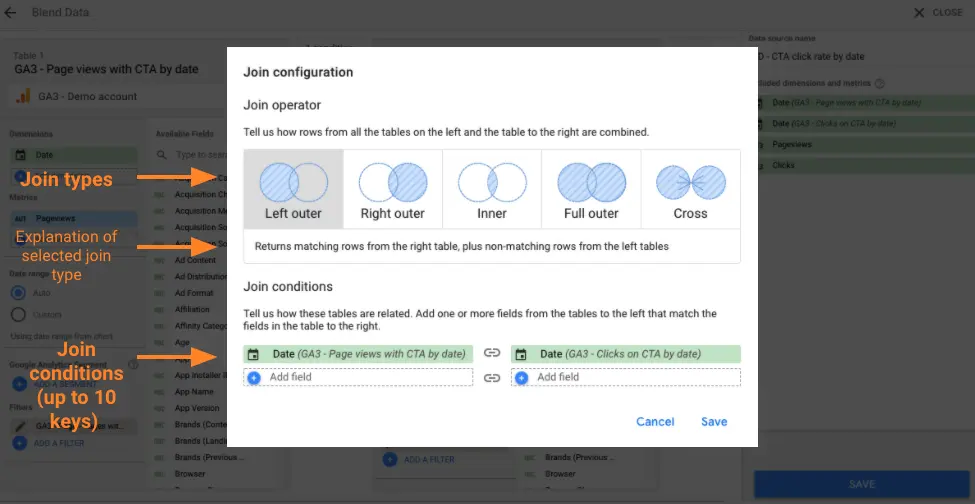
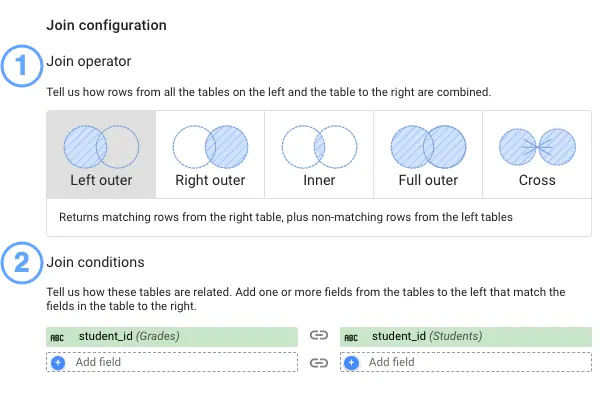
Join configuration
We link tables in blend with join configuration. A join configuration consists of an operator and a condition.
Operator defines how to combine matching and non-matching records from those tables. Condition is a set of fields that defines how the tables are related to each other.
For example, in the following screenshot, the Grades table joins to the Students table on the student_id field, and to the Classes table on the class_id field. Both join configurations use the left outer operator.
What are Join operators?
The join operator determines how the matching and non-matching rows from the tables in the blend are joined together.
| Inner join | Returns only matching rows from the left and right tables. |
|---|---|
| Left outer join | Google Data Studio left join returns matching rows from the right table, plus non-matching rows from the left tables. |
| Right outer join | Returns matching rows from the left tables, plus non-matching rows from the right table. |
| Full outer join | Returns all matching rows from the left table or the right table. |
| Cross join | Returns every possible combination of rows from the left and right tables. |
Conclusion
Data blending is one of the least popular functions in Google Data Studio and is sometimes overlooked. However, if we pay close attention to it, we can open new opportunities. Once we are out of existing tables (data sources) we can blend any table from any source.
The more data visualized, it can be analyzed better and executive staff can make better business decisions.


![Working with Google Data Studio Filter [Guide]](/content/images/size/w720/2022/02/Filters.svg)

