7 Amazing Google Data Studio Controls You Use Today

You want to include only the necessary data, while keeping your Google Data Studio dashboard clean and uncluttered.
At the same time, you want to ensure that all your metrics are included in your report.
With Google Data Studio's filters, you can rest assured that only the information you want is included in your dashboard.
Filters refine or reduce the data in your reports. This allows you to concentrate on the information that is most relevant to your need. Using the DATA properties tab, you can apply a filter to a chart, control, page, or the full report.
7 Amazing Controls You Can Use
The controls menus are divided into 2 sections:
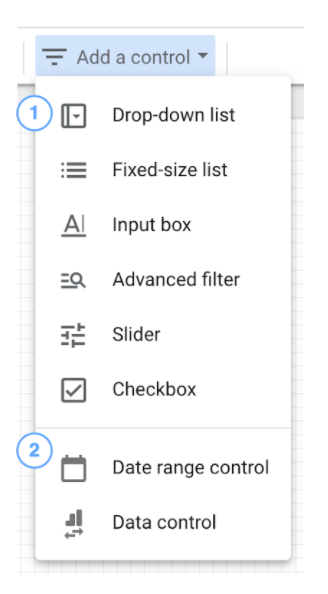
The controls in the second section have specific functionality and cannot be used to change parameter values.
Drop-down list and Fixed-size lists
These controls present the viewer with a menu of alternatives from which to choose. The values in a dimension or a list of permitted values defined for a parameter can both be used to generate the list.
Input box
Input boxes let the viewer enter a value. When the control is used as a filter, you can specify how it compares the user's input to the dimension values. The input box can accept any value, values from a list, or a range of values when used as a parameter input.
Advanced filter
Advanced filters are similar to input boxes, but they can only be used as filters. Advanced filters can't set parameter values.
Slider
Slider controls allow users to pick a single value from a numeric parameter or filter by a range of values in a numeric dimension.
Checkbox
Viewers can filter by a Boolean dimension or change the value of a Boolean parameter using checkbox controls.
Date range control
The date range control is a custom calendar widget that allows your readers to adjust the report's time window.
Data control
Viewers can modify the underlying data set to which a data source relates using the data control. This enables sharing reports with viewers who want to utilize the report with their own data a breeze. Using a data control, you can avoid having to write individual reports for each customer or consumer.
Filter Types
There are 2 types of filters:
- Include filters only return records that meet the criteria.
- Only records that DON'T match the conditions are returned by exclude filters.
💡 Filters do not change your raw data, they just change the view scope.
Filter conditions and operators are clauses that help you construct complicated filters with logic. Here is the list of conditions and operators: link
💡 Filters can be applied to dimensions, metrics, or both.
Filter Control lets viewers apply filters and set parameter values. The date is one of the most popular filters and you check about this here.
Controls let viewers manipulate the data shown in a Data Studio report in the following ways:
- The report's time frame is determined by the viewers.
- Viewers can change parameter values, which can then be used in computed fields or returned to the connection.
- A data source's underlying data set can be changed by viewers.
How to add a control to a report?
- Edit the report.
- Select Add a control in the toolbar.
- Select the control type, afterwards position it on your page.
- Use the options in the Properties panel, on the right, to configure the control.
- To filter the report by selected dimension values, use a dimension for the Control field.
- To set the value of a parameter, use that parameter as the Control field.
Here is an example of adding a control field with country selection;
How to add a new filter to a group?
- Select reports which will have the same filter
- Click on the right mouse button → "Group"
- On the right menu, navigate to the "Filter" section
- Click +Add a filter
Click CREATE NEW FILTER.
How can we reuse an existing filter?
- Name the filter.
- Select Include or Exclude. Filters that only include data that matches the expression you enter are included. All data that matches the expression is removed by exclude filters.
- Select the dimension or metric by which to filter.
- Select the comparison operator (e.g. Equals, Contains, Greater than, **etc.**).
- Provide a comparison value for the expression.
- (Optional) To add an OR clause, click OR on the right of the condition.
- (Optional) To add an AND clause, click AND below the clause.
- Click SAVE.
How to add a filter to the entire report?
- Select File → Report Settings
- On the right menu, navigate to the "Filter" section
- Click +Add a filter
Click CREATE NEW FILTER.
You can also reuse an existing filter
- Name the filter.
- Select Include or Exclude.Only data that fits the expression you supply is included in the include filters. All data that matches the expression is removed by exclude filters.
- Select the dimension or metric by which to filter.
- Select the comparison operator (e.g. Equals, Contains, Greater than, **etc.**).
- Provide a comparison value for the expression.
- (Optional) To add an OR clause, click OR on the right of the condition.
- (Optional) To add an AND clause, click AND below the clause.
- Click SAVE.
How to add a filter to the page?
- Select **Page → Current Page Settings ****menu
- Select DATA tab
- On the right menu, navigate to the "Filter" section
- Click +Add a filter
Click CREATE NEW FILTER.
You can also reuse an existing filter
- Name the filter.
- Select Include or Exclude. Include filters include only data that matches the expression you provide. Exclude filters remove all data that matches the expression.
- Select the dimension or metric by which to filter.
- Select the comparison operator (e.g. Equals, Contains, Greater than, **etc.**).
- Provide a comparison value for the expression.
- (Optional) To add an OR clause, click OR on the right of the condition.
- (Optional) To add an AND clause, click AND below the clause.
- Click SAVE.
How to add a filter to the chart?
- Edit your report.
- Select the chart or control you want to filter. You can also filter a group of charts and/or controls.
- Select the DATA tab in the Properties panel.
- Click +Add a filter.
Click CREATE NEW FILTER.
You can also reuse an existing filter
- Name the filter.
- Select Include or Exclude. Include filters include only data that matches the expression you provide. Exclude filters remove all data that matches the expression.
- Select the dimension or metric by which to filter.
- Select the comparison operator (e.g. Equals, Contains, Greater than, **etc.**).
- Provide a comparison value for the expression.
- (Optional) To add an OR clause, click OR on the right of the condition.
- (Optional) To add an AND clause, click AND below the clause.
- Click SAVE.
Here we are adding a filter to reduce the scope of the countries into only United States OR India.


