Google Analytics Product Analyser Data Studio Template

If you have or manage a client's e-commerce store and looking for a dashboard that helps you to find out your merchandising performance? You are in the right place.
This is the best dashboard template if you want to see the trend of each brand, category, or product. You'll have the best-selling and rising star products in one dashboard.
If you prefer watching videos instead of reading loooong articles then, the following link definitely will help you.

Prerequisites to use this dashboard
This is the product analyzer Google Data Studio dashboard template. There will be a few requirements to use this dashboard:
- You should have a Gmail account connected to a Google Analytics account already.
- You should implement Google Analytics Enhanced Ecommerce in your store to use the full power of this Google Data Studio template.
Have both? Let's start our tour then.
Tables
This Google Data Studio template contains 2 main parts; tables and graphs. We'll start with tables that give us details and also have filter functionality.
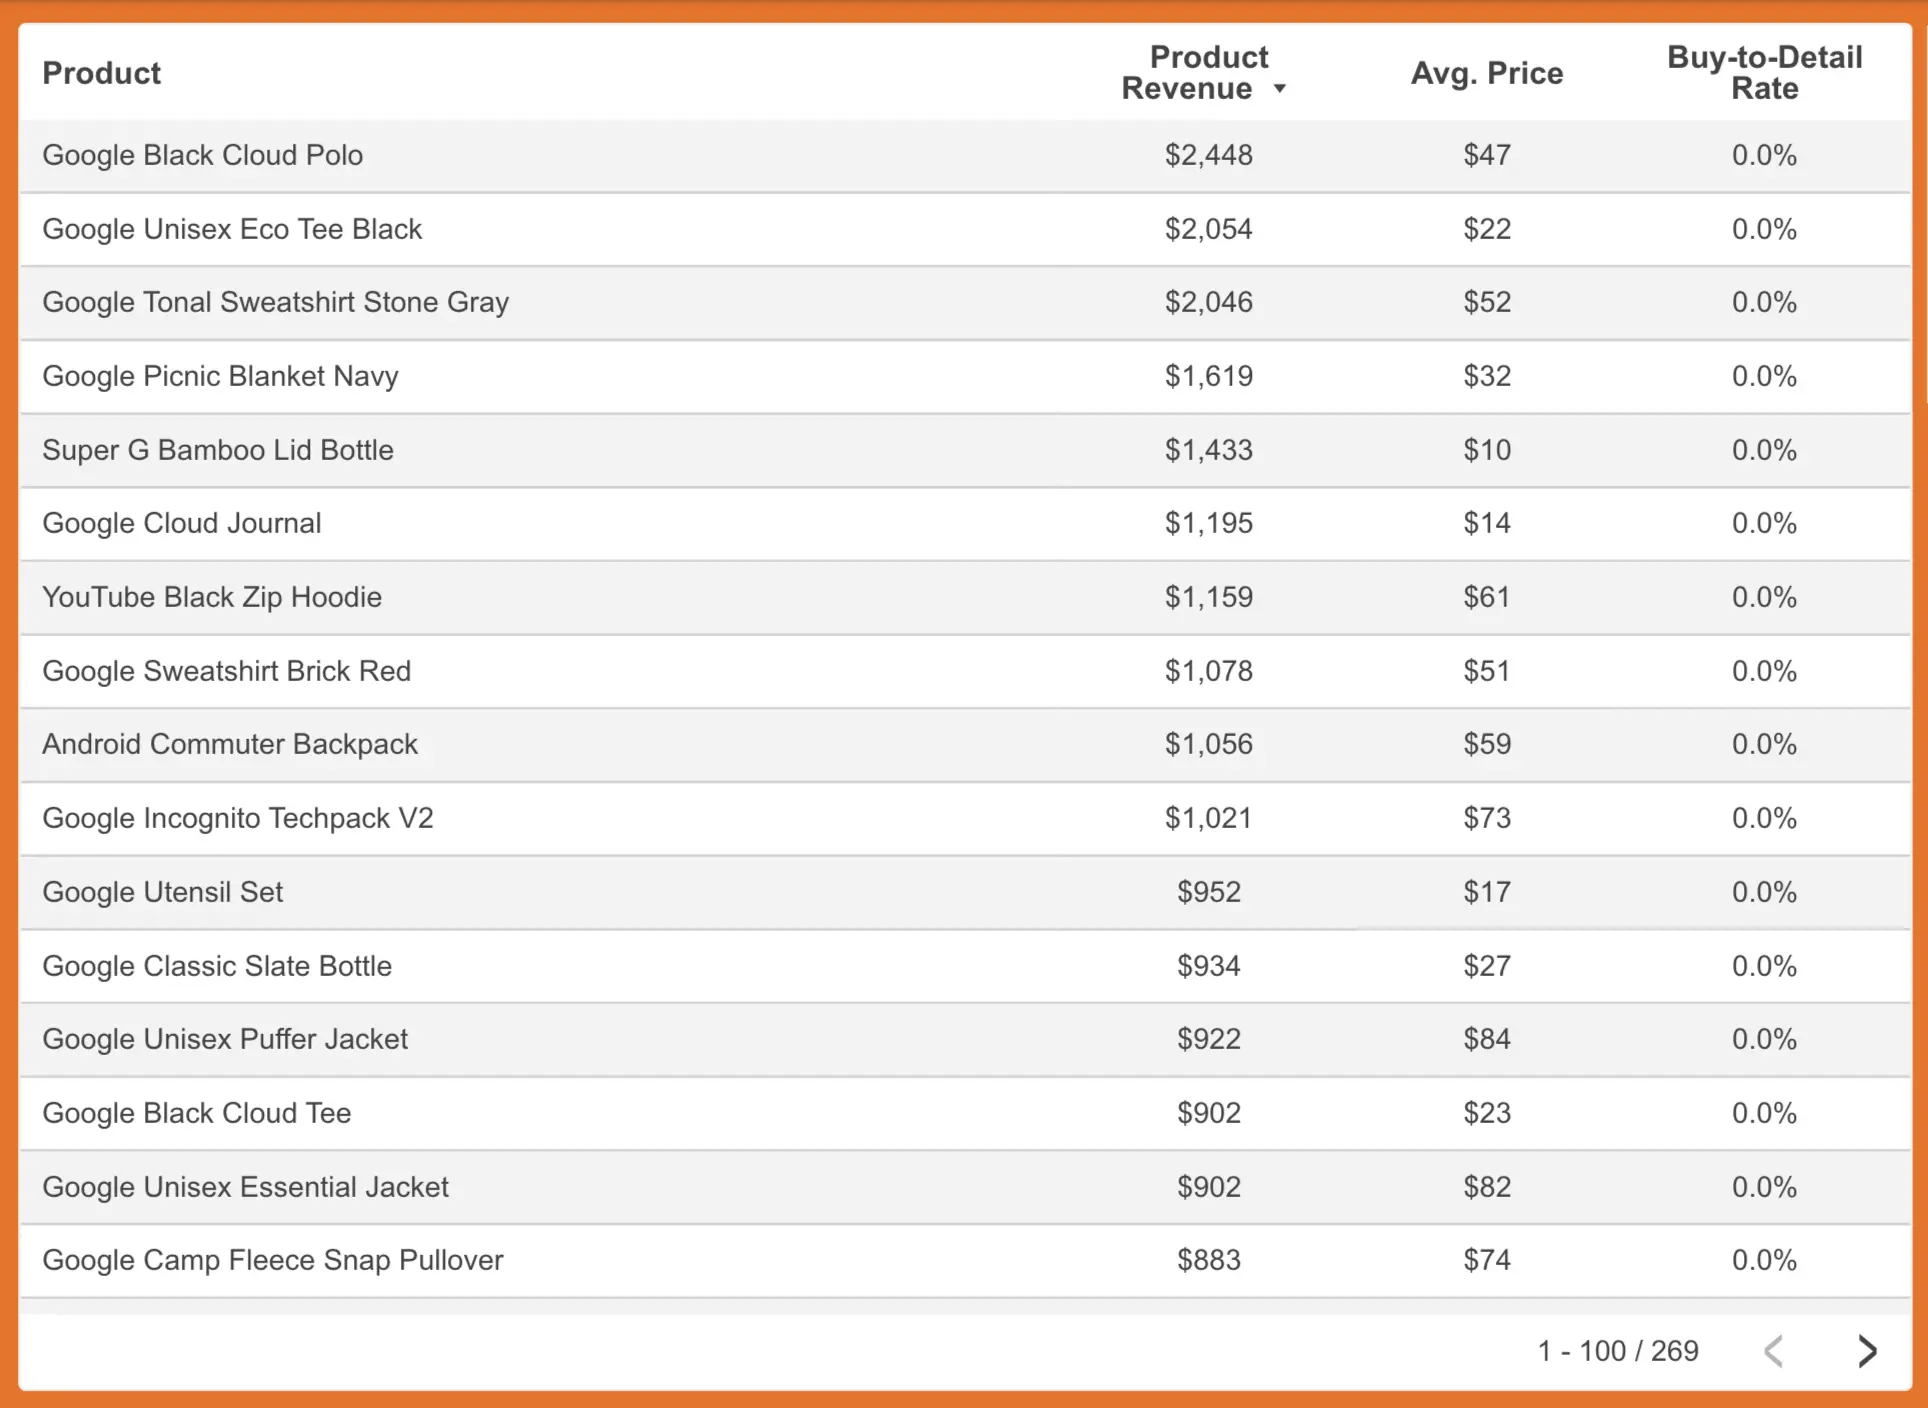
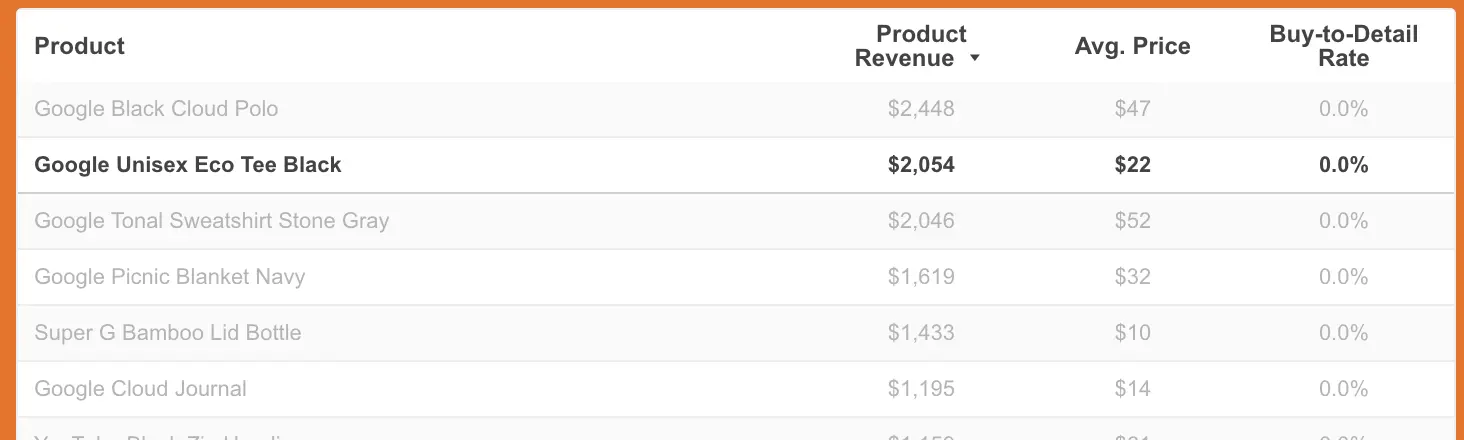
Product table
The first table will be our main one. It contains the most sold products of your business alongside 2 more important metrics:
- Avg. Price: Show the gross income per product sale
- Buy-to-detail rate: Describes the conversion rate of product sales divided by product detail views. (The below table shows zero because of Google itself didn't implement Enhanced Ecommerce to their sample store :) )
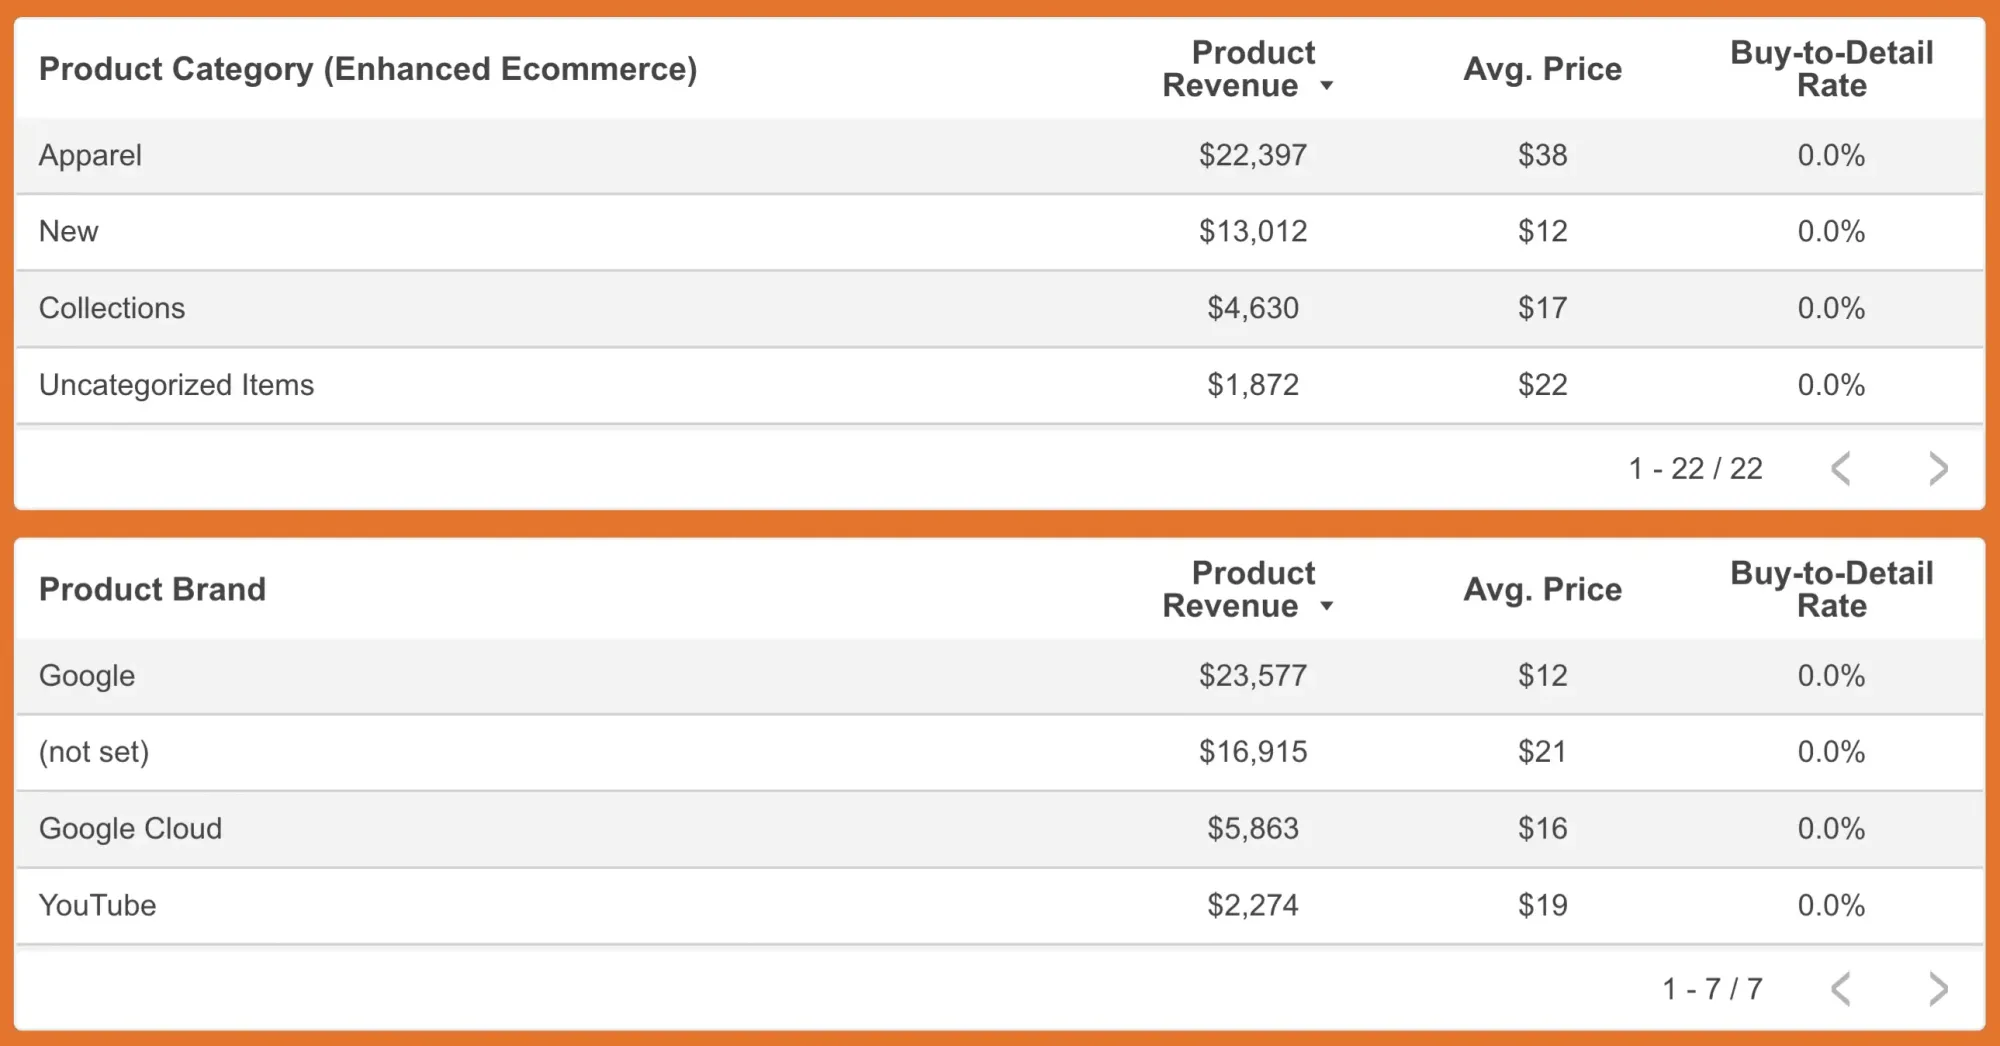
Product Category and Brand tables
We have 2 more tables and the name of these tables are self-explanatory I believe; Product Category and Product Brand.
Please don't forget to implement Google Analytics Enhanced E-commerce before using this dashboard. Otherwise, you may not see data on the dashboard.
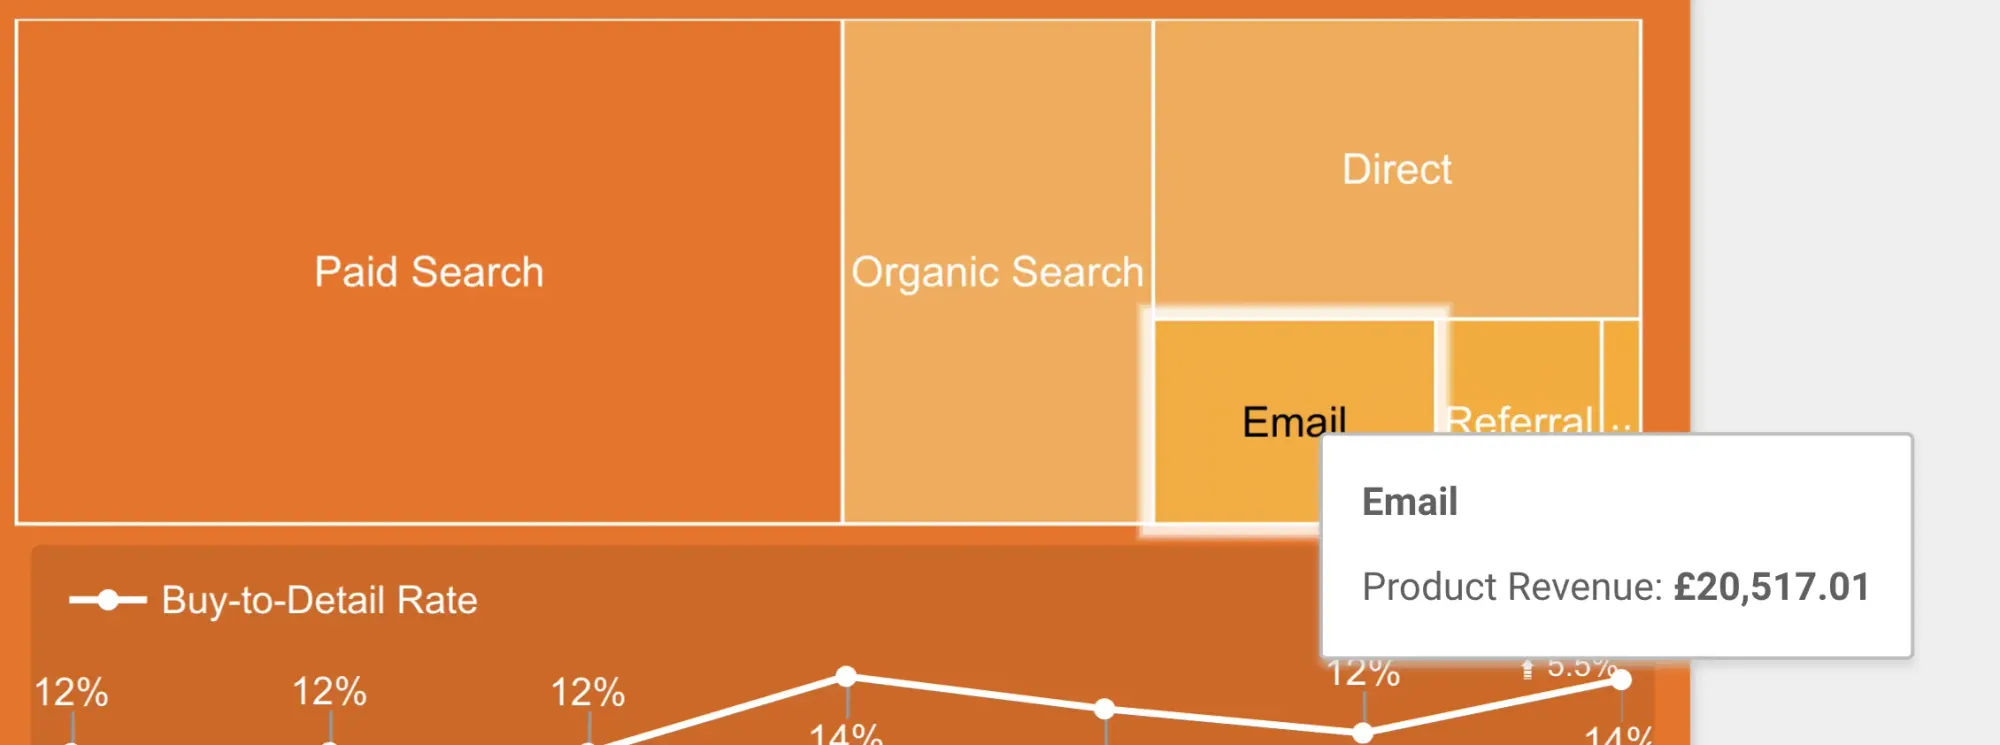
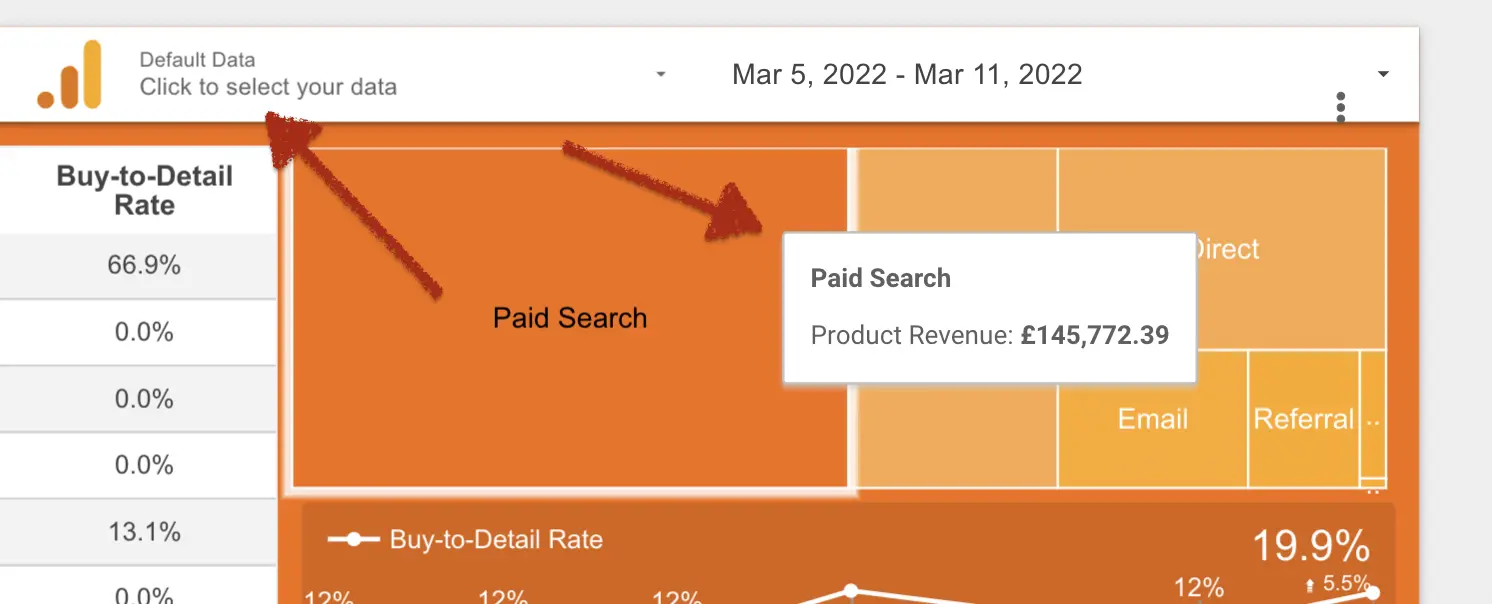
Traffic source overview
This is a visual part of the traffic source of your product revenue. If a rectangle is darker and bigger then, you have more revenue from this traffic source.
I like seeing this part of this Google Data Studio template while I'm zapping between products or product categories. Some products may be really powerful on organic traffic but, we may not notice them for performance marketing campaigns.
Just stare here whenever you filter your dashboard by a product.
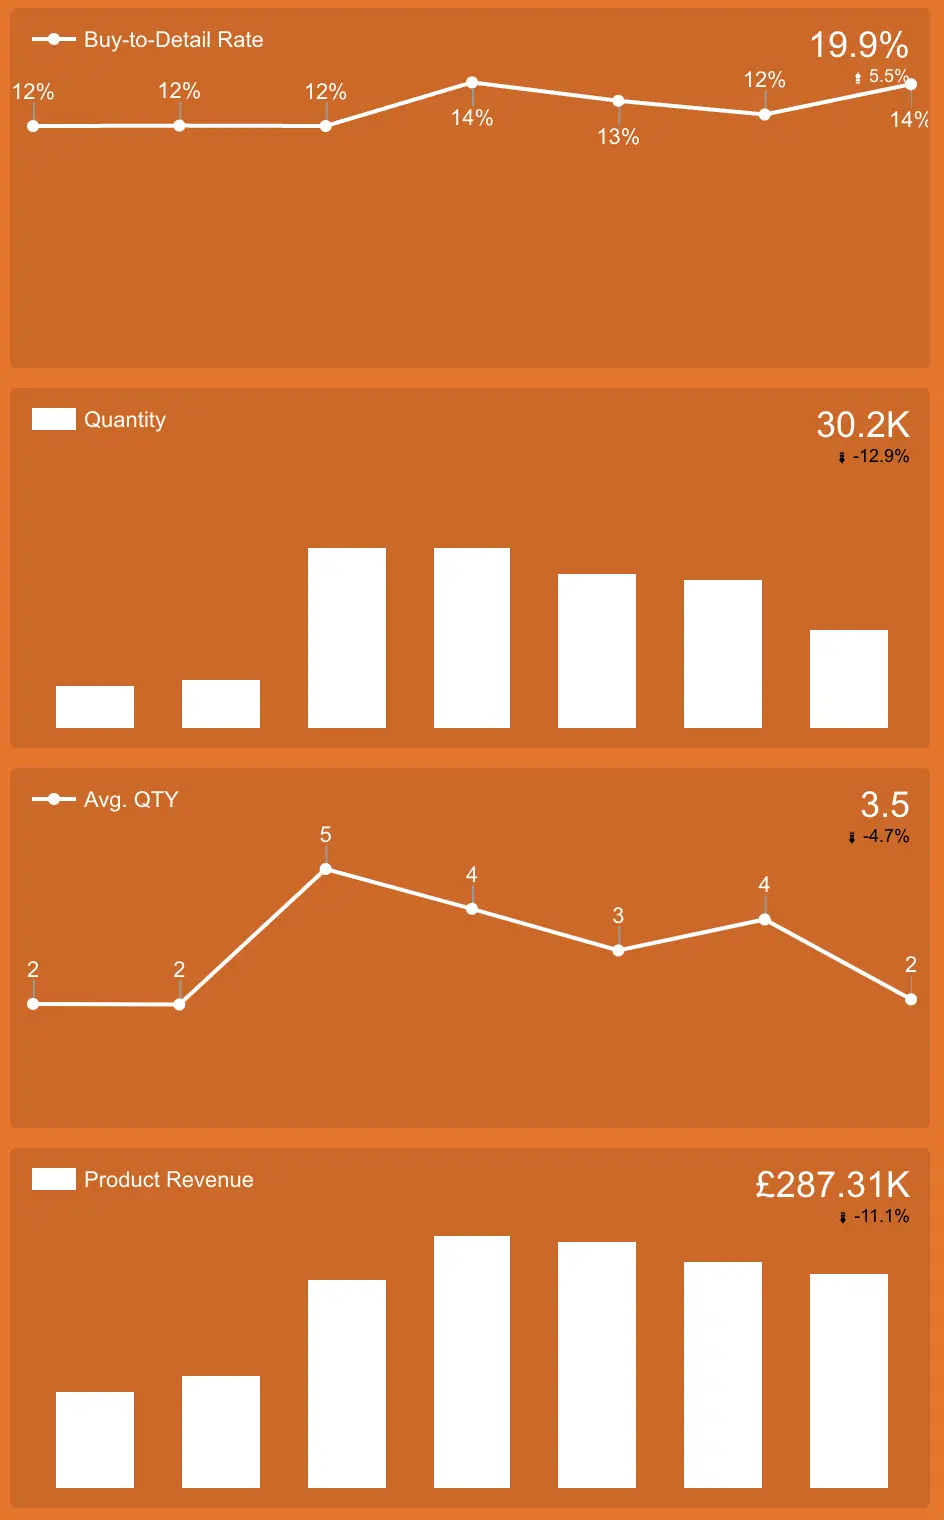
Trend column/analysis
I always want to see data in a trend chart. Think about you have better sales in the last week compared with the previous week:
- If you only compare weeks then, you can say that you have a great week.
- But, if you look at the trend then, you may notice that the first few days of the last week was great but, the rest is not. So, the question will be what happened then? See!
Because the above case has happened a lot to me, I always look at trend charts and put these charts on this Google Data Studio template.
How to filter this Google Data Studio template?
We have 3 options:
Filters using tables
I'm using this function for ages but, I'm feeling fascinated every time I use this feature. Do you want to see more details for a product or category? Just click on it and the Google Data Studio template will filter the page by your selection.
You will see the traffic source the above and the most important e-commerce metrics on the right side just for this selection. Isn't it wonderful?
Filters using treemap
Another filtering option is to use the top right treemap. Click on a traffic source and the dashboard will show you the top-selling products by your filtered traffic source.
If you select a category after this, you should access the top-selling products for your filtered category from your selected traffic source.
Filters using dropdown
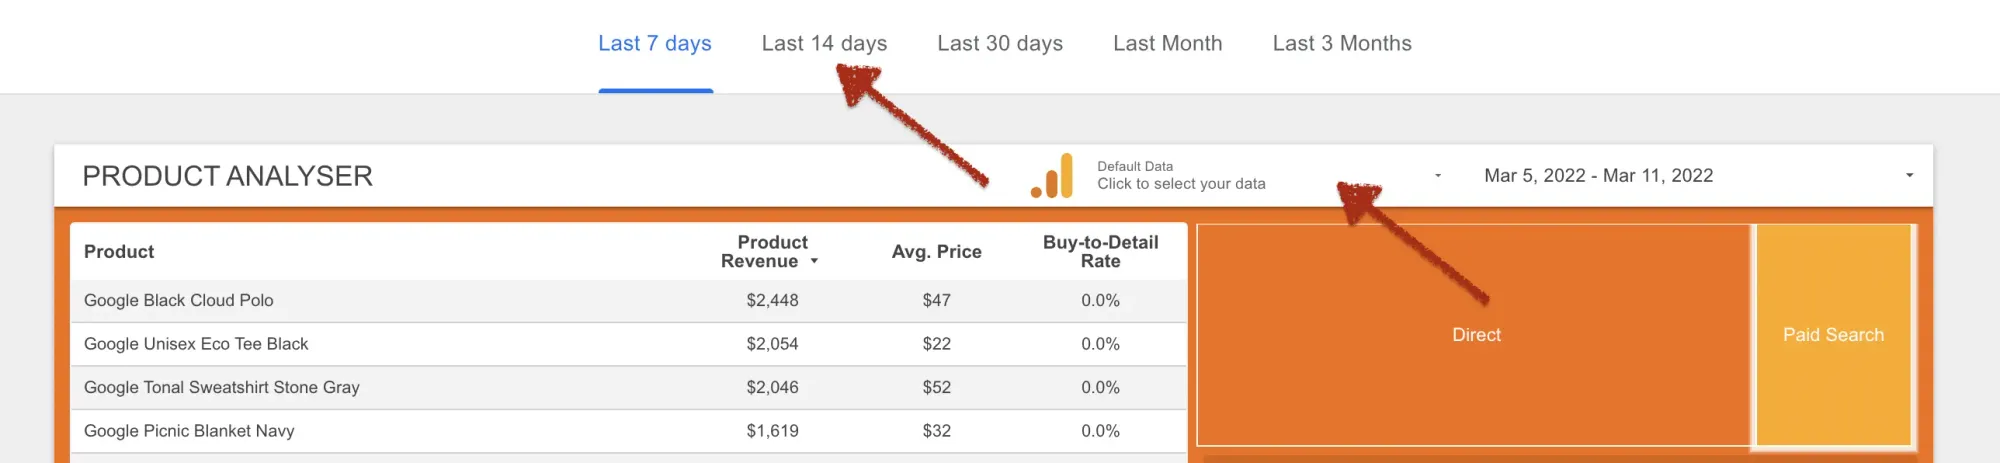
This is the last option and is limited to the data source and date selection. But, data source selection (you can see it above screenshot) will unlock the dashboard to give multiple clients' data without copying it for each.
Also, you can click the above tabs to change the date span. The last 3 months of data contain weekly trend charts that allow you to see smoother trend graphs.
How to change the data source?
After duplication, you will see Google Analytics accounts in this part. Just select one and see the data for that account.
Easy, isn't it? This is why I'm using the Google Data Studio template because it has native links with other Google products.
How to purchase this template?
If you need a custom made dashboard then, please reach us through the contact page, if you prefer to purchase the template and edit by yourself please check one of the options below.
Through Fiverr
If you have a Fiverr account and like to proceed through here then, please follow this link to access our Fiverr account page.
Through Etsy
We are putting these templates on our Etsy page, too. Here is the link to the store in case you have an Etsy account and prefer to proceed through this platform.
You may think why all of these dashboards cost so little. Because you caught me in the phase of learning how to sell digital products rather than my hours. So, enjoy your templates, and let me know if you have any feedback for them.
Subscribe to the lifetime plan
We are offering lifetime access for current and all future templates. Also, you'll have a template request option without extra cost if the template gallery hasn't included it yet.
Click here for details: https://northstaranalytics.co.uk/membership/
How to copy this dashboard?
We have been created content about duplicating Google related dashboards here.