Google Analytics Revenue Drivers Data Studio Template

The origin of NorthStar Analytics comes from "the NorthStar Metric" which is the ultimate metric that the business should optimise. Revenue drivers are the sub-metrics to make the top KPI better. They are all part of the formula of the NorthStar metric.
Take "conversion rate" as an example. It contains 5 sub-metrics at least:
- Bounce rate: The percentage of all sessions on your site in which users viewed only a single page.
- % Detail: How percentage of the above visits contains at least one product detail view?
- % Add to cart: Does looking at the product page end with adding to cart of that product? If yes, what percentage?
- % Checkout funnel: This is the classic e-commerce checkout funnel steps.
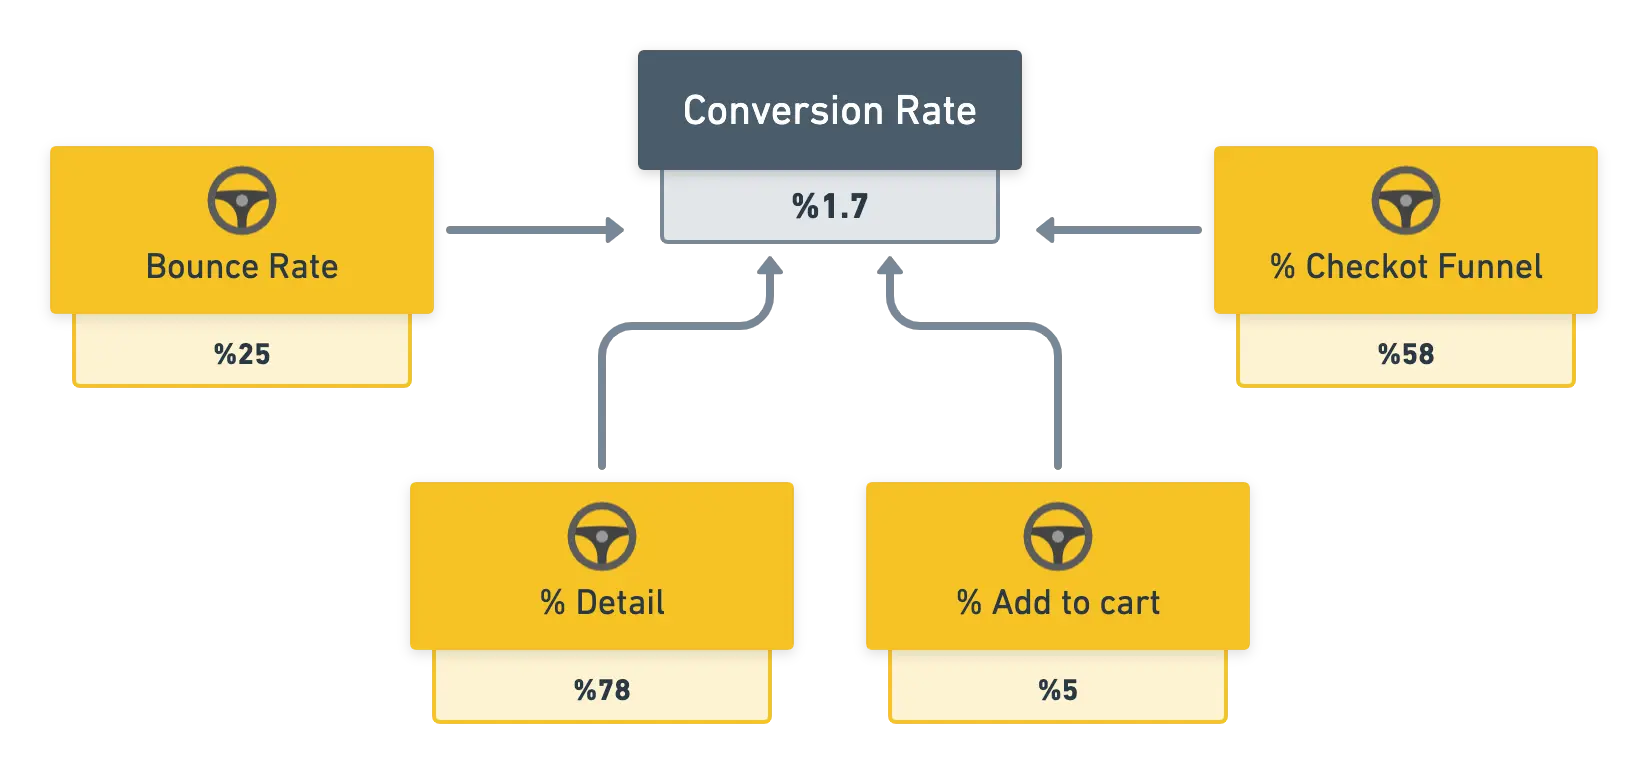
We need to optimise each sub metric of the above graph to increase the conversion rate. This is the simple methodology of the "drivers". They drive the top KPI to a better place.
This Google Data Studio template will give you an idea of how your e-commerce products are performing and how sub-metrics are doing their jobs in this process.
If you don't like to read a long article you can click the below link to watch the video. If you are still with me, let's look the details.

Prerequisites to use this dashboard
First of all, we need some requirements to use this Google Data Studio dashboard template:
- You should have a Gmail account connected to a Google Analytics account already.
- You should implement Google Analytics Enhanced Ecommerce in your store to use the full power of this Google Data Studio template.
Have both? Let's start our tour then.
Who can use this dashboard?
It is ok to have an analyst or a business owner who only use dashboards to "sense" the business. We have created 2 pages to cover these 2 personas.
Business Owners
If your main focus is to find quick fixes or to be sure that the business is headed towards the bottom then, this page will be for you.
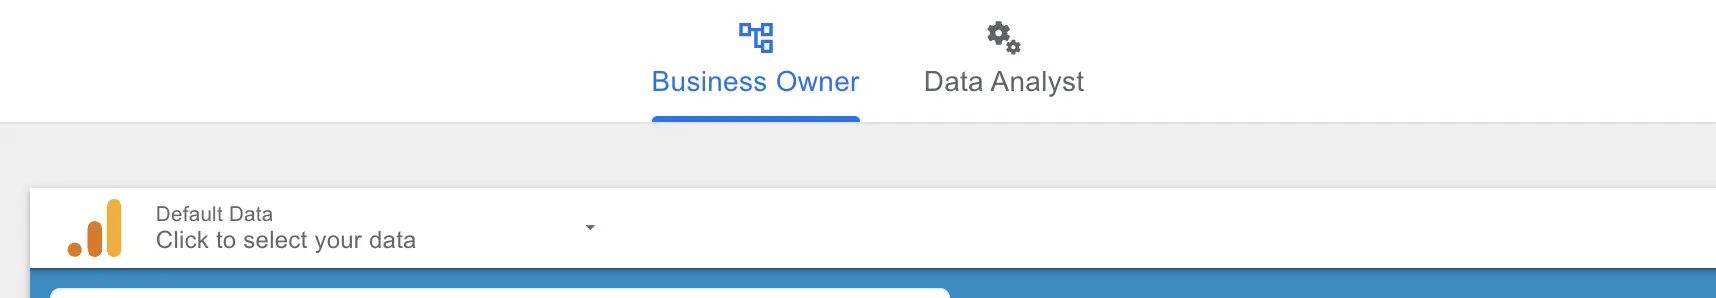
Data Analysts
If you like playing with data, see the whole funnel and most importantly if you have time to dig then you should use this page to have more details on revenue drivers that push your products to higher or lower revenue
How should you use this dashboard?
Well, this Google Data Studio template gives the power of underlying trends which cannot be seen on Google Analytics reports easily. I mean, everything is there but, this is just a different perspective.
The first place to look at
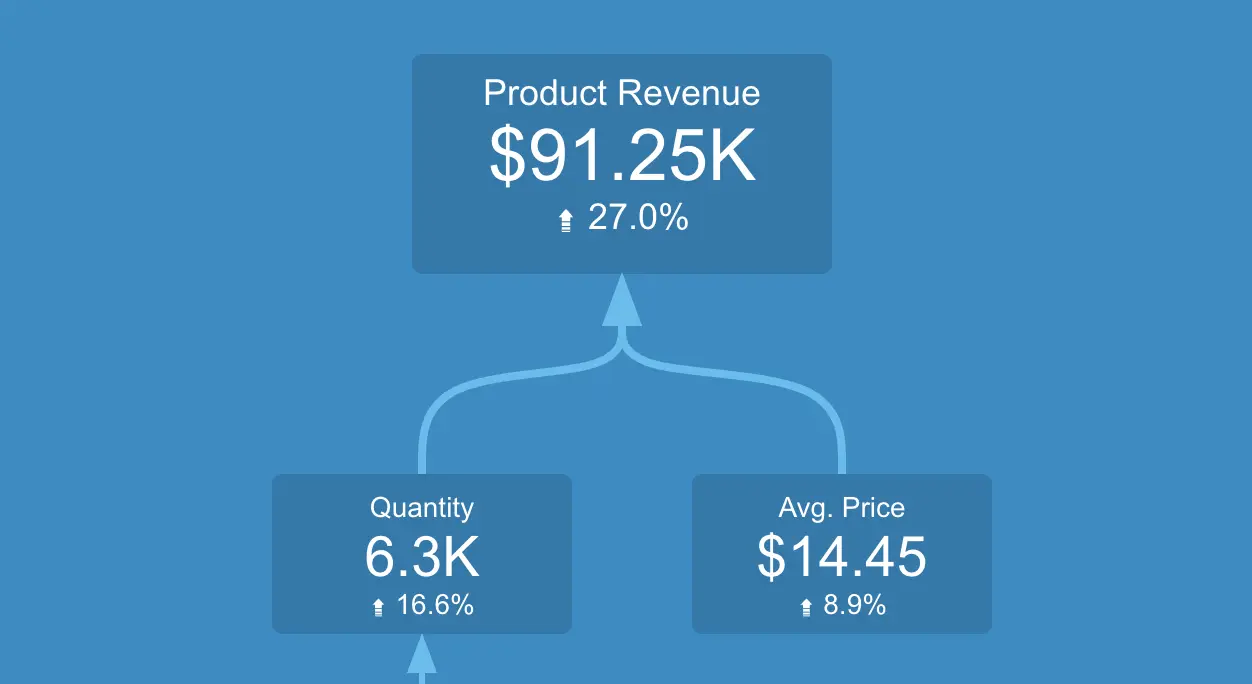
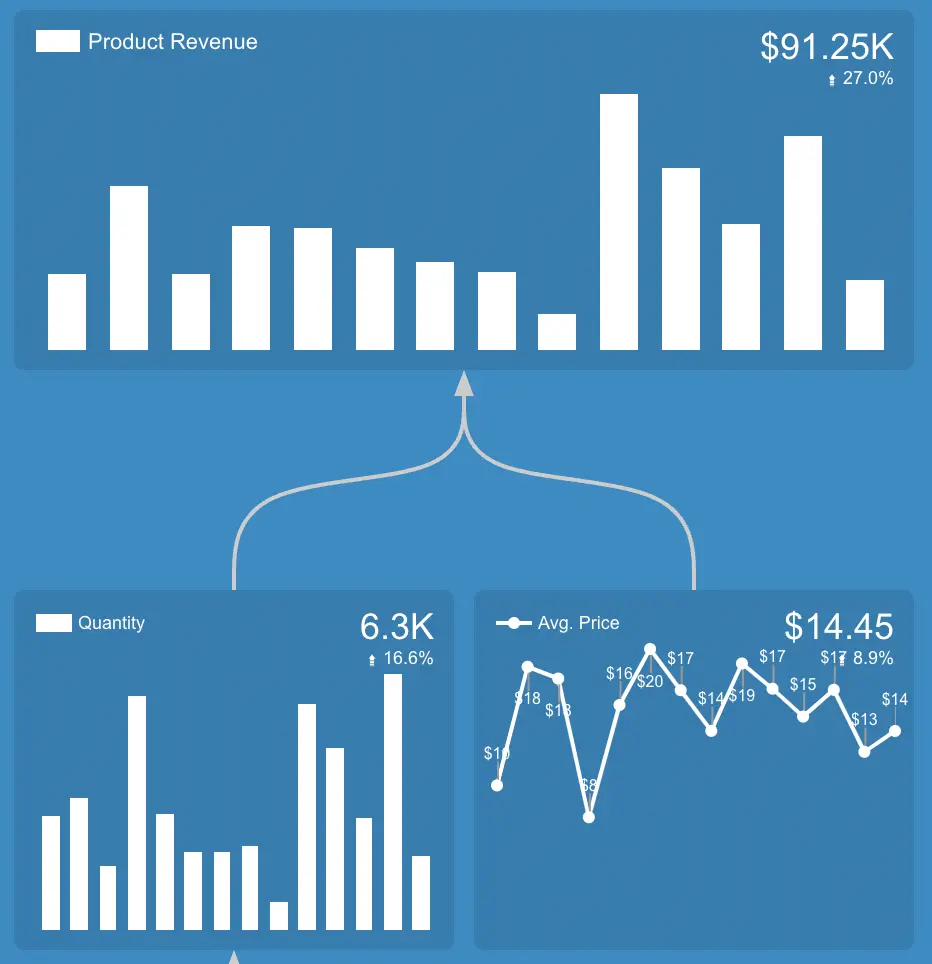
I always start with the "Business Owner" part. If I see a problem then, I switch the the "Data Analyst" tab. The below screenshot is where look at the first sight:
- We have product revenue increased by %27 which is wonderful!
- %17 of this increase came from the number of products sold.
- Also, we have sold %9 more expensive products than in the previous period.
Of course, if we look at the gross profit per product, it would be great but, this is just a Google Data Studio template designed for self-service usage. You can subscribe to a plan if you have a customisable dashboard for your business or clients.
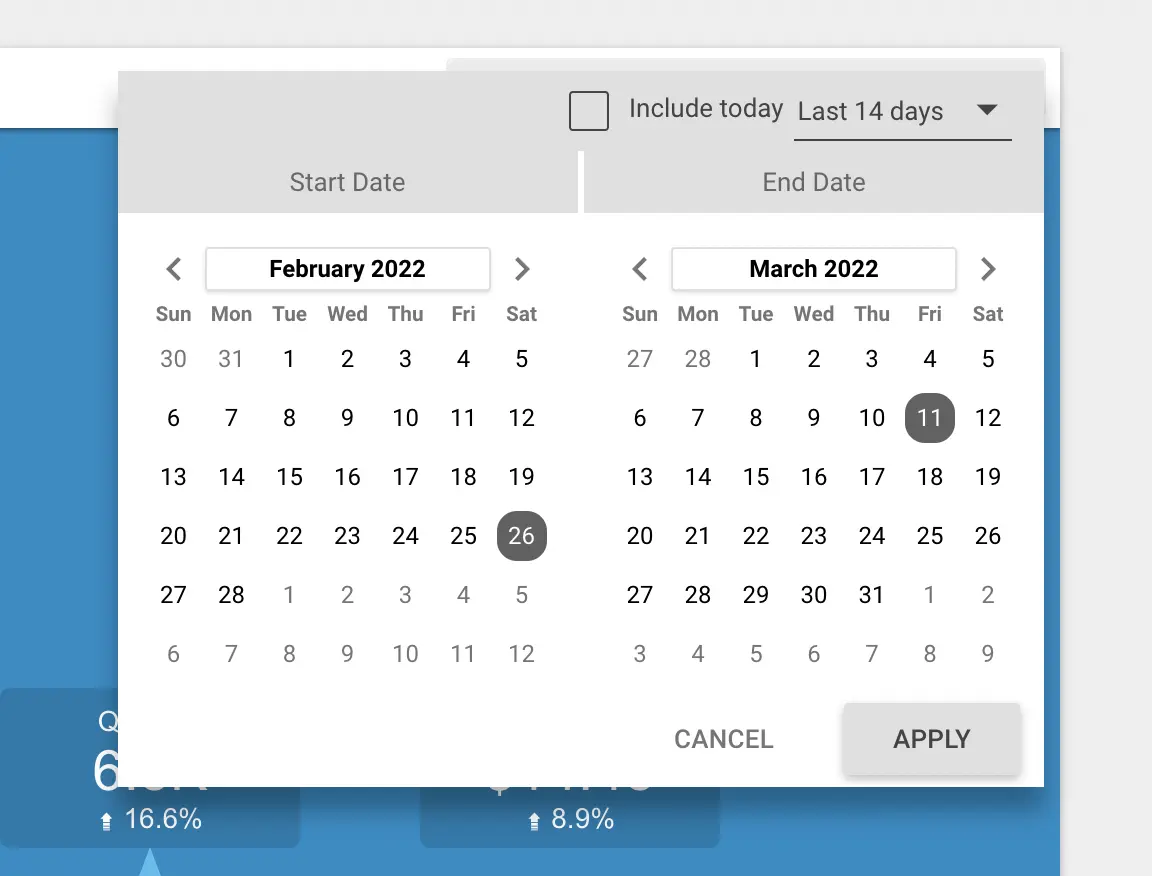
Date selection
The default date range is set for the last 14 days. I found that this is the safest date range to see the "actual" trend changes but of course, it is up to you to have a shorter/longer period.
Revenue Drivers
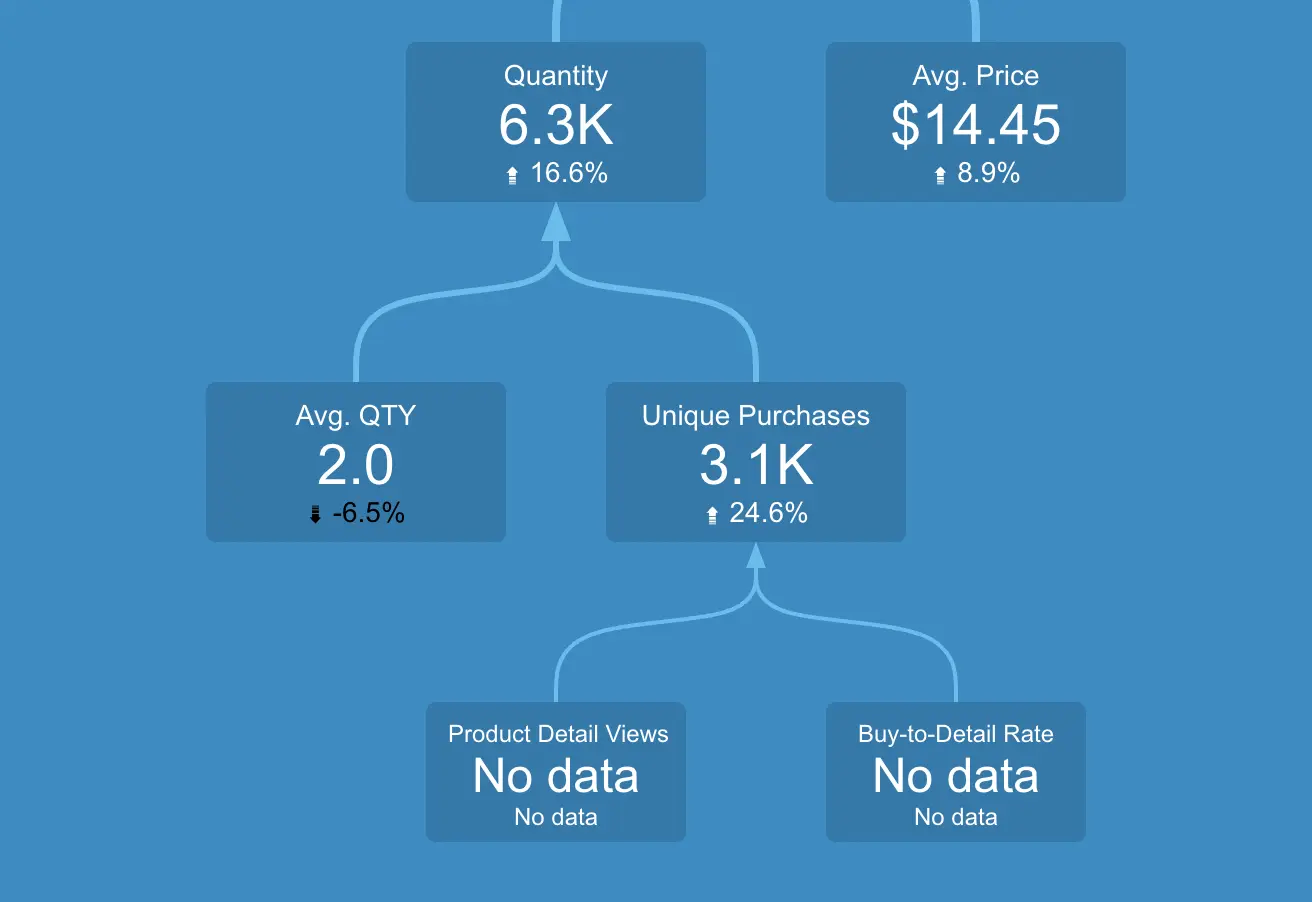
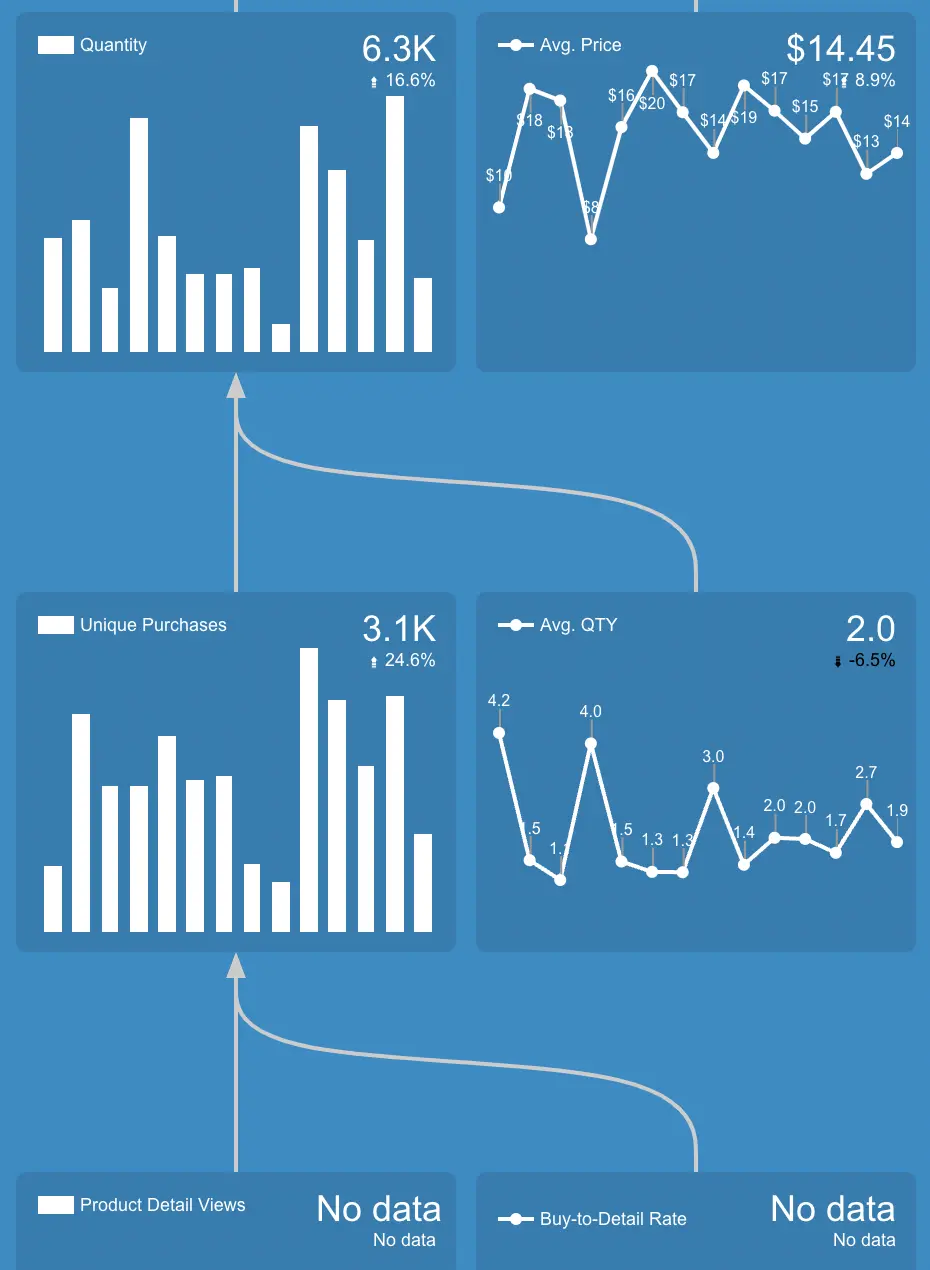
Here are the rest of the drivers. We noticed that quantity sold has been increased by %17. Here are the sub-drivers of quantity sold:
- Avg quantity in the basket has been declined by %7
- Unique product selling has been increased by %25.
- This means we sell products to more people but, their basket sizes are slightly small than in the previous period.
It is funny but, this account (Google's sample Google Analytics account) doesn't contain the full enhanced e-commerce implementation.
If we have this setup ready (I have accounts that have full-setup but, are clients' accounts which I don't use for blog posts.), we will use extra 2 metrics to complete the e-commerce user journey:
- Product detail views: I believe every traffic source's aim should bring visitors to the product detail page, not any landing page. I take a detailed page view as a starting point of this journey.
- Buy to detail rate: This is my favourite driver which represents the percentage of visitors who bought an item on a website, after viewing that product's page.
You'll have a complete picture of the customer journey after all of those metrics (drivers) with this Google Data Studio dashboard template.
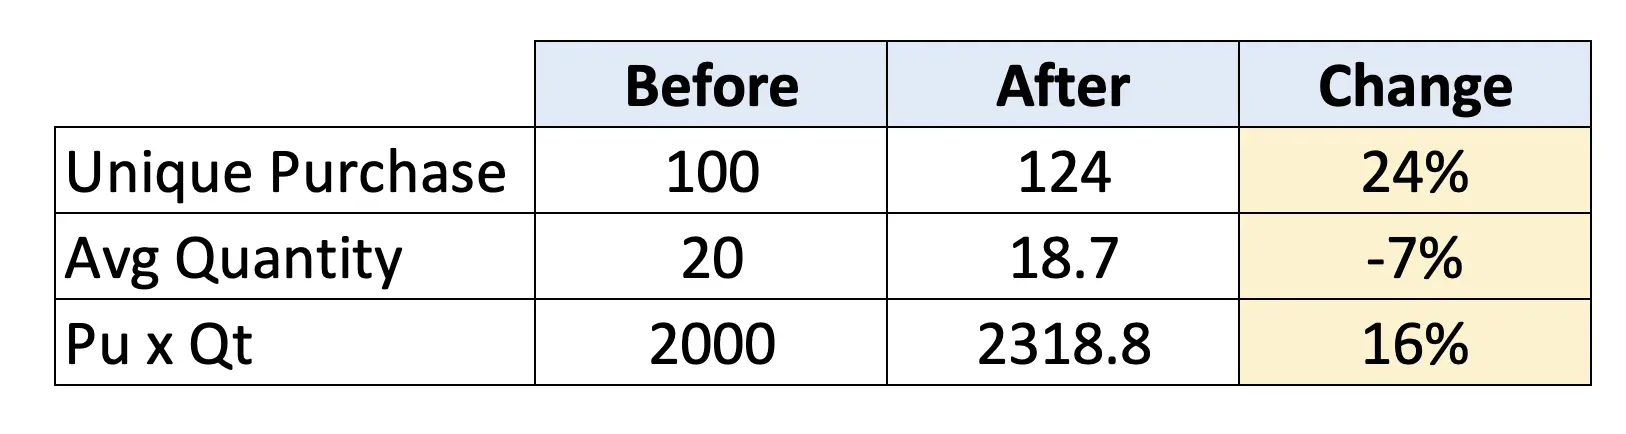
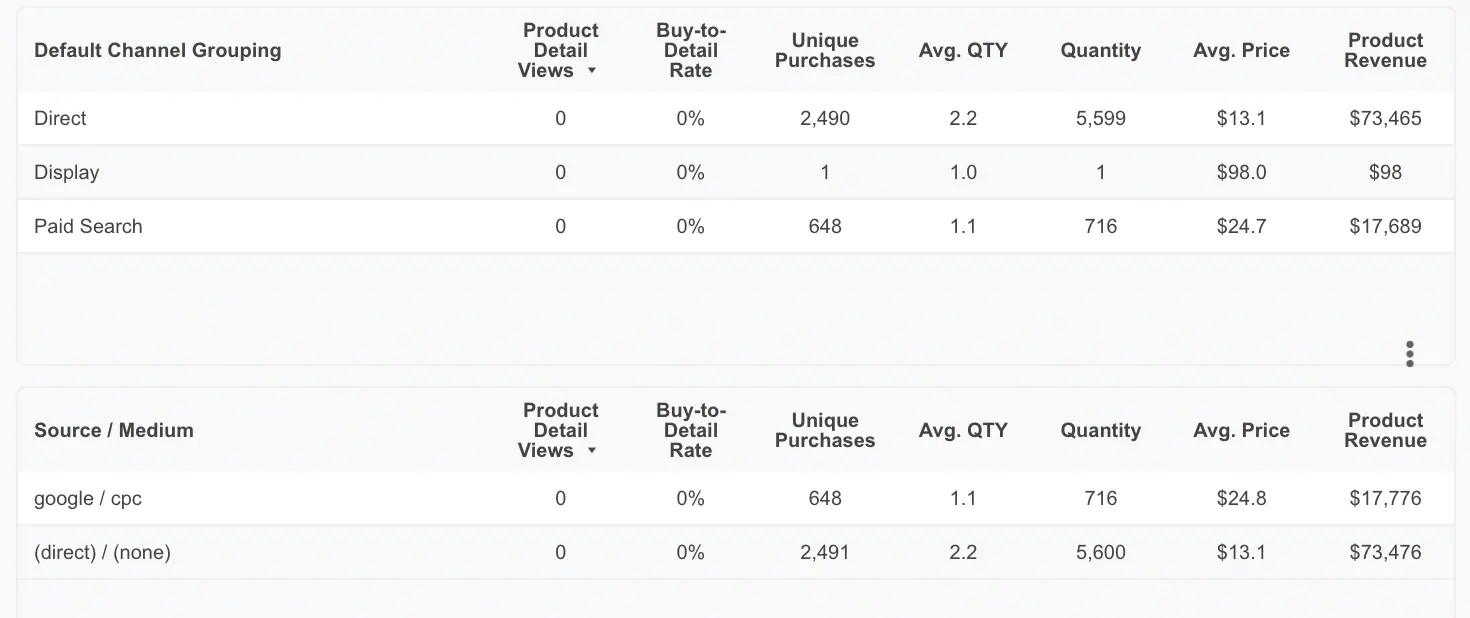
Note: Before continuing, I want to talk about a small detail. You may think that how quantity increased by %16 while unique purchases decrease by %24 and avg quantity incased by %7?
The below table is the calculation of how this happens.
Tables and filters
I would like to talk about tables and filters together since both are melted in the same pot in my use case. We have 3 tables on the left side:
- Source / Medium: The source of the traffic
- Landing Page: The first page where a visitor sees
- Device: Desktop / mobile
You can see product detail views and product revenue in all the above breakdowns. Isn't it cool to see which landing page drove the highest revenue?
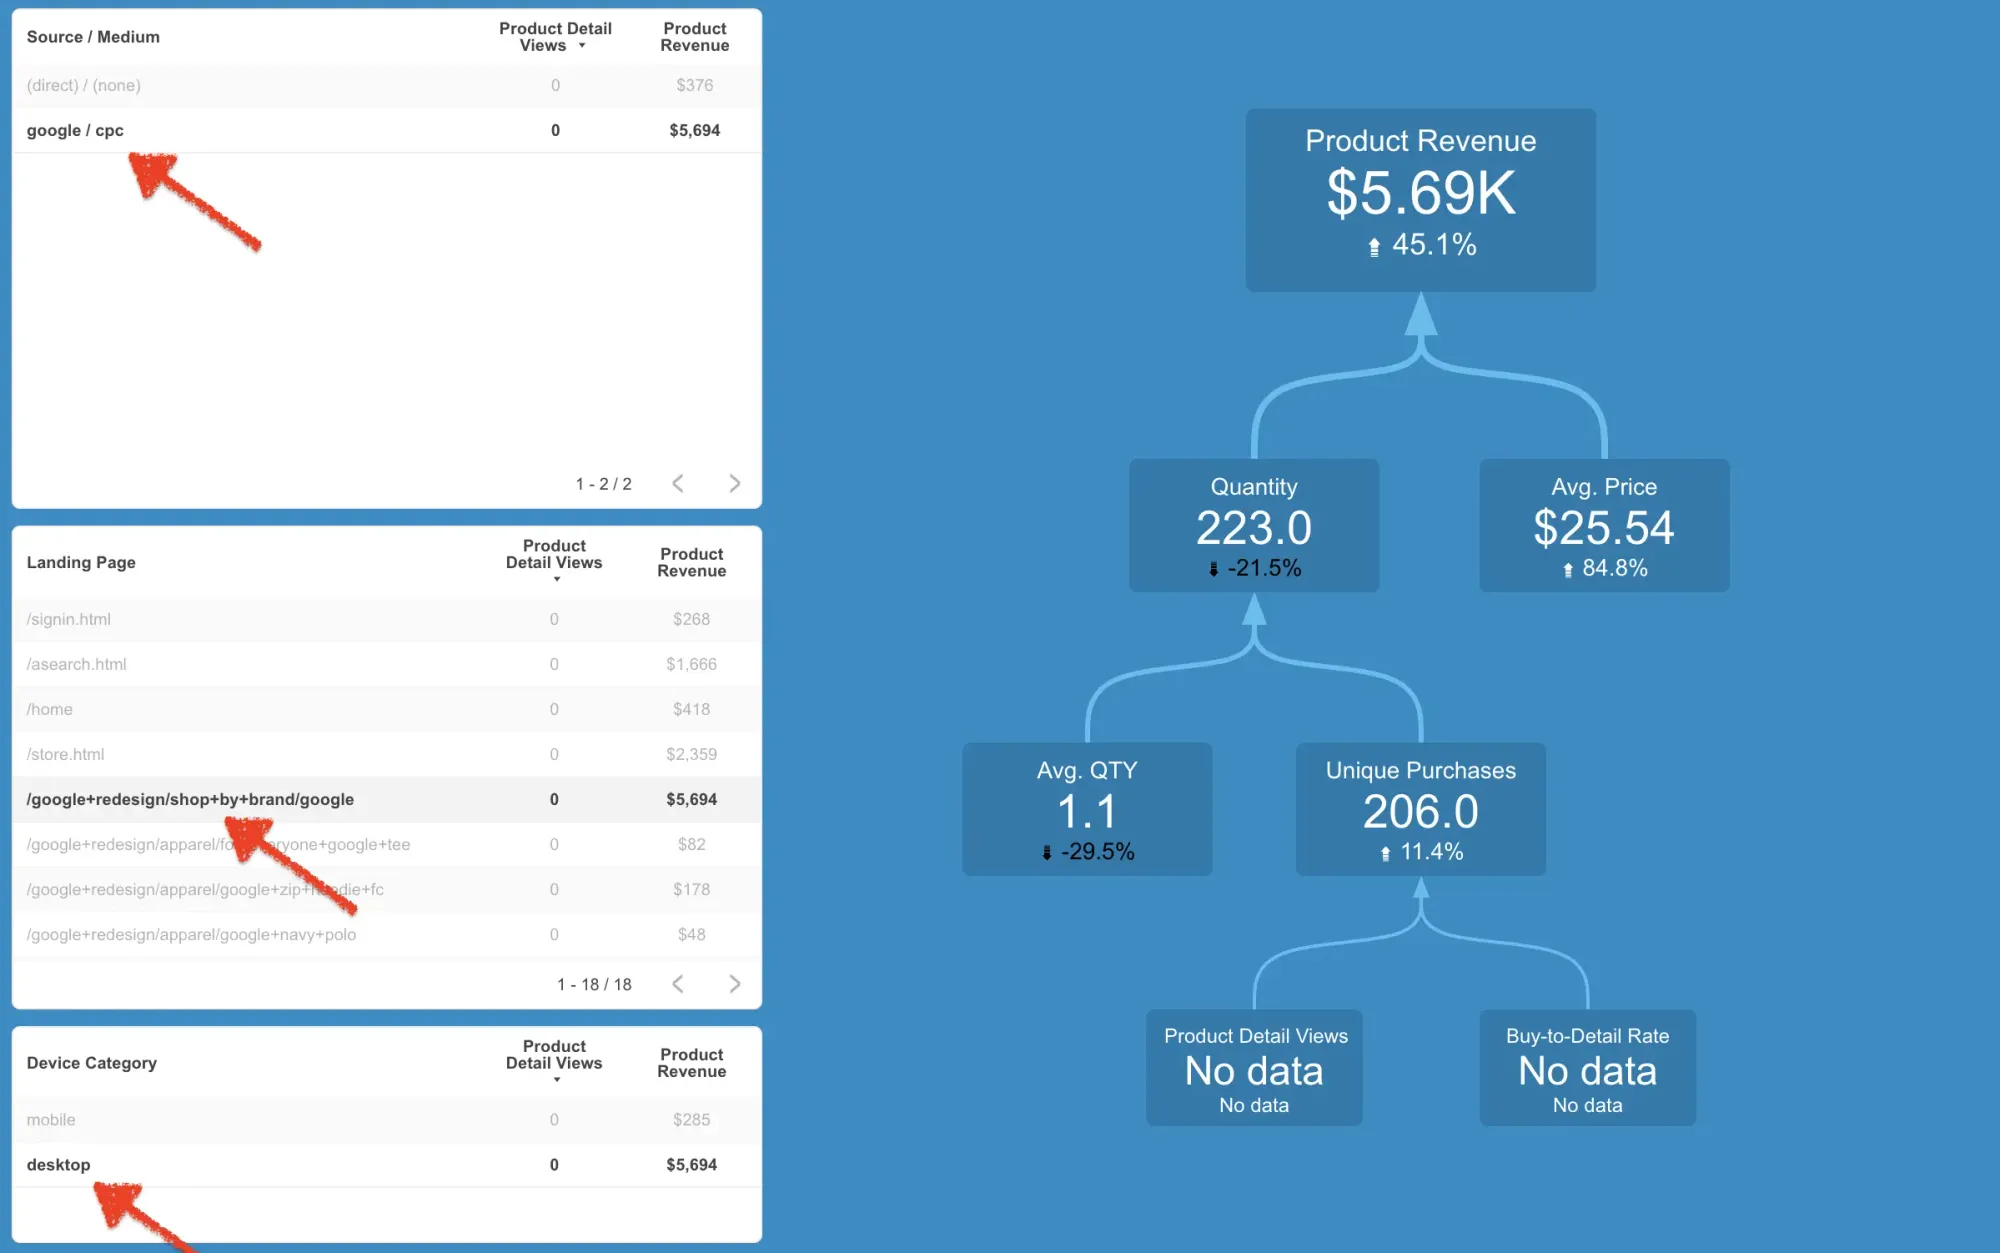
Let's click any row on any table to filter the whole page. I chose Google Ads as a traffic source. You can click on multiple tables to blend filters which is super cool and flexible.
Now the right KPI tree chart gives the changes over time according to the selected filters.
How advanced users can use this dashboard?
The below will be your cockpit while you are optimising your merchandising performance as a technical/data person.
Let's deep dive into the details in the next section.
Revenue drivers with a trend chart
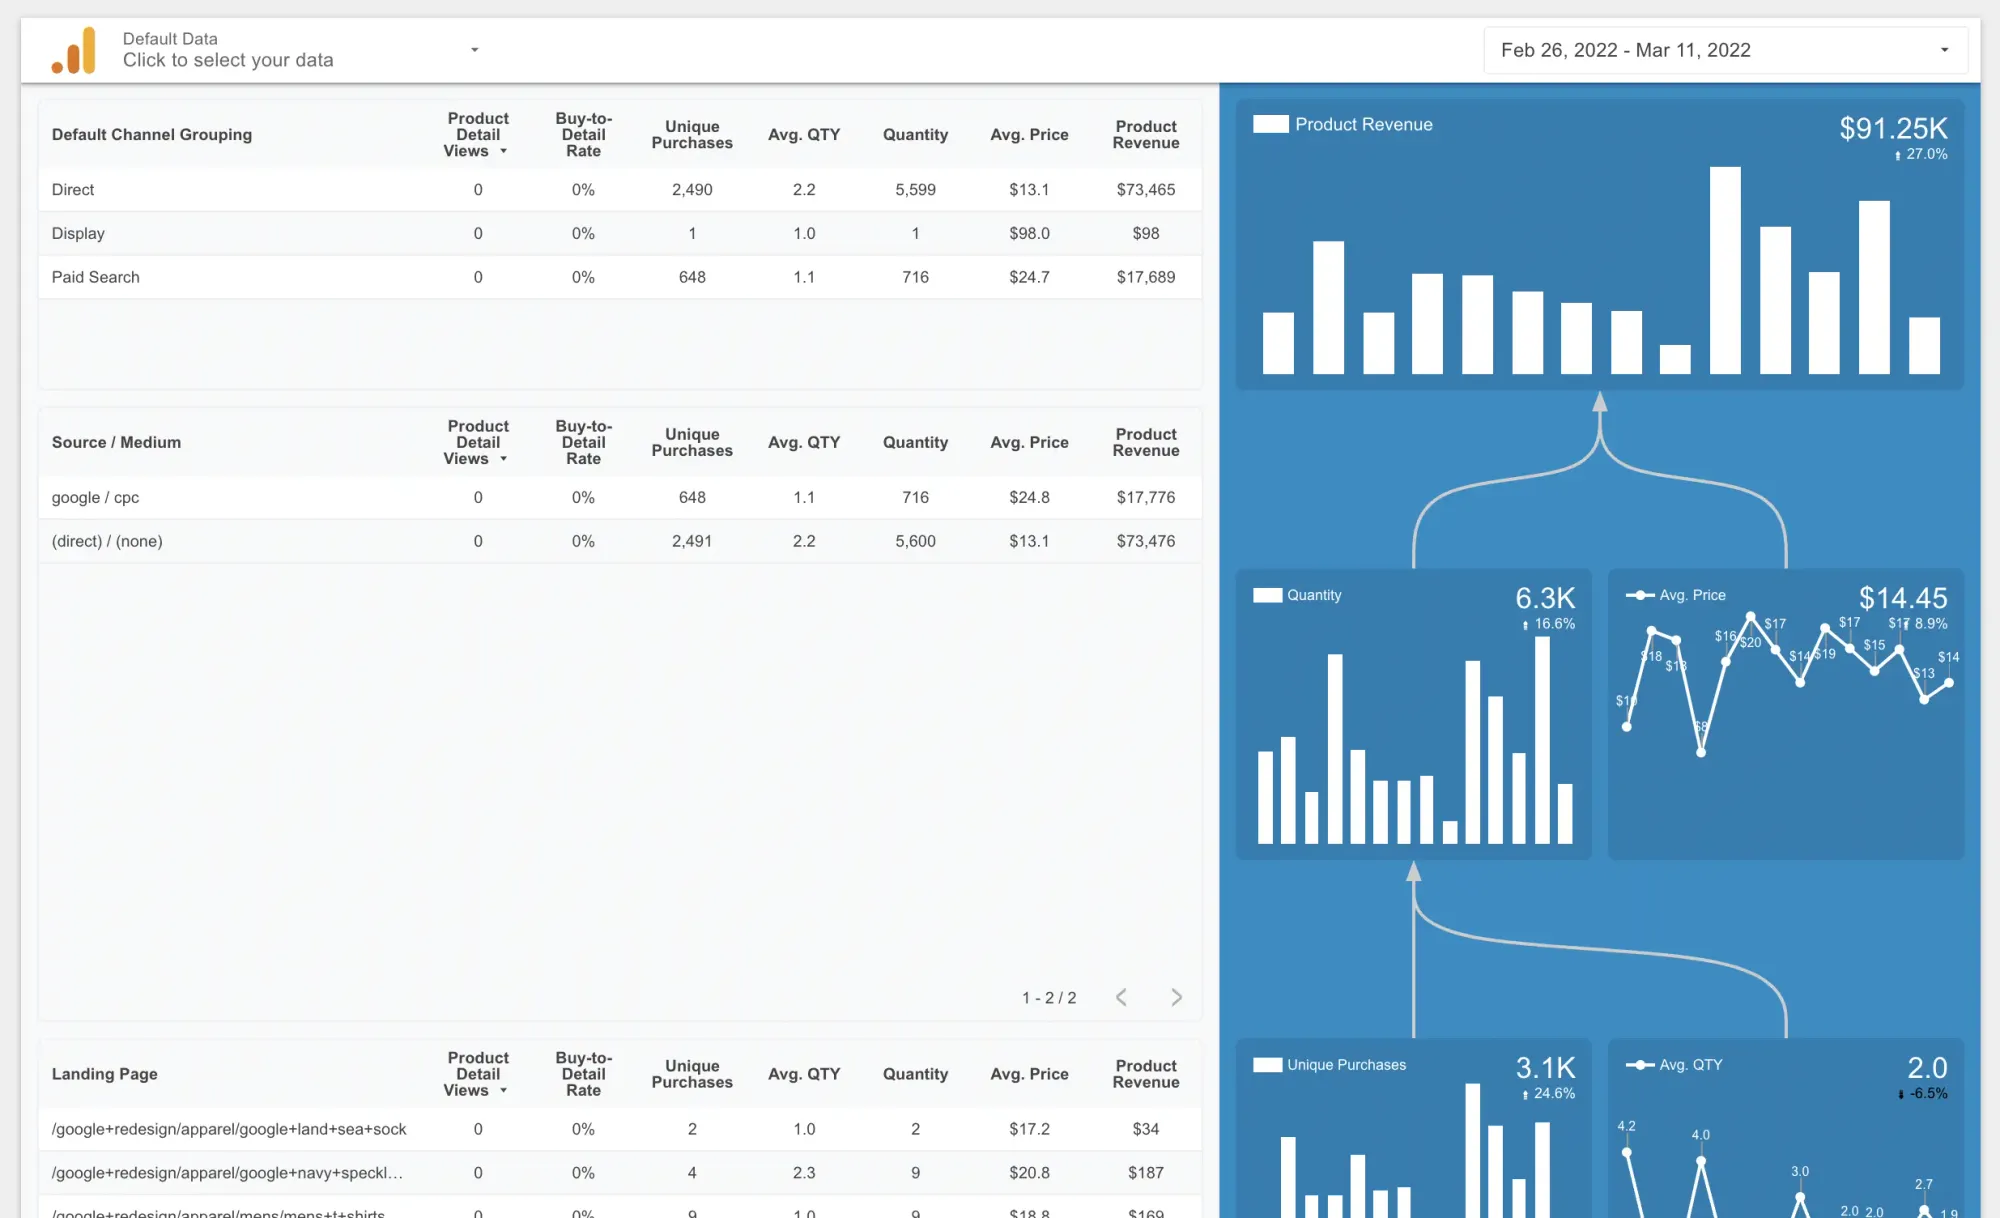
This is an enhanced version of the KPI tree. We have added trend charts so, you will have the daily trend of the related KPI alongside the total numbers which can be seen at the top-right corner of the widget.
Look at the below graphs. The last 5 days were great. Avg. price and Avg. Quantity is almost stable but, Google Merchandising Store (our sample data set) doesn't have a product detail view integrated so, we can not see this metric. My instinct says that they drove more traffic recently which cause the overall product revenue to increase. Possibly, there is no conversion rate uplift.
Tables and filters
My favourite parts of this page are tables. We put every important metric in these tables as columns. So you can see the revenue drivers per breakdown.
We have channel grouping and traffic sources below.
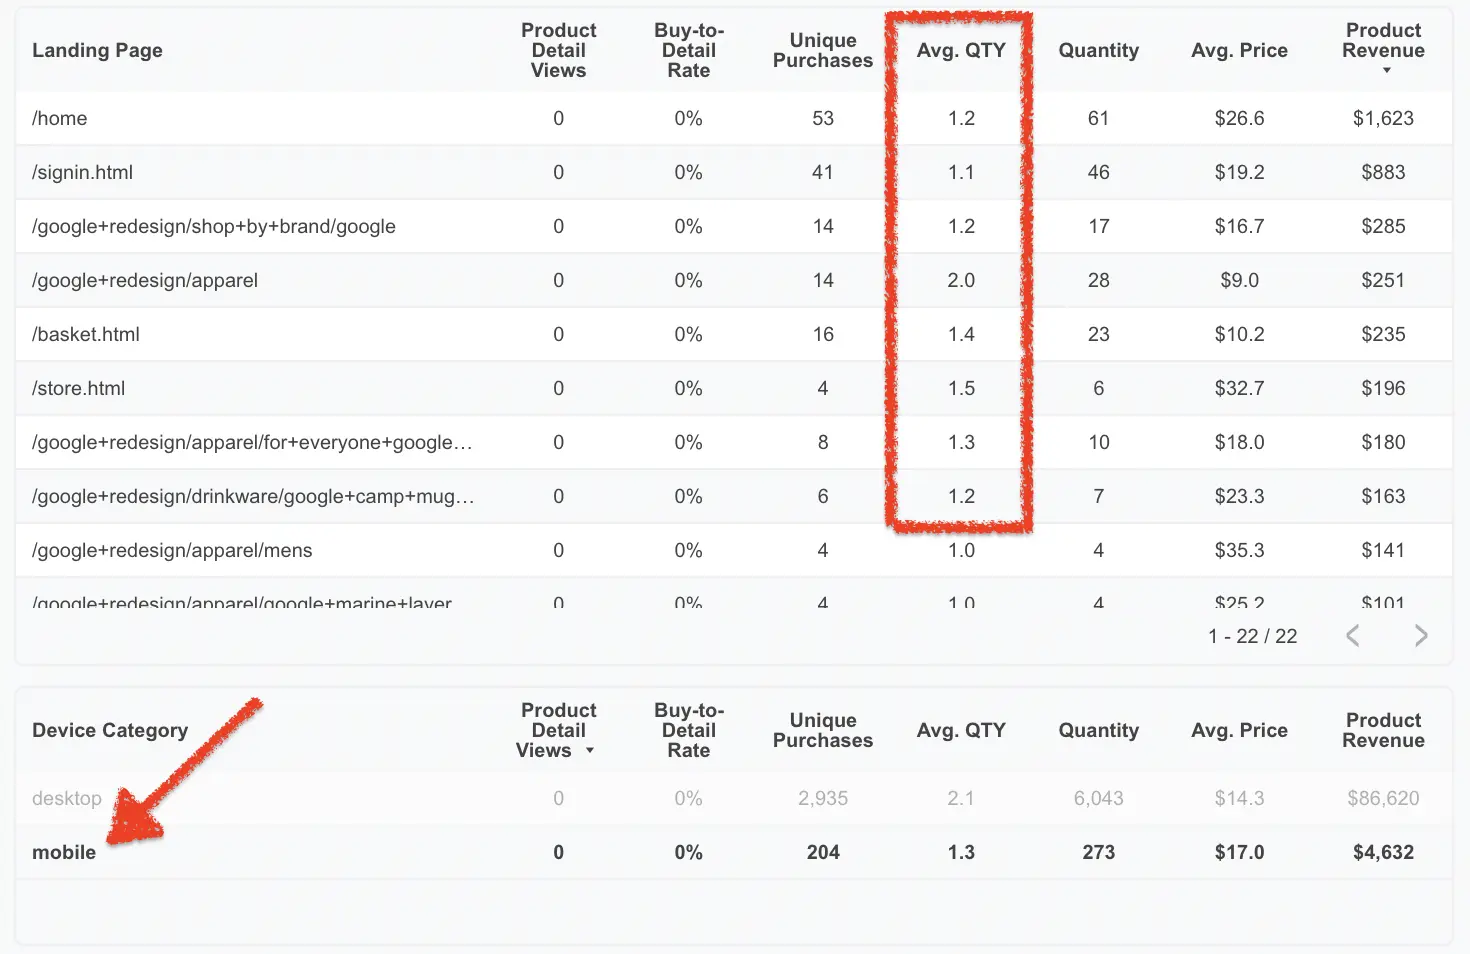
The below table shows the landing page and device breakdown. Look at those metrics. Some landing page has a higher average quantity in the basket but a lesser average price.
Have a look at the device category (I just noticed while writing). The average quantity in the basket is almost half on mobile device sessions.
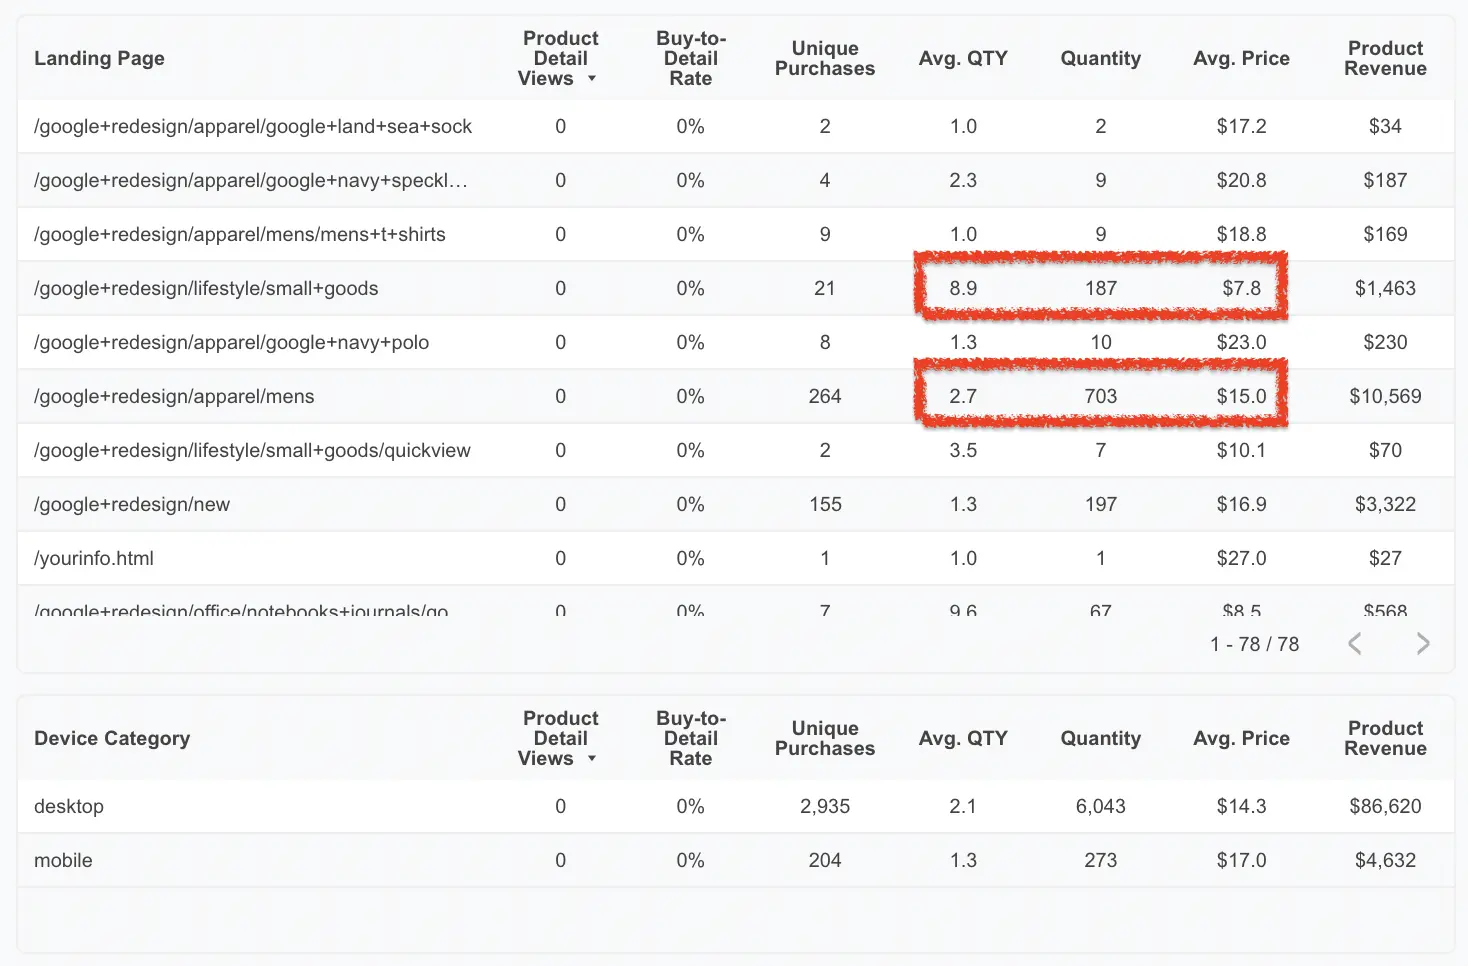
I used the device category table to filter the landing page table. Landing pages are quite different for mobile and desktop traffic.
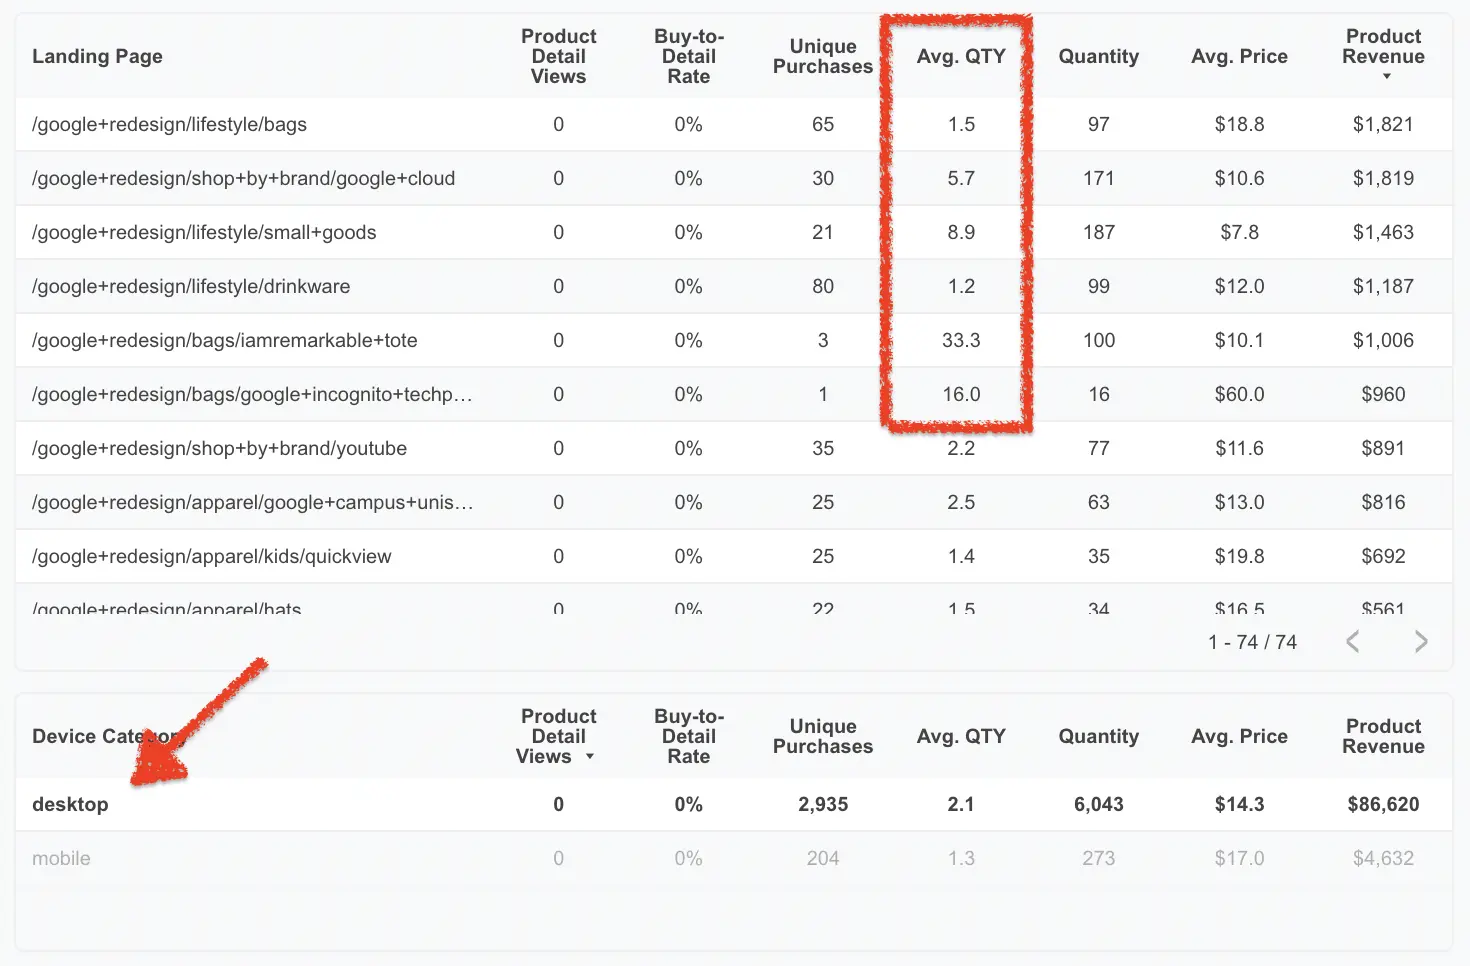
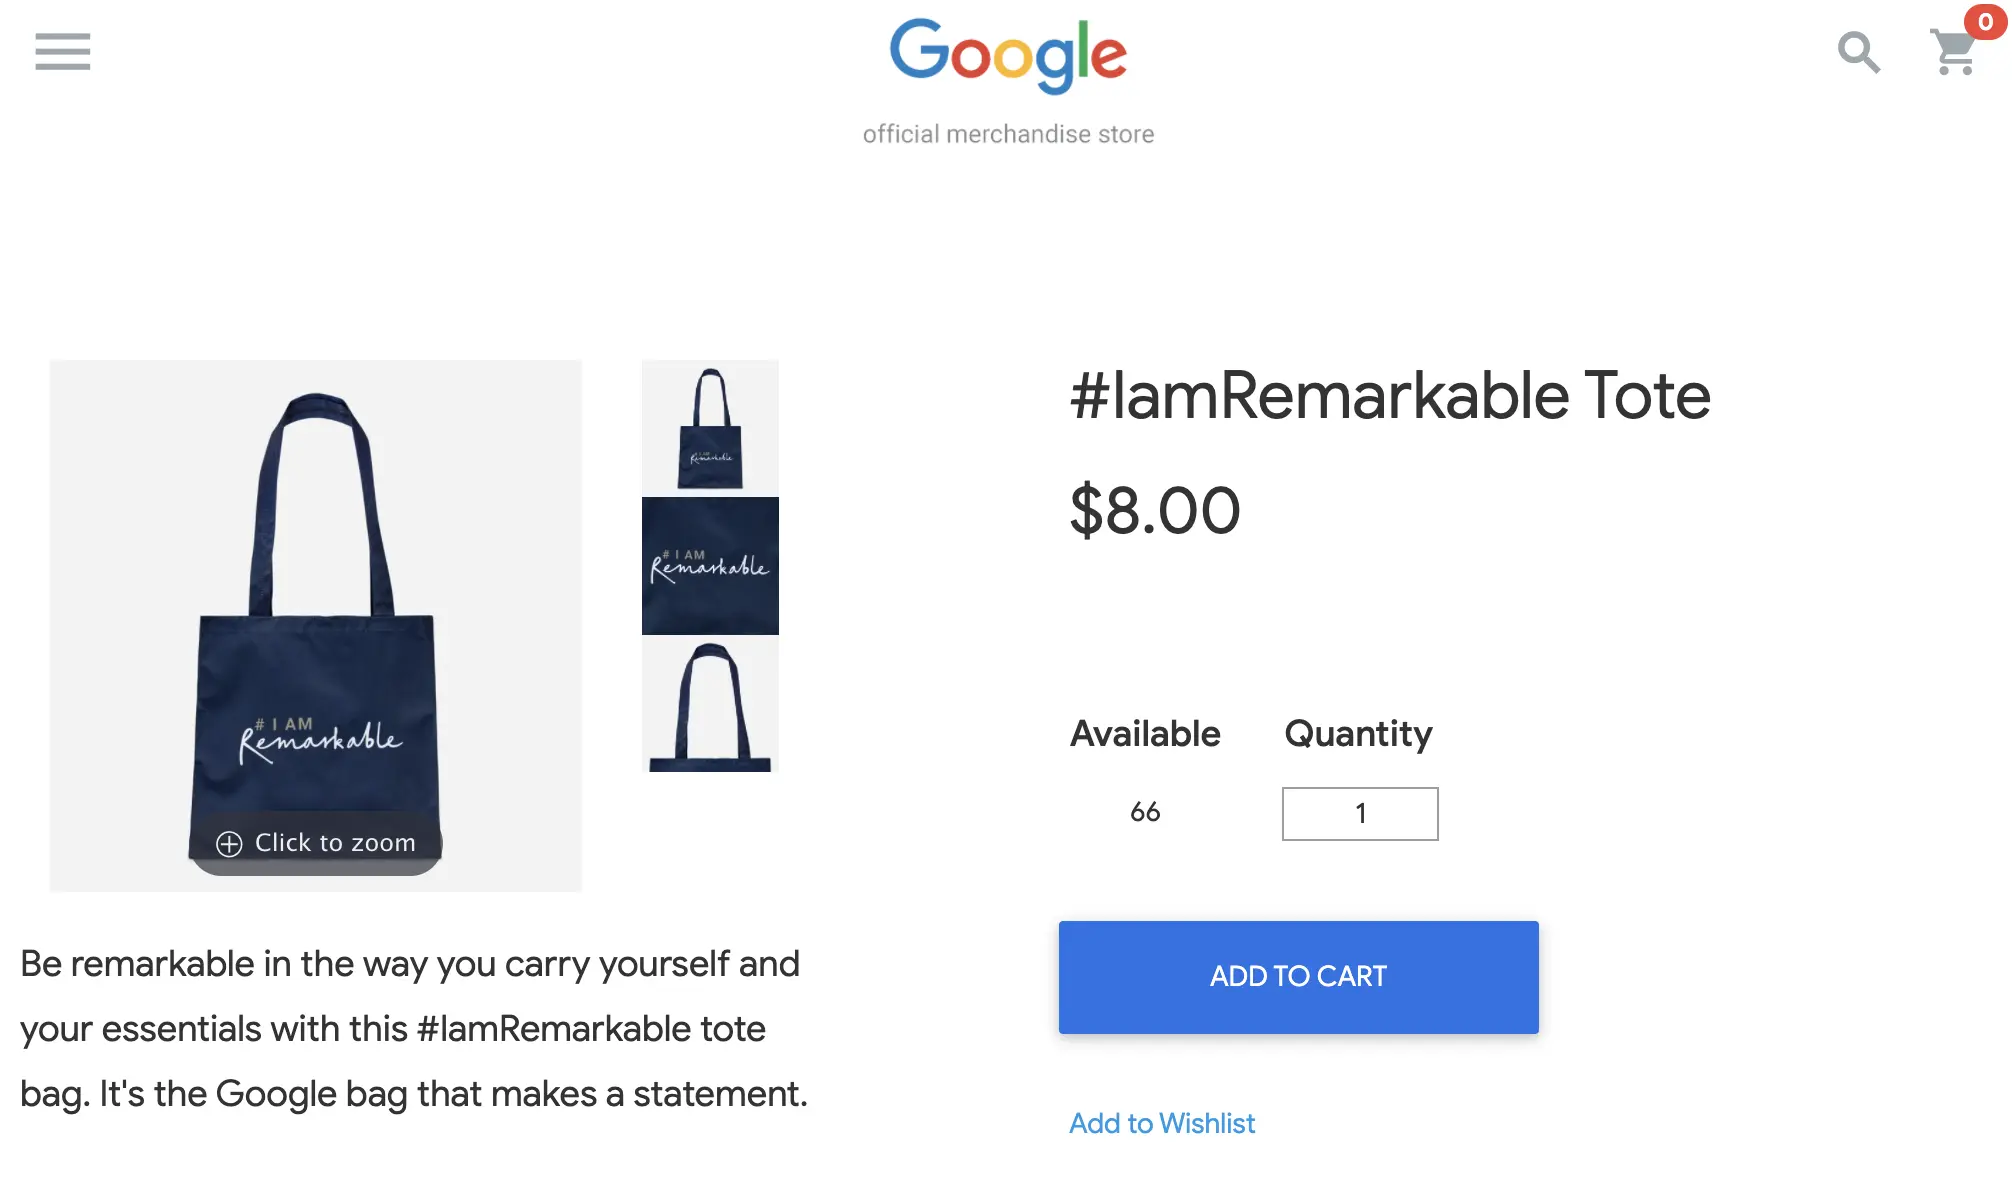
Also, I noticed that #IamRemarkable Tote product has one of the highest quantities in the basket which is one of the main drivers on product amount in the basket.
How to purchase this template?
If you need a custom made dashboard then, please reach us through the contact page, if you prefer to purchase the template and edit by yourself please check one of the options below.
Through Fiverr
If you have a Fiverr account and like to proceed through here then, please follow this link to access our Fiverr account page.
Through Etsy
We are putting these templates on our Etsy page, too. Here is the link to the store in case you have an Etsy account and prefer to proceed through this platform.
You may think why all of these dashboards cost so little. Because you caught me in the phase of learning how to sell digital products rather than my hours. So, enjoy your templates, and let me know if you have any feedback for them.
Subscribe to the lifetime plan
We are offering lifetime access for current and all future templates. Also, you'll have a template request option without extra cost if the template gallery hasn't included it yet.
Click here for details: https://northstaranalytics.co.uk/membership/
How to copy this dashboard?
We have been created content about duplicating Google related dashboards here.