How to Use Data Studio to Maximise Google ADS ROI?

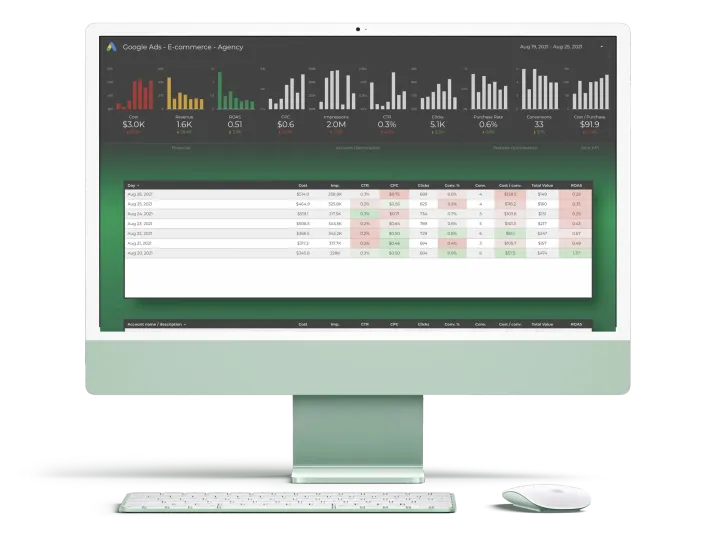
Data Studio is the best tool you can use to analyze and optimize your Google Ads account.
From one place, you can access everything you need for an advertising campaign: Keyword bids, Ad Group performance, Cost per acquisition, and more.
You can easily filter and sort through different metrics and segment your data in reports. Use Google Data Studio to log into Google Ads and set up a report to get started.
In this article, we will look at how to use Google Data Studio to analyse and optimise your Google Ads account.
Perhaps the most important point in the advertising work you have done for your business is to observe the data you have obtained and take precautions when necessary, or to find solutions that will allow you to profit from your investments.
It makes your job much easier to see the optimizations required for a more successful advertisement work in a single report, while announcing the name of your business, which you have worked hard for, developed by working with patience and devotion, to the world. Google Data Studio is a great tool to quickly get the most valuable metrics.
We recommend using Data Studio reports to optimize your Google Ads advertising account. In this way, you can optimize your ads more easily and track your returns in a healthier way.
Chapter 1
Why Google Data Studio?
Data Studio reports are one of the solution systems where you can prepare dynamic reports for users on multiple data subjects in the fastest and most effective way offered by Google.

Apart from the ready-made templates that you can use in the interface, you can produce templates that you can edit as you wish, and you can easily analyze your accounts and campaigns and generate reports as you wish.
With the help of Google Data Studio, you can extract data from Google Ads, Google Analytics, Search Console, Youtube, Google Sheets and SQL, access metrics related to your account and analyze them according to the date range you want.
Google Analytics or Google Data Studio?
Google Analytics has a very nice dashboard and a structure where we analyze the data dynamically, why should we waste our time on a new tool instead of learning it better? You may be thinking.
Yes, we can examine our data in Google Analytics as we wish, and even integrate some resources, such as Google Ads, and Search Console. But:
In order to measure the performance of the metrics we want in Google Analytics, it is necessary to reach that category by making many clicks, then filter if necessary and repeat this process each time.
Our time is very valuable and for some, taking action within minutes can prevent huge losses. From all these clicks and workloads, seeing a screen where you can compare the metrics you want with the periods you want for once is a reason enough to choose Google Data Studio.
At the same time, Google Analytics is an analysis tool. Google Data Studio is a reporting tool. While you can only see Google Analytics data in Google Analytics, you can add data from many analysis tools to Google Data Studio and customize your report.
Data Studio is such a vast platform to explore that the more we push our imagination, the more we can do. Moreover, all in one report!
Connect Google Ads to Google Data Studio
To complete this section, we'll assume you have access to the Google Ads account that will be connected to Insights, but before that, consider why you're doing this. Let's say you're running a large-scale online advertising campaign and you want to understand the general direction of the campaign and its effectiveness so that you can use hard numbers as a guide to measuring the area improvements you want.
Then obviously you need a way to analyze those numbers, analyze trends that might not be obvious, summarize your findings, and present them in a format that makes your conclusions actionable. This is where tools like Data Studio come in handy, as it gives you an embedded platform to perform the analysis you want without the need for deep technical skills. All you have to do is point it to the right data source, in this case, your Google Ads account, and you're ready to explore.

To connect Google Ads to Data Studio, you will first of all need to log in to Data Studio. You can use your Google account to do so at this address – https://datastudio.google.com/
Once you have successfully logged in, follow the steps below to properly set up the Google Ads connection to Google Data Studio:
- Click the Create button in the left pane and select Data Source.
- Then click the Google Ads connector in the list of connectors.
- Choose your Google Ads account.
- Click the Connect button that appears in the upper right corner of the page.
- Then click the Generate Report button in the upper right corner of the page.
- Click the Add to Report button that appears as a modal as part of the report creation steps.
The newly created report will now show a valid connection to your Google Ads account. You can then start customizing reports for your use case using Data Studio's available data and visualization control
Chapter 2
Dashboard Ideas
We brought some dashboard ideas to help you to optimise your Google Ads account.

Geographic Performance Report
Thanks to the geographical performance report, you can measure the traffic and conversions coming to your website from which regions the most. With this type of performance report, you can find the region that brings the most conversions with the lowest cost, and if you are planning to open a new branch, you can focus on the places in that region. According to the device types used by the visitors, you can analyze your data regionally and have information about it, and you can optimize your campaign accordingly.
Demographics Performance Report
With the demographic performance report, you can examine information such as the age range, gender, parenting status of the users who are interested in your products or services in the ads, and which device they are using, and you can increase or decrease your bids in line with this data. In this way, you target people who are likely to be interested in your products and use your budget in the most accurate way.
Performance Report by Conversion Type
The performance report by conversion type helps us measure the age group, device type, and gender of users who perform valuable transactions such as sales, phone calls, and form filling. The main metric focused on in this performance report will be the conversions you get. Thanks to the conversions we set up on your site, we can measure the conversions from the ads and convey them to you, find the audiences that these conversions come from, and make an appropriate proposal arrangement for them, so we can achieve result-oriented and efficient solutions with fewer budgets.
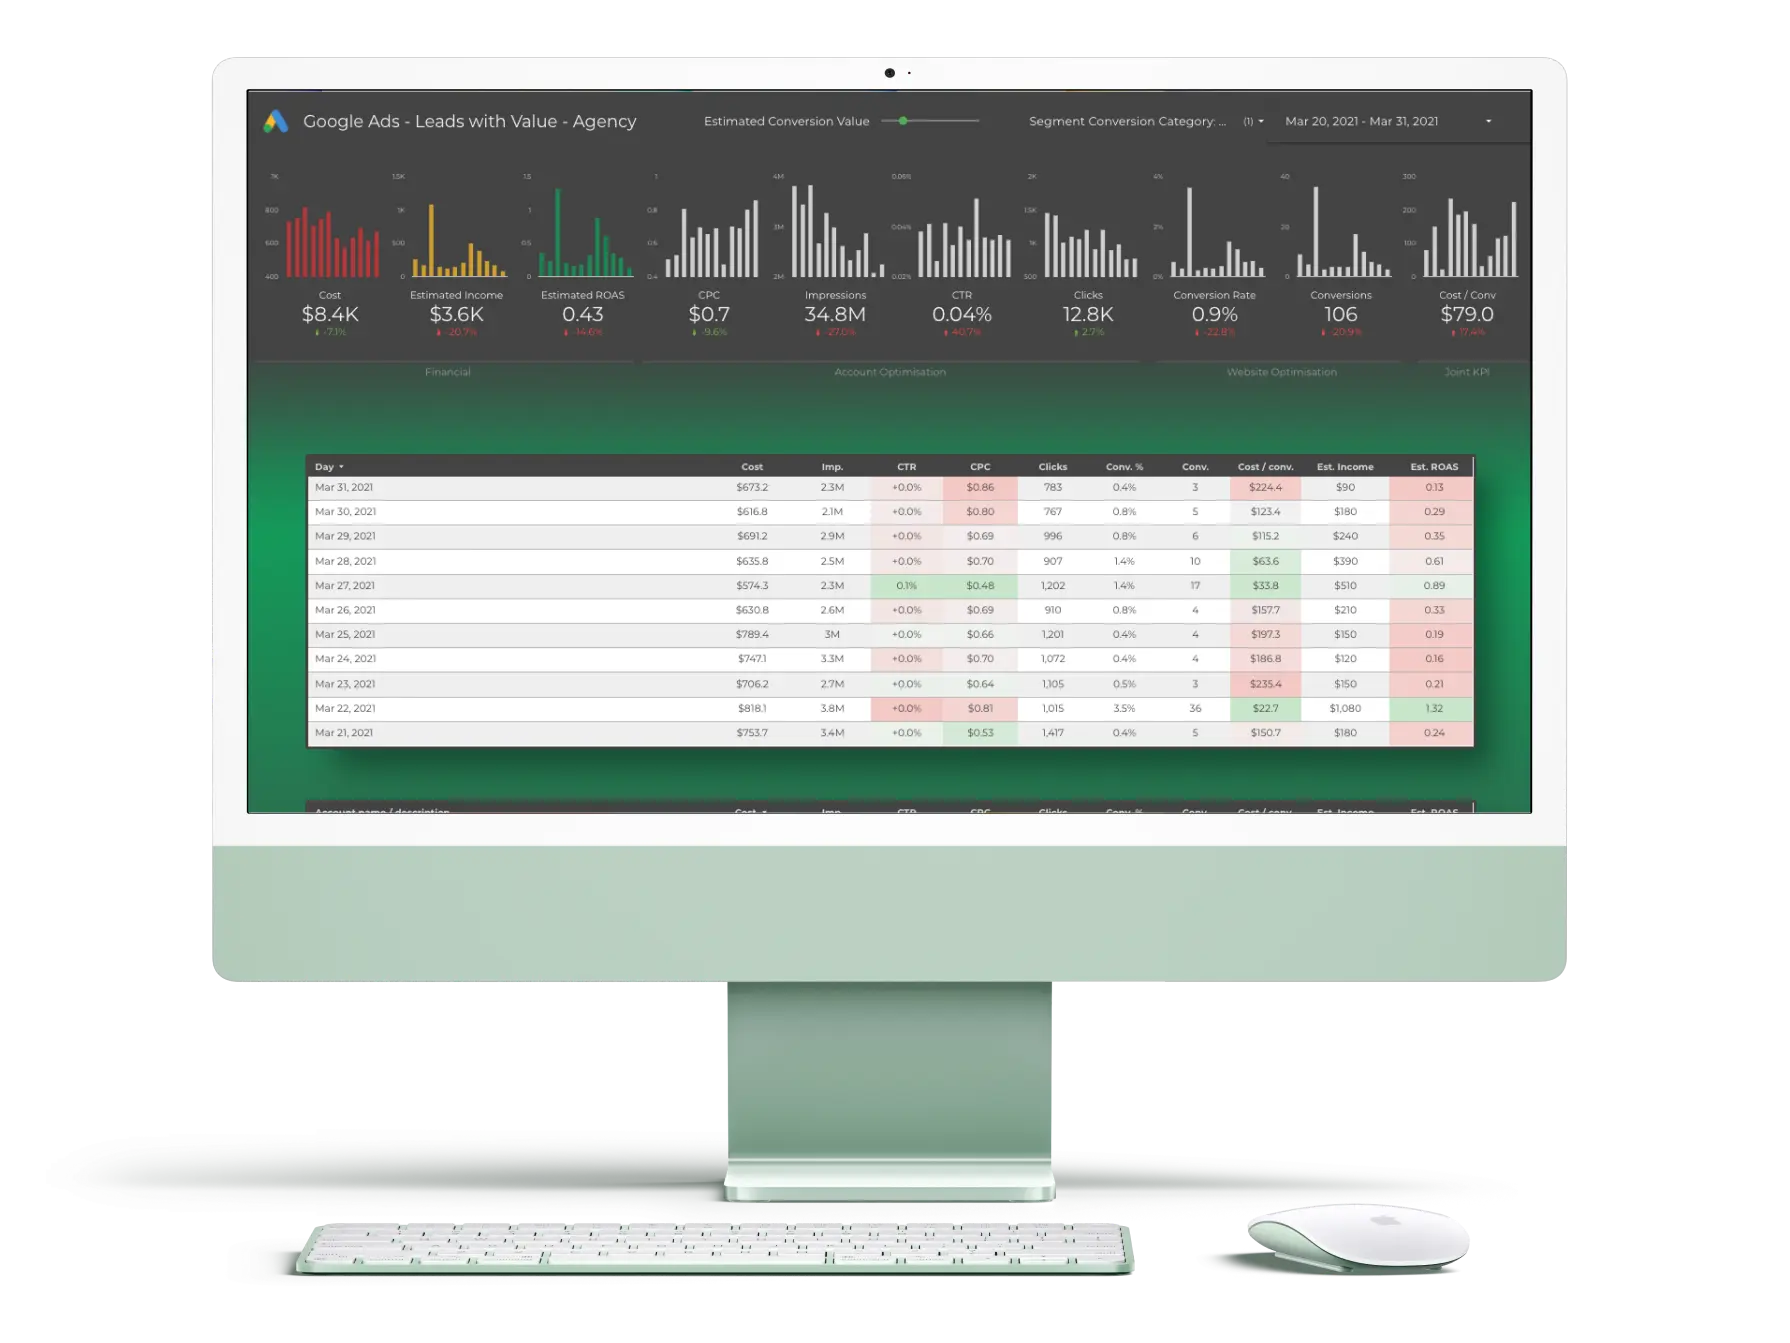
Ad Group Performance Report
The ad group performance report, on the other hand, helps you to examine in detail information such as which of the prepared ad groups consumes how much budget, how many impressions and clicks it receives, how much you pay per click on average. By examining the data in this report in detail, it is possible to optimize advertising efforts to achieve higher conversions.
Performance Report by Time
In the performance-by-time report, you can see graphs of important metrics such as how many times your ads were clicked on, in which day and hour, and the average cost-per-click value. In this way, you can get more feedback and increase your profit by scheduling advertisements according to the hours when conversions and impressions are highest within the current budget.
Chapter 3
Optimisation Indicators
Depending on the content of your site, there are some KPIs (Key Performance Indicators) you need to monitor to track and improve the performance of your Google Ads ads, as well as keep costs under control.

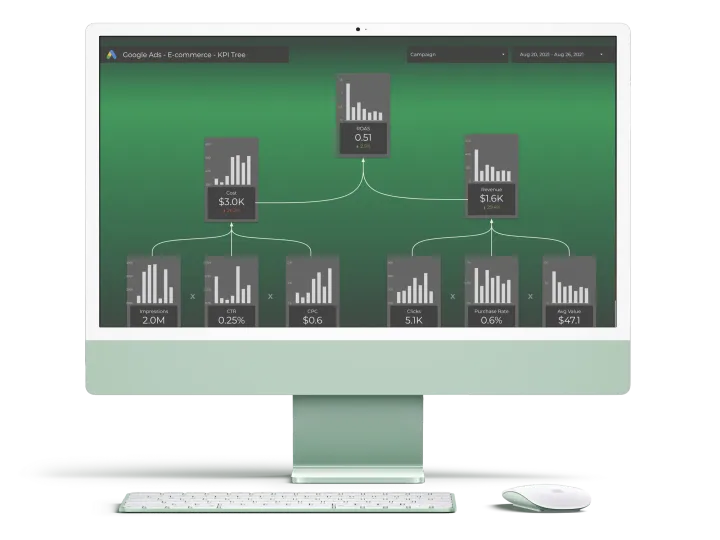
Key performance indicators show us how effective our tactics are. Tracking your key KPIs not only helps you determine how successful your campaigns are but also allows you to make smarter, data-driven campaign decisions. Most importantly, it is the only way to demonstrate the effectiveness of your strategy to your boss or customers.
As your campaign goals change, you need to link your Google Ads KPIs to them. The key to success is setting reasonable goals for each Google Ads campaign and choosing metrics that will tell you whether you're meeting those goals.
With the KPIs you will determine, you need to follow the efficiency and results of your Google advertising campaigns and make the necessary optimizations in the light of this data. More precisely, tracking these KPIs is critical for a successful Google Ads campaign.
If you are not sure which KPIs to monitor to improve the performance of your campaigns, here are some of the most basic KPIs to follow that can help you.
Click-through Rate
The Click-through rate (CTR) shows the engagement performance of your campaign. It tells you how many people clicked on your ad after seeing it.
For example, if your ad is clicked 300 times and gets 2000 impressions, your CTR will be 15%.
Calculating and improving your CTR not only helps you monitor the success of your campaigns but also allows you to increase other metrics such as quality score.
A high click-through rate is one of the successful campaign tips. Note that there is no ideal CTR comparison you should reach. It depends on your industry, target audience, budget, and so on.
Keyword Performance
Conducting extensive keyword research and understanding search intent remains the backbone of your Google Ads campaigns. However, to get the most out of your ads, you also need to monitor how well your keywords are performing.
To start, monitor your keywords' quality score, clickthrough rate, clicks, and valuable conversion metrics. Based on what you find, remove keywords that don't work for you.
For example, some match types will send you higher impressions, clicks, and conversions than others. Finally, identify the irrelevant keywords you don't want to appear and add them to the negative keyword list.
Cost per click
When creating Google Ads campaigns, marketers set their budgets and can enter rough bids per click into their campaigns. Unfortunately, just because you've set your budget and bids in advance doesn't mean that's what you're going to spend.
The price of the bid depends on the other advertisers you have to compete with during the ad auctions. Therefore, you can pay a higher or lower bid price.
This is where cost-per-click (CPC) comes into play. It tells you how much you paid for your ad placement.
Quality Score
Many advertisers find quality scores difficult to understand and track due to its complexity. Still, tracking and improving your quality score should be your top priority, as this metric directly impacts your other performance metrics like your CPC or CTA.
Google-generated quality score is a metric that shows how relevant your ad is. It relies on metrics such as clickthrough rate, ad format, and your landing page relevance to determine how well your ad meets the needs of your target audience.
Google rates your ad on a scale of 0-10, and a score above 7 is a good one. A value less than this means you need to invest more to improve the effectiveness of your campaigns.
Cost Per Conversion
The most important factor here is that each project can have its own unique transformation tracking. For example, the conversion strategy of a content site that generates revenues with more quality visitors and an e-commerce site that generates revenue by selling products will be different. If we are a content site, maybe we can count 5 pages of users visiting our site as 1 conversion. Or, if we are an e-commerce site, it would make sense to count 1 successful cart/shopping completion page and 1 conversion.
By examining your costs per conversion, you can easily examine which campaign you get more quality visitors from. In this direction, you can keep passive by not insisting on the campaigns that do not go well, instead, you can start trying different campaigns. While setting up the campaigns, the campaigns that you thought would go better may have gone bad. It is useful to follow all these situations regularly and sustainably.
On the reporting screen:
- You can see which campaigns exceed the cost per conversion you will accept.
- You can see for which ad or campaign your costs per conversion differ
- You can examine which ones pull the overall average up or down.
- You can start taking action immediately based on what you see.
- You can close the low-performing campaigns and build better ones and use your budget more efficiently.
Conversion Rate
The conversion rate metric, which is another important metric, is very simple to calculate. Conversions are divided by clicks on ads.
The answer to the question for whom this metric is important is very simple. It is important for everyone. It doesn't matter if it's B2C retail, B2B manufacturer, e-commerce, local services, nonprofit or any other category. In short, it is a metric that everyone and every market should follow.
When you examine conversion rates, you can easily see the high rates and low rates of various campaigns.
Conversion Rate, you can start to review the lowest ones. In the last period, it is useful to examine what kind of a picture emerged and how it performed last month, if possible, last year.
Just like our cost-per-conversion metric, the conversion rate metric is one of the metrics we need to constantly monitor in order to make our campaigns more efficient.
Based on what you see here, you can easily take the following actions;
- You can review the CTAs on your landing pages. If the campaign you hope will go well, if it's going badly, maybe your call to action isn't true. You can make it more aggressive or softer.
- Maybe some of your pages have an infrastructure problem. Since it could not be reached from time to time, it has reduced the conversion rate. It may be necessary to check these pages one by one.
- Maybe you have a problem with the keywords you use in advertisements, you can do serious keyword research to solve all these.
Search Impression Share
Your ads can appear on a target you specify, an interest you specify, or all of them. However, we can never 100% guarantee that your ads are shown from an ad publisher, such as Google Ads, that we will serve in an auction order.
In other words, if there are 100 opportunity searches where your ad can be shown, if you get impressions in 80 of them, your search impression share rate will be calculated as 80%.
To put it bluntly, this metric isn't the first metric you should look at when analyzing a campaign, but it's an important one. It should not be overlooked.
However, it is important in this respect, that if an ad with a high conversion rate and high CPC has a search impression share of less than 100%, we can say that we cannot benefit 100% from a well-run campaign. We can say that we get less efficiency from an ad that will perform much better.
The important point is: Our impression share may not be only in monetary terms. An unoptimized ad may be shown less by Google than by our competitors. This analysis should be done very well.
Search Impression Share Lost Due to Budget
Thanks to this metric, we can measure the search network impression share that we lost due to budget.
Chapter 4
KPI Examples
Key Performance Indicators (KPIs) are metrics that show the effectiveness of your performance marketing efforts. There are many KPIs out there to choose from, but these are our favourites!

Key Performance Indicators for Sales
- Hourly, daily, weekly, monthly, quarterly and annual sales
- Average order rate
- Average profit margin
- Conversion rate
- Shopping cart rate
- The ratio of current customer sales to new customer sales
- Cost of goods sold
- Retailer's market share
- The average number of items in the basket
- Stock level
- Price policy of competitive firms
Key Performance Indicators for Marketing
- Site traffic
- Returning visitors and new visitor
- Pageview rate per visitor
- Traffic sources
- Newsletter subscriber
- Message subscribers
- Social media followers
- Pay-per-click traffic volume
- Blog traffic
- Number of products
- Brand or display ad click-through rates
- Affiliate performance rates
Key Performance Indicators for Customer Service
- The number of customer service phones
- The number of customer service emails
- Average resolution time
Chapter 5
Optimisation Routine
Analyzing a Google Ads campaign is not a one-time task, you have to build a routine around it and always keep an eye on your campaigns. While it’s not necessary to do a deep Google Ads optimization on a daily basis, it’s very important to do it at least once or twice a month.

The work is never done for Google Ads optimization. You need to monitor your campaigns daily and weekly. You should even do a comprehensive review on a monthly basis.
Optimizing a Google Ads account takes a lot of time. That's why tools like google data studio save you time.
Read our recommendations for Google Ads optimization, which you should perform daily, weekly and monthly.
Daily Google Ads Optimization
On the basis of daily optimization, you need to check that everything is going well. There are a few things to follow in this context.
Watch for significant fluctuations
Less than 15-20% data changes per day is nothing to worry about. However, daily checking is essential to detect early if there is an increase or decrease in your data beyond that. But don't worry, you don't need to constantly log in to your Google Ads account for this. You can set alerts to metrics that are important to you and receive them as email notifications.
Monitor your budget distribution
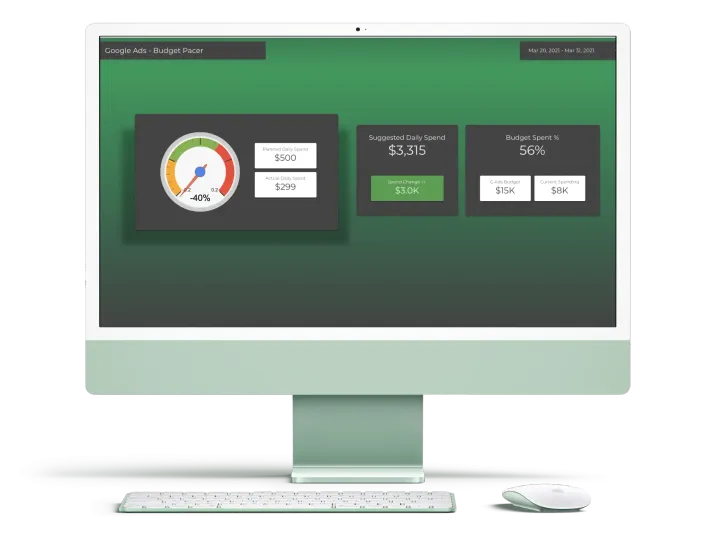
When running a Google Ads account, you set a certain amount of money you want to spend each month. You need to check what time of day your budget is most depleted and when you miss the most impressions.
Another thing you can do in terms of budget for Google Ads optimization is to set the "rotate indefinitely" option instead of optimizing for clicks. This way, your ads will appear evenly in a random order so you can accurately test which one is performing better.
After a few days of testing, you can stop the worst-performing ads so your entire budget is spent on your best-performing ads.
Negative keywords
Another thing you need to do on a daily basis in your Google Ads campaigns is to increase your negative keywords. For good ad performance, you should avoid-clicks that are not related to your product or service. You can find negative keyword ideas in the search queries report.
For example, if you have a company that sells only men's sports shoes, you may not want to appear in searches such as women's sneakers or men's boots.
You should check for negative keywords every day to reduce irrelevant clicks, especially if you are using a broad match strategy.
Weekly Google Ads Optimization
The indicators you should check weekly are more about trends that can give you insights into the performance of your Google Ads campaigns.
- Make sure to review the weekly “search terms” report for your Search Network campaigns. Be sure to know in which keywords your ads are displayed and from which words you get traffic. Keywords are the backbone of a campaign, and they can be difficult to recover if you shake the spine. In the search terms report, you can add the keywords that attract your attention and bring high traffic to the ad group, or you can create a new ad group and write specific ad text for the relevant keyword.
- Be sure to check the performance of your ads after checking the keyword status. Take a close look at the click-through rates and conversion rates of the ads. If you improve these two metrics, the quality score of your ads will also increase automatically. Make sure you direct your ads to the correct and relevant page, you may be redirected to an incorrect page. When checking for keywords, use the matching option in a structure suitable for keyword matching models. You can use the article I wrote before to examine the keyword matching options.
- Be sure to take a look at the Competitive Analysis report. Make an analysis by comparing weekly. On days or weeks when you are not on sale, if your competitor is on sale, they can increase their budget for the relevant category and gain more visibility from you. It is useful to follow this. You better understand which horse to play.
- For Display Search Network ads, you should definitely follow which pages your ads are shown on. Poor performance; Exclude pages with high costs and low conversion rates from your campaign. Your ads on the display network may be shown in large numbers on gaming sites and video content producing sites and may create unnecessary costs.
- Track weekly ROAS of your Google Shopping ads. Track which products you sell the most by comparing ROAS against the previous week. If you have products that are not listed, be sure to check your Google Merchant Center account. and make up for the shortcomings. Google Shopping ads are an indispensable campaign model, especially in retail and e-commerce models. If you neglect this campaign model and do not pay enough attention to it, you will fail the class. Overhaul your bid settings by looking at your impression share metric.
- If you're running any ad testing, you should review their performance at least weekly to see how things are going and how long it takes to make a decision. Sometimes a week is enough to make a decision.
- Don't forget to check ad extensions. It's common for site links, callouts, or snippets to be disapproved.
- With day, week, and hour reports, you can track our ads' metrics such as CTR, Cost, and Conversions within specified time periods, to speed up our delivery in time slots with lower cost or CTR, or create automatic rules to pause our ads during high-cost times. In this way, you can reduce your Google Ads costs by intensifying your ads when the competition is low.
Monthly Google Ads Optimization
You may think that checking your Google Ads account daily and weekly is enough to optimize it, but it is very important to do general checks. Performing a general Google Ads audit once a month can help you catch any missed issues during your short-term Google Ads optimization reviews.
In this broader Google Ads optimization process, you should focus not only on keywords and bid performance but also on your targeting and geographic performance. Stopping or deleting underperforming campaigns, ad groups or keywords and creating new ones to replace them can improve your account performance.
Chapter 6
Optimisation Tips
We've prepared some advanced tips for you to improve ad performance and optimize your account more easily.

Consider location-focused “What's Near Me” alternatives
Especially if you have a physical store, you can focus on location-based ads in your Google Google Ads advertising campaigns. Because users are searching for services or products near them, you can create advertising content that covers areas close to your physical store or stores.
Use phone calling in mobile ads
The telephone is still a frequently used tool to provide information about your services and products and to support consumers before and after-sales. Consumers want to get a quicker solution by phone rather than texting a company. In this case, you should activate your phone number and phone call feature in your ad content in your campaigns for mobile devices while advertising with Google Google Ads.
Target and bid on competitors
In Google Google Ads advertising work, one of the works of many advertisers is to make targeting and offers for the names or keywords of competing companies. However, one of the issues that many people forget is that while making these targets, there are no competing companies that only serve over the internet.
Every company has competitors that have physical stores and do not provide services on the internet. In this case, these companies advertise on platforms such as television, radio, newspaper or magazine.
While targeting your competitors in your Google Ads campaigns, you should not only consider your competitors on the internet. You should expand the scope of your ads by physically researching the companies that do this job, by creating targeting and offers for these companies.
Find your landing pages that do well
If you've created Google Ads campaigns before, you can analyze your landing pages that yield good results and return and see which pages you get more conversions from.
You can analyze your pages that receive a lot of traffic and keep users on the page for a long time on Google Data Studio. In addition, you can analyze the pages that get the highest performance from your social media ads for this process.
After analyzing your landing pages, use these well-performing pages in your Google Ads campaigns. You can take advantage of these landing pages when directing your ads to a certain link. No matter how interesting your ad content and targeting are, if the landing pages you are redirecting to are underperforming, you will not get enough results from these pages. For this reason, landing pages also play a big role in advertising campaigns.
Focus on keywords with a certain condition
Keywords are the most important part of Google Google Ads advertising campaigns. For this reason, it is an issue that deserves special attention. Your keyword research, it will help you increase the performance of your ads if you turn to keywords that include a certain condition or action rather than specific and only product-containing word groups.
For example, when you sell shoes, your main keywords will centre around shoes. Like sneakers, and red shoes. However, you can add a certain condition and action to your keywords to further refine them. Turning to keywords with different conditions and search volumes such as “summer shoes”, walking shoes, wedding shoes” will also help you increase the results you will get. You can also use long-tail keywords to take this to the next level. We will discuss this in the next article.
Use long-tail keywords
Long-tail keywords also increase conversions in Google Google Ads ad campaigns. Long-tail word groups are used by users who have reached a certain decision stage in the purchasing process and are closer to purchasing, so they give effective results in Google Ads campaigns.
For example, let's say you sell textiles. Here, a keyword like “red dress” is suitable for general search results. However, when you use it as a long tail and use it in different alternatives such as “red summer dress, red wedding dress, red kimono with straps”, you have the chance to reach users who make a more specific and specific search.



![How to use Google Ads for Your Business? [Guide]](/content/images/size/w720/2022/03/google-ads-for-your-business.svg)