Google Data Studio Tutorial 2022
What is Google Data Studio?
Google Data Studio integrates with various data platforms to create more visually appealing, easy-to-use dashboards that clearly represent your goals. These dashboards are more visually appealing than those created in Analytics, and you may include additional widgets as well.
Here is an article on Google Data Studio introduction with a detailed background, click here to check it out!
What is Google Data Studio for?
- Analyze data
- Monitor performance metrics
- Display results
Data Studio is one of the numerous Google Marketing Platform products that allows marketers to generate complete visual reports and dashboards based on their data.
We use Google platforms for a variety of projects, such as tracking SEO with Analytics and developing paid search ads with Ads.
How does Google Data Studio Works?
Google Data Studio is organized into four main block of features that include integration, transformation, visualization, and sharing of data. Let's look into what its primary features are.
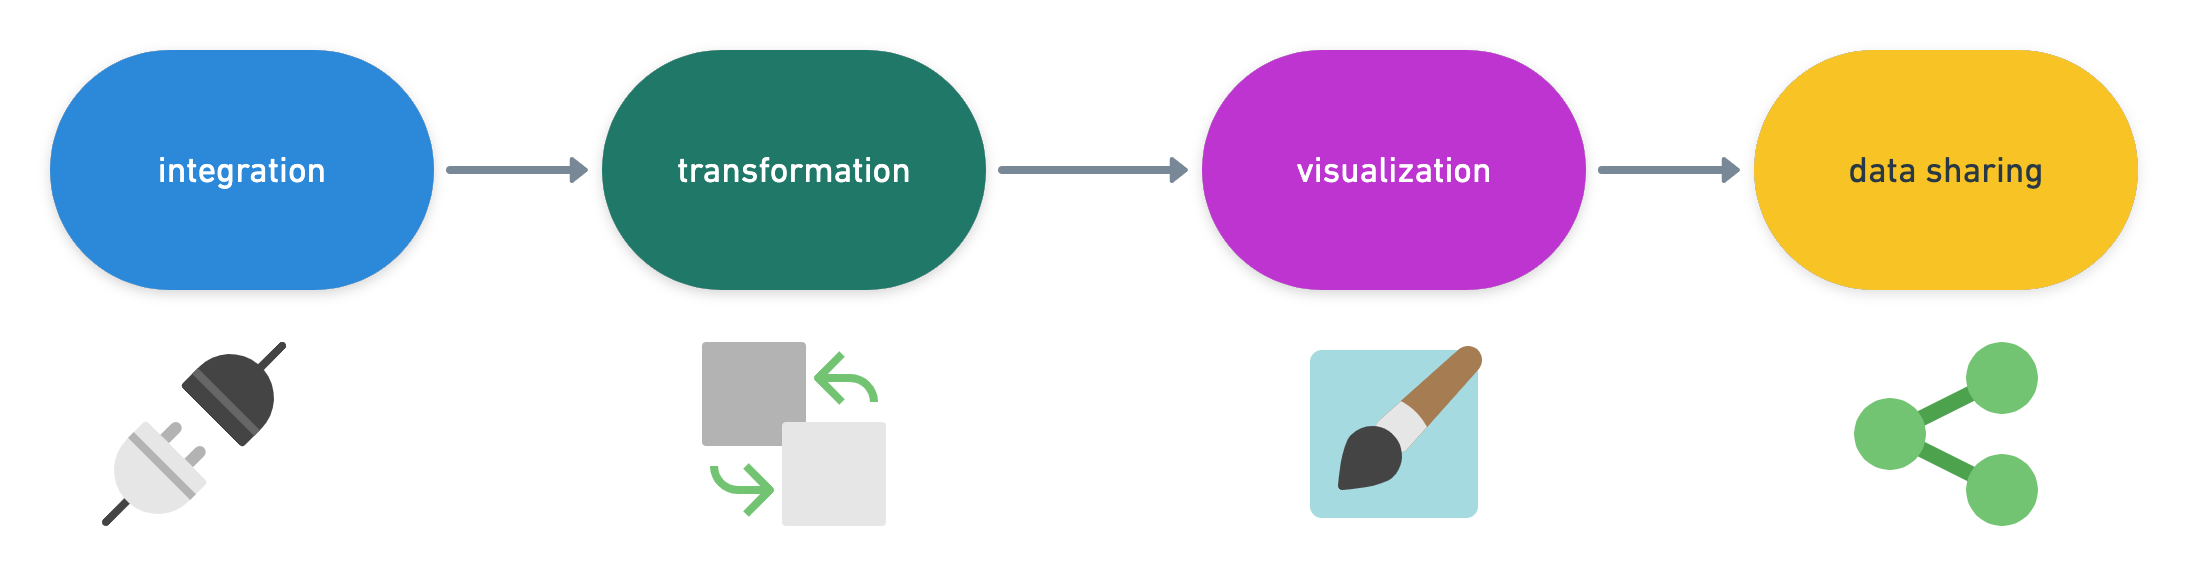
Integration: Google Data Studio uses data connectors to gather data from different platforms and combine all of it.
Transformation: Google Data Studio's second stage will change raw data in to precise and valuable data. Unstructured numbers can be insignificant and can be difficult to comprehend, isn't it? That's why Google Data Studio tries to transform the data into simpler elements, that can be used to generate information to be used in tables and graphs. These data then turn into intelligence for your company.
Visualisation: The visualization of data is the making of dashboards and reports. In this case, the data is converted into tables, graphs and maps, as well as additional visual tools. It is therefore possible to present the information in a more attractive and understandable manner.
Data Sharing: Finally, Google Data Studio allows users to share reports and data. Users can be invited to access or modify the dashboards, depending on the access level you've specified. Collaboration is possible, and other team members can collaborate on the identical reports. The changes are automatically saved, similar to how Google Drive works, for instance. This permits instantaneous collaboration.
Advantages of Google Data Studio
- User friendly
- Supports many metrics
- More built-in free connectors compared to other BI tools
- Free of charge (except 3rd part connectors)
- Interactive
- Cloud-based, easy to share
Data Studio's main advantage is that it is incredibly user-friendly. While it may not be as powerful as some other products on the market, it is simple to understand, and Google provides numerous tutorials to assist you in creating thorough reports.
As previously said, it supports more metrics than Analytics, which is significant if you have more to say than the few widgets available on the Analytics dashboard.
Is Google Data Studio free?
Yes, Google Data Studio is free.

This is one of the biggest advantages of Google Data Studio. In order to visualize and analyze data on a dashboard, you'll need to connect it to your report. For that, data connectors needed. Good news is that there are +250 free of charge pre-built connectors which help you start using GDS right away. However, you might need to consider spending budget on 3rd party connectors because for some data sources like Facebook Ads, Tiktok Ads etc. there are no built-in connectors.
Calculated Metrics and Dimensions
You can do calculated metrics and dimensions in the same way that you can in a spreadsheet. For instance, if you want to examine the overall conversions across all of your campaigns, you may use Data Studio to develop a formula.
Blended Data
Blended data is the another significant advantage of Google Data Studio. Your charts will only be drawn from a single data source by default. A blended data source, on the other hand, allows you to construct charts from multiple data sources. For example, if you needed conversions from campaigns other than Google Ads, you could construct a blended data source and include Facebook conversions as well.

If you are interested more about advantages of Google Data Studio, you should definitely check out our blog on "Pros and Cons of Google Data Studio".
Google Data Studio vs. Tableau
Shall we choose Google Data Studio or Tableau?

In our opinion, you should choose Google Data Studio. Here is why, in this article, we will compare both solutions and we hope that this will help you decide.
Step-by-step Tutorial to Start Using Google Data Studio

Creating an account and getting started
As long as you have a Google account, it will be easy and swift to create a Google Data Studio Account and start working. Click below to read on how to create a Google Data Studio Account.
In this article, you will be able to learn how to login Google Data Studio and how to access Google Data Studio as well.
First look at the Google Data Studio
Let's have look into main elements and sections of Google Data Studio panel. In this article you can find basic elements of the panel.
How to connect a data source to Google Data Studio?
When you create a new report in Data Studio, you either add an existing data source, or create and add a new one. You can add more data to the report at any time.
Here's how data sources fit into the big picture of Data Studio: click here for the article.
How to add a page to Google Data Studio
One of the brilliant functions of Google Data Studio is to be able to create several pages. You can consider different data sources for each page or sometimes you might want to break down elements in less number of chart to increase readability.
Let's read more about adding pages, click here for more.
How to share reports in Google Data Studio
Sharing is probably one of the most useful functions of Google Data Studio. For many years, we shared a copy of a spreadsheet or slide presentation, they didn't have any sync function or collaboration whatsoever. With Google Data Studio, these days are over!
Read more about sharing reports in Google Data Studio:
How to Color your reports?
We all used spreadsheets once in our lives. Most of us use them still. Sure, they are very efficient and right to the point. But aren't they boring? A little colour and a touch of art might create wonders. And by wonders, we mean easier to read and appealing dashboards!
Click here to learn how to add color to your reports:
How to use dimensions vs. metrics in Google Data Studio
Dimension and metrics are 2 main data source types or field types. We are explaining these field types in detail, click here for more.
Chart Types in Google Data Studio

Google Data Studio can assist in turning data into visually appealing reports that are suitable for your target public. Various types of charts are available in the panel.
You can see below a list of the most popular chart types in the Data Studio tool. I will also give you some techniques for creating more efficient dashboards with Data Studio.
- Table Charts
- Pivot Tables
- Times Series & Area Charts
- Pie Charts
- Scorecards
- Map Charts
- Bar Charts
- Scatterplot and Bubble Charts
- Line and Combo Charts
- Bullet Charts
- Tree Map Charts
Use Google Data Studio like a pro!

Data Studio has gone from being a buggy interface to Google Analytics dashboards to becoming a BI tool that competes with the Power BI and Tableau – but like any Google product, knowing a few hacks and tricks means it is far more powerful than it first appears.
Steps which explained above will assist you in starting but you can accomplish more using Data Studio. For instance, if you would like to add the summary page of the report you could add more pages to one report or make use of formulas to build more sophisticated dimensions. Try out filters and calculated fields. You can also create adaptive chart filters that let you display data for a specific dimension in every chart. It can be accomplished by selecting a dimension from the graph or chart.
It is recommended to begin by creating an initial report that includes the various campaigns you run and then try blending and other more advanced options to improve the quality of your report. The most important thing to remember is that you must concentrate on your target audience. Also, it makes sense to structure your dashboard or report around at least two KPIs. You'll be able to highlight your accomplishments as well as help the report to comprehend for your readers.
Below you can find several advanced practiced to get more from Google Data Studio;
- Working with Google Data Studio filters
- How to use reference lines in Google Studio
- Using community visualizations in Google Data Studio
- How to create CASE statements in Google Data Studio
- How to blend data in Google Data Studio
- How to work with date in Google Data Studio
- How to use parameters in Google Data Studio
What’s next?

We're not able to explain all in one article however, we hope that you've enjoyed the Google Data Studio tutorial to provide a useful beginning point. There's so much more Google Data Studio has to provide, and we don't wish to make you stop here.
For those who want to dive deeper we suggest taking a look at the topics being discussed on Data Studio Community. Data Studio Community. We wish you a happy dashboarding!
We hope that this overview of Google Data Studio empowers you to be more confident designing reports that are customized for your customers and for your brands.