Facebook Ads Desktop Budget Pacer
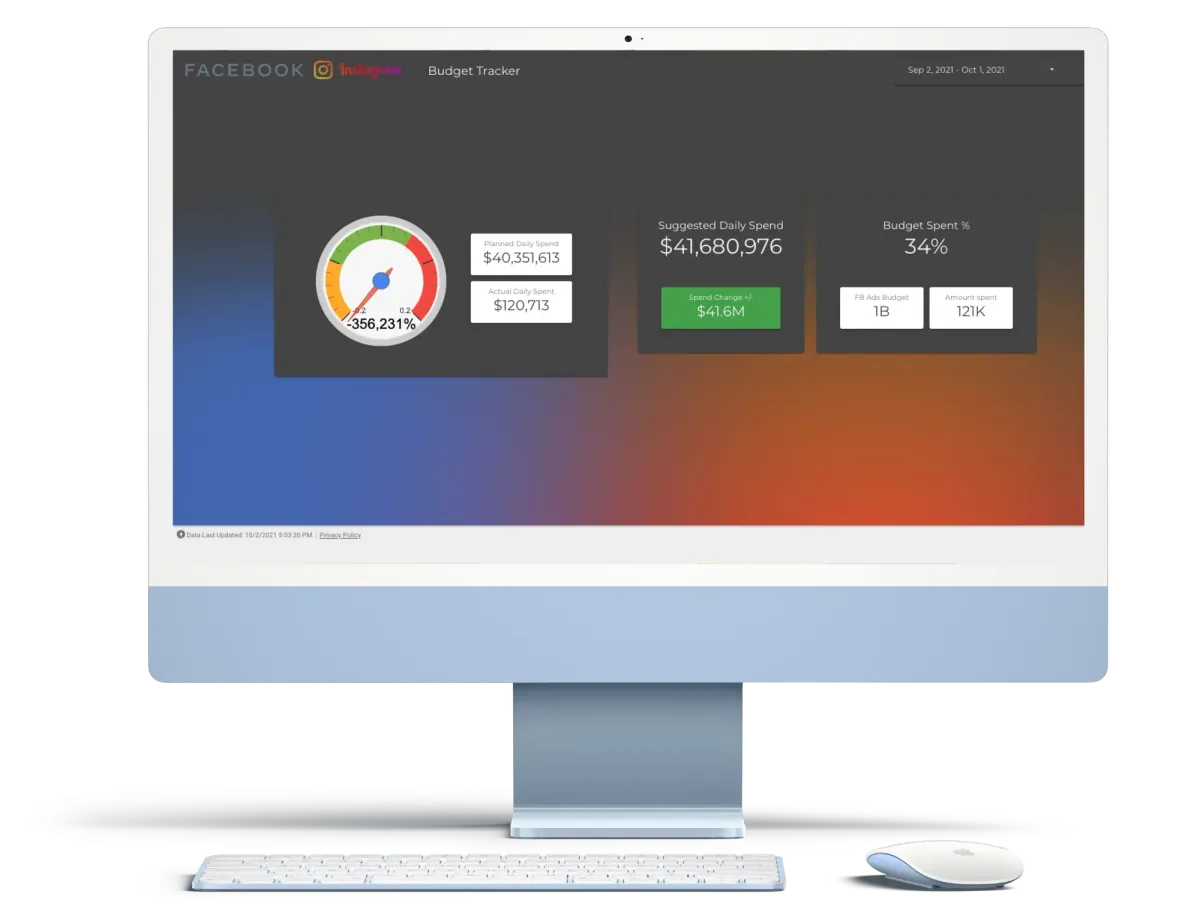
This is a Google Data Studio dashboard which works with Facebook Ads account or accounts. This dashboard visualise raw and un-processed Facebook Ads data, blends it with your custom ad budget data and acts as an interactive ad budget calculator.
For Whom?
The Facebook Ads Desktop Budget Pacer is for agencies, digital marketing professionals and social media ads experts whose goals are:
- staying at the top of key budget metrics,
- assessing historic budget data and ad spend data,
- forecasting ad spend for upcoming days or terms.
What You Will Get?
You will get ownership of Facebook Ads Desktop Budget Pacer. After connecting Facebook Ads accounts and enter your custom ad budget value as parameter, you will be ready to use it.
💡 Google Data Studio does not come with a native data connector like with Google Ads or Google Analytics. A 3rd party community connector subscription will be needed and should be purchased separately.
Possible Usage
This dashboard is the ultimate ad spend and budget analyzer. With this dashboard, you will able to see how much you have spent from you ad budget, how much can you spend and how much you should spend in the upcoming days.
It will save you time of recurring calculations and hasty mistakes by human error.
Included Dimensions and Metrics
This dashboard includes all the important dimensions and metrics, such as;
- Gauge showing budget spent percent
- Planned daily spend
- Actual daily spend
- Suggested daily spend
- total budget spend ratio
- Decided Facebook Ads budget
- Total spend up to date
Design and Sections
This is an elegant dashboard without many tables and scorecards to distract you from the main focus; how much have you spend and how should you plan your future ad spend. There are 3 main sections:
Pacing gauge and daily spend values
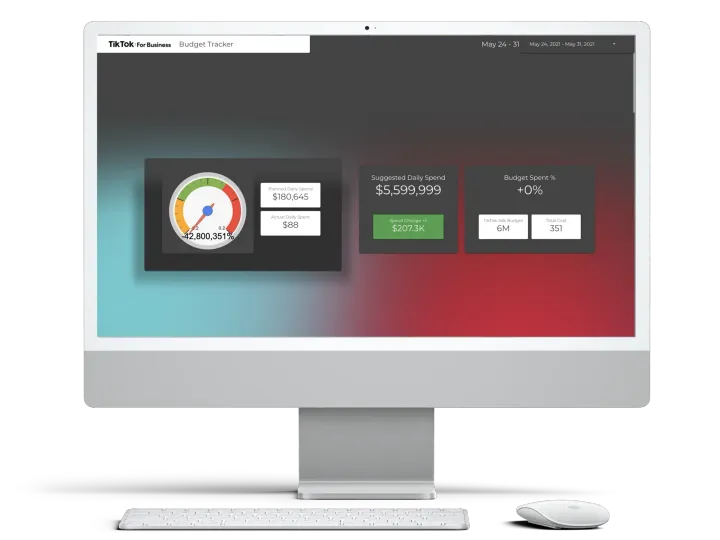
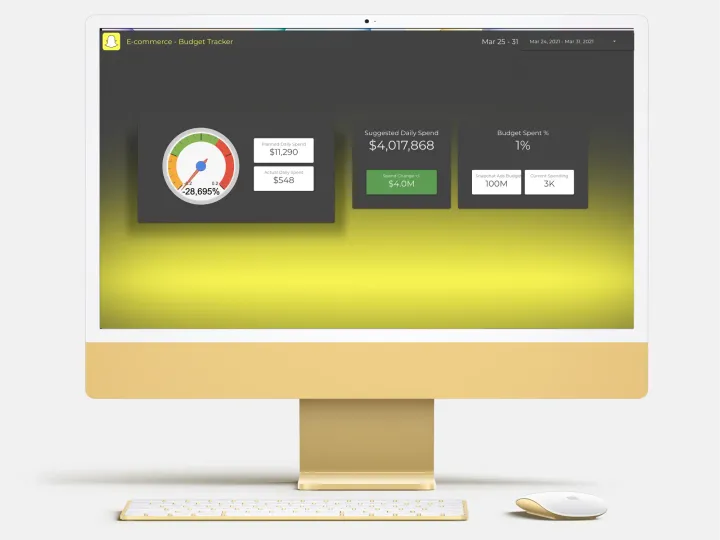
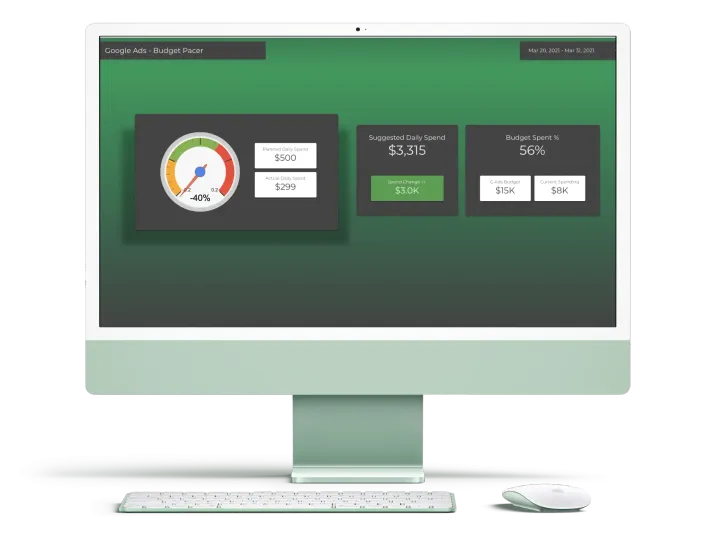
This is the main focus section of the Facebook Ads Desktop Budget Pacer dashboard. Big gauge represents how much you spend so far into that term and next to it, there are planned daily spend and actual daily spend values. This section will show you what you have planned and what you have done.
Suggested daily spend
This box show how much you should spend on upcoming days to balance your budget and the amount of the increase. For example, if your monthly budget is $1.000, you spend $900 until 20th day, then this box will tell you to spend $10/day.
Budget spend %
This box reminds you the ratio of budget spent so far, how much was the planned budget and how much has spent.

