Google Analytics 4 E-commerce Dashboard Template

We created a Google Analytics 4 E-commerce Dashboard Template that helps manage and understand the e-commerce data provided by Google Analytics. Our template includes acquisition, e-commerce and product KPIs which are great indicators to help grow your e-commerce store!
You can watch the following walkthrough video:
Prerequisites to use this dashboard
First of all, we need some requirements to use this Google Data Studio dashboard template:
- You should have a Gmail account connected to a Google Analytics account already.
- You should implement Google Analytics 4 Ecommerce data collection in your store to use the full power of this Google Data Studio template.
Have both? Let's start our tour then.
What you will find in this dashboard?
I'll walk through all the pages together with you and explain how we are using these pages to optimise our client businesses.
Revenue Drivers
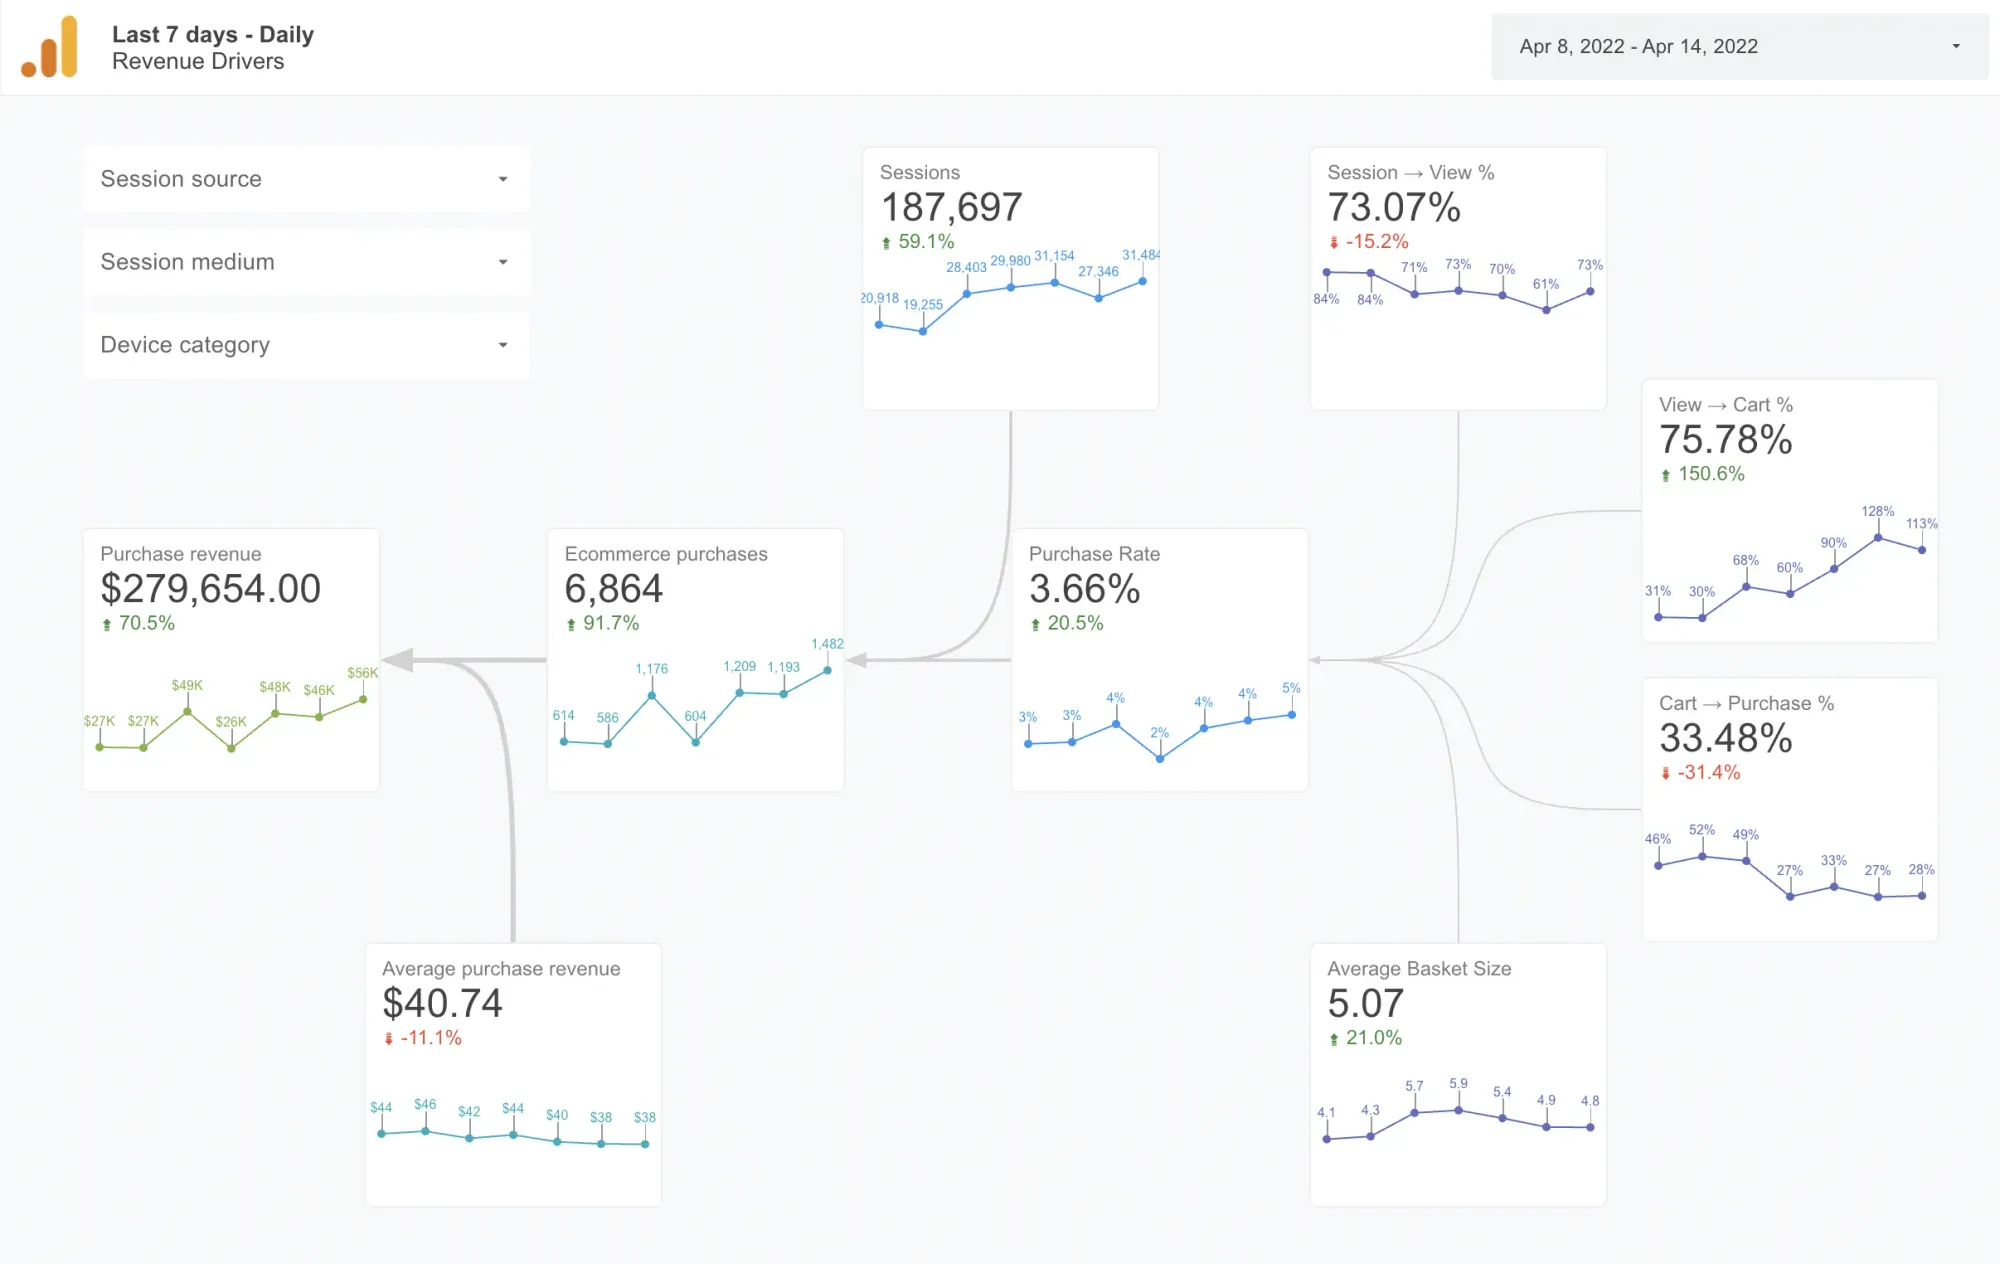
We added a simple KPI tree to give you insight into how e-commerce metrics work together at a glance.
We named this concept"Value Drivers". I can explain this briefly:
- There is one NorthStar KPI. In the below example, it is "Purchase Revenue"
- And there are drivers which affect the main KPI in a good or bad way. "Ecommerce purchase" and "Average purchase revenue" 2 drivers for "Purchase revenue".
You can add more micro drivers. The purchase rate has 4 drivers for example:
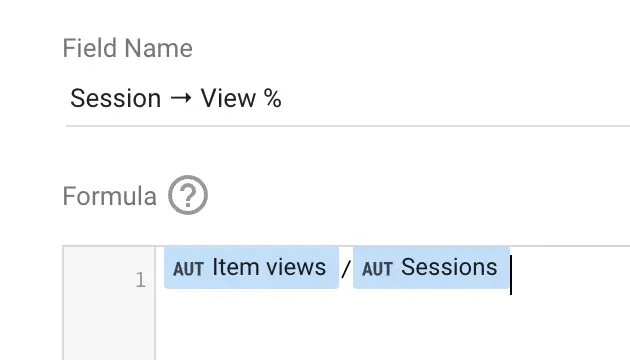
- Session → View %
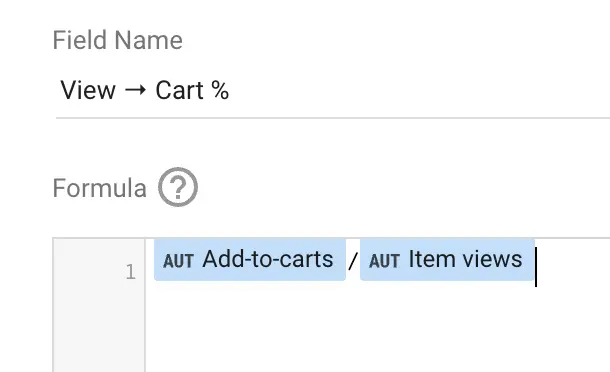
- View → Cart %
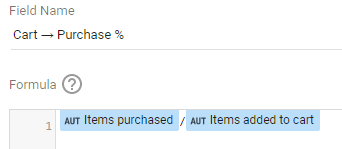
- Cart → Purchase %
- Average basket size
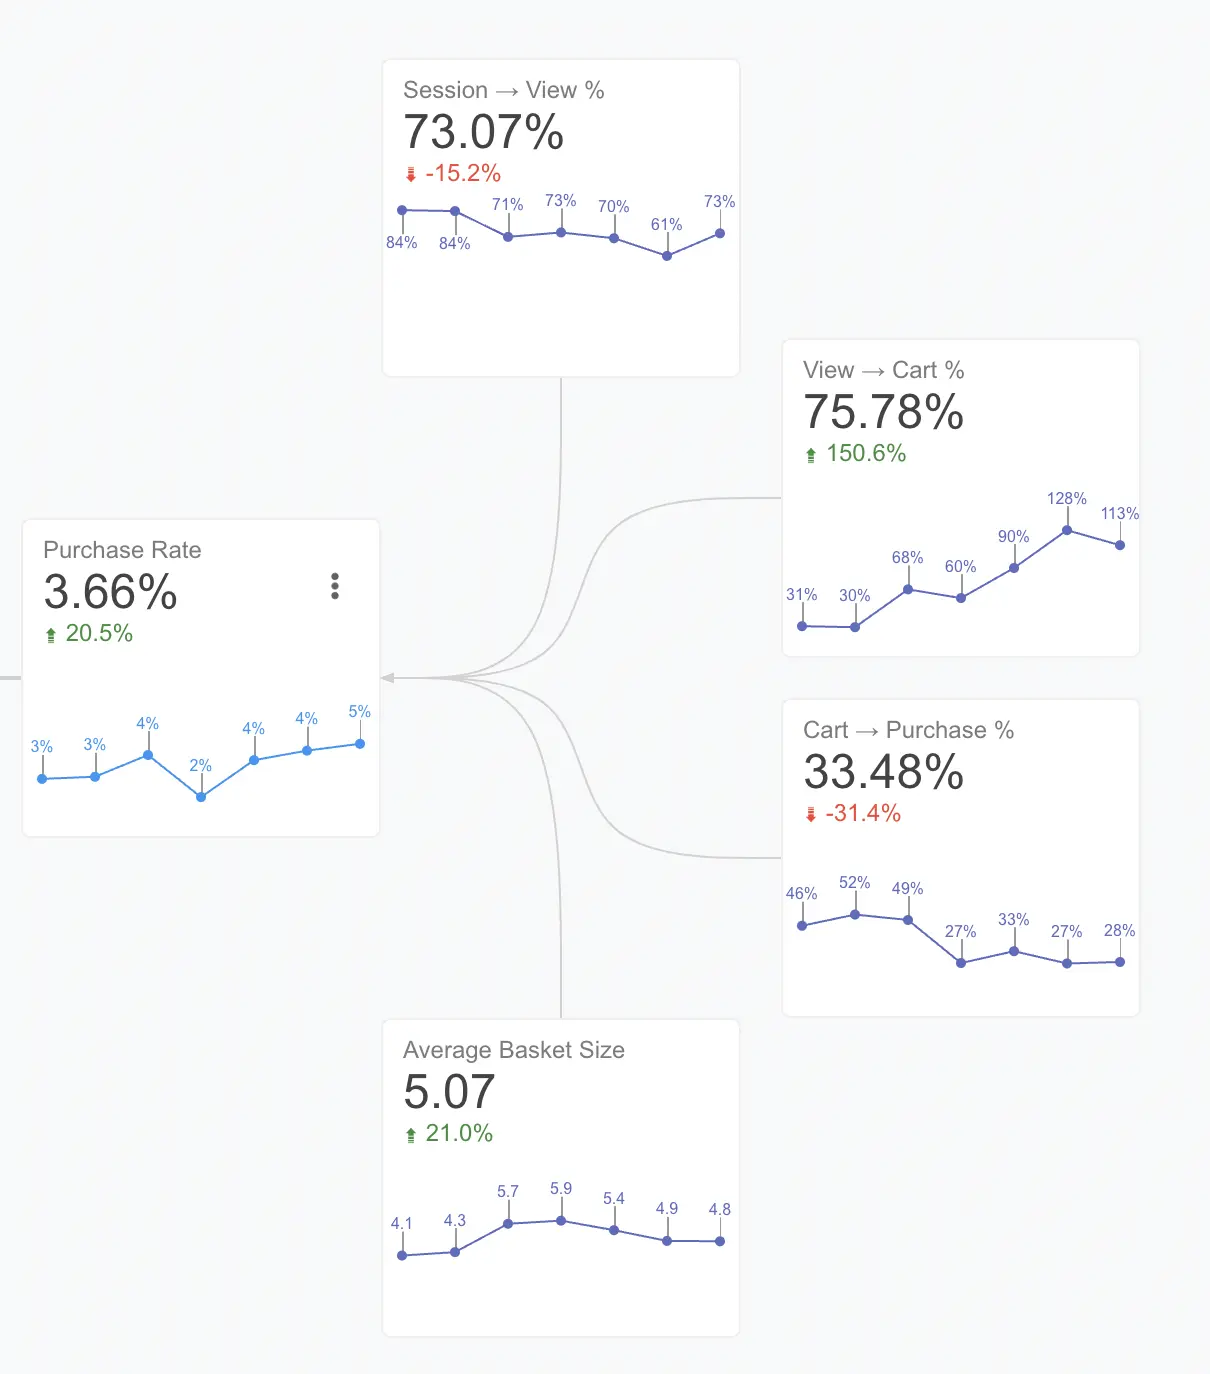
If the main KPI has a poor performance, you can look at the drivers to find the root cause instantly. This concept will save you tons of time when digging the data so, you can focus on growing your business instead.
Acquisition Analysis
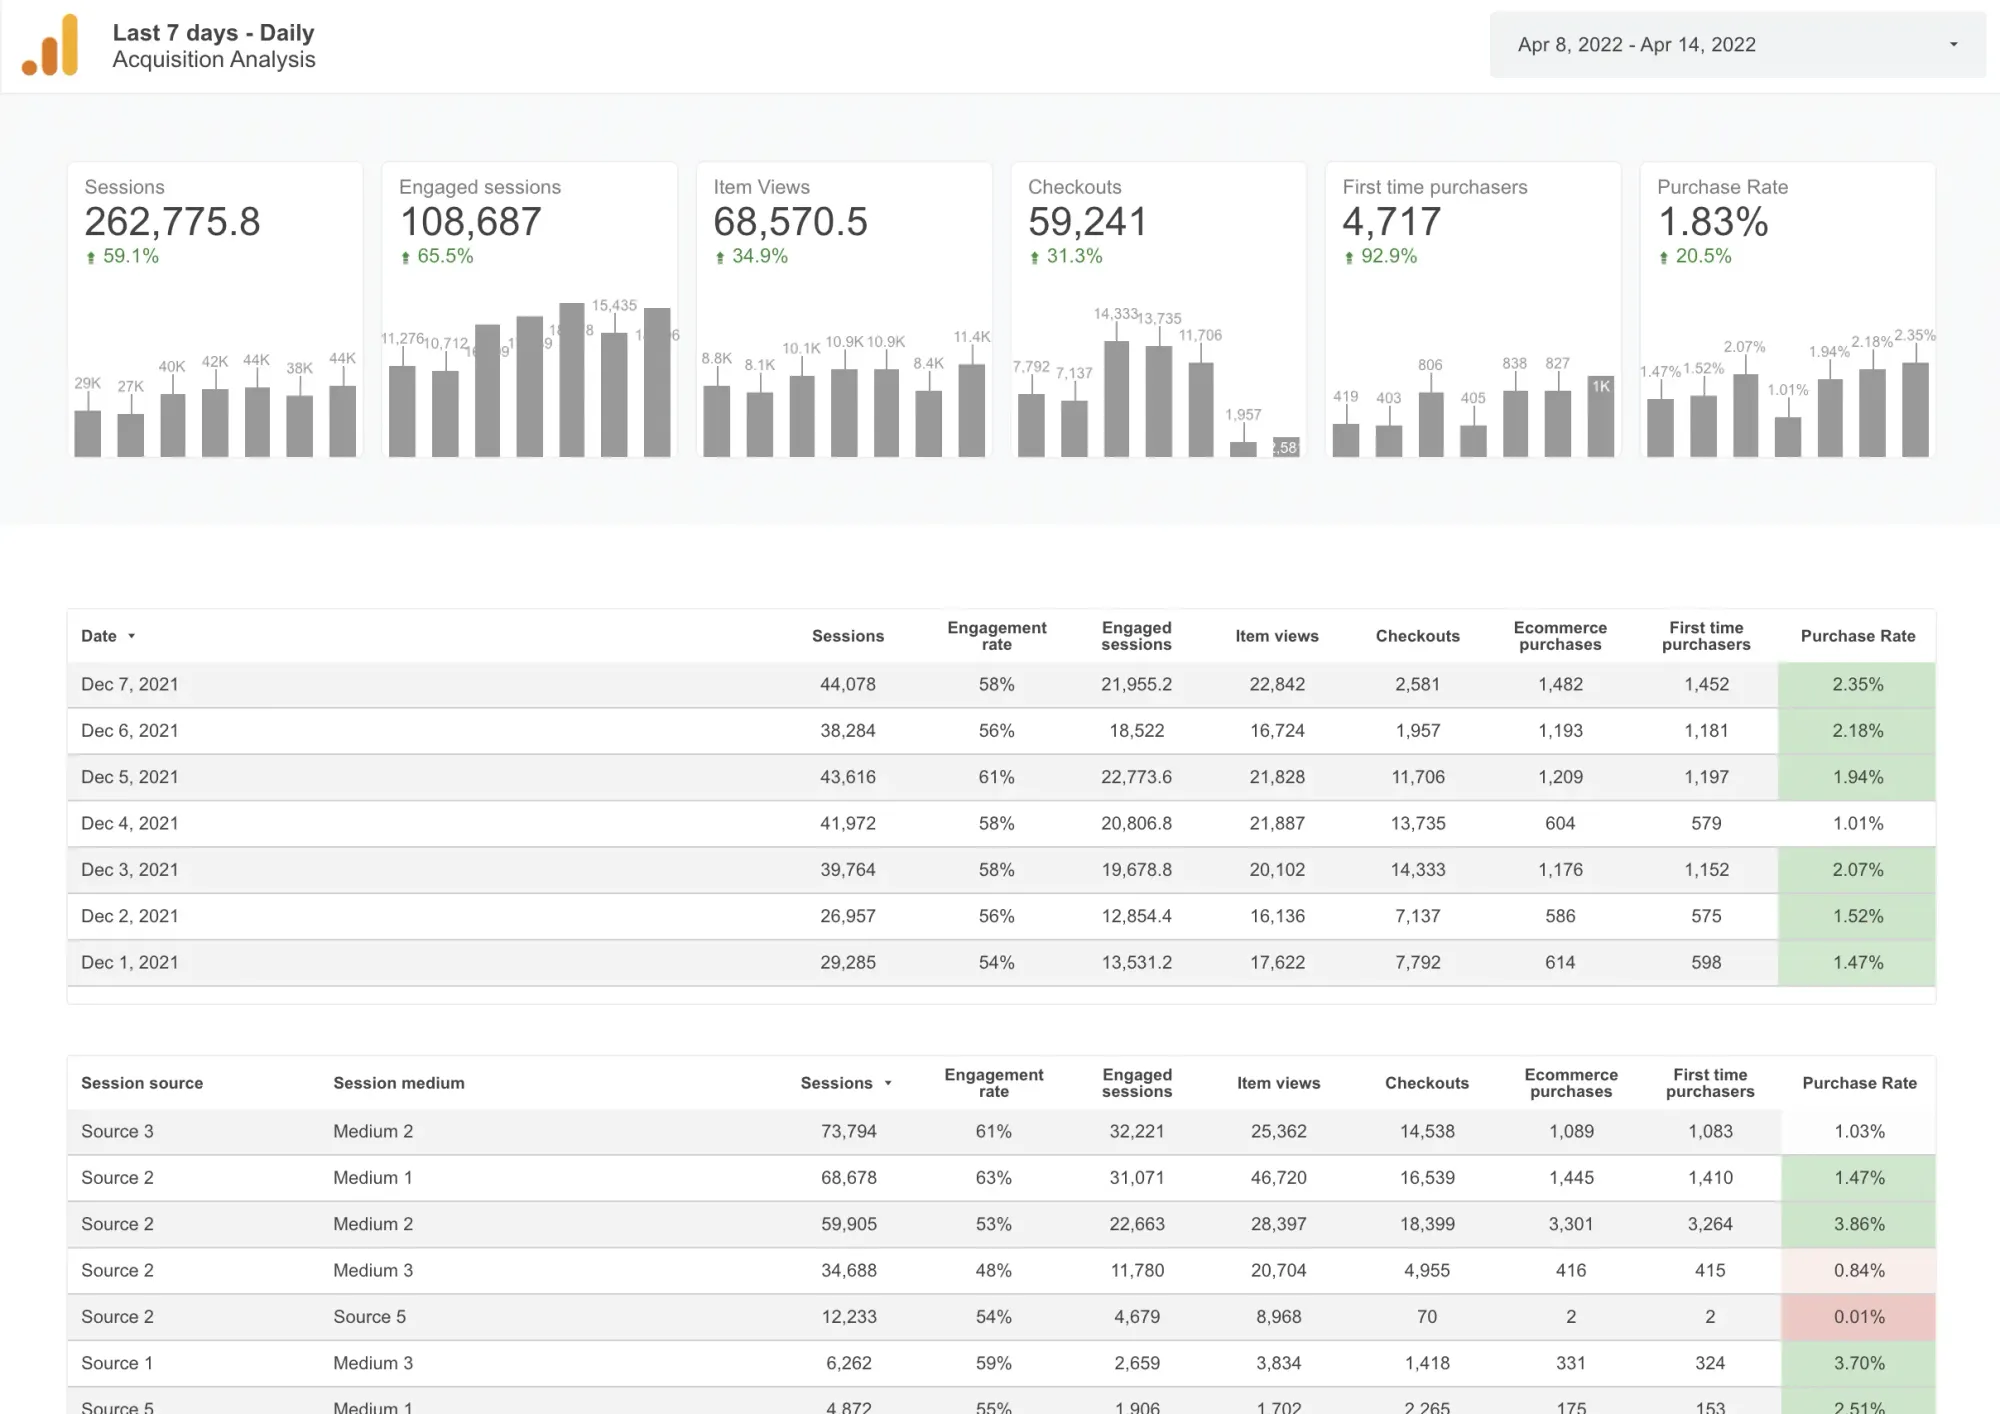
This is the page I'm looking for mostly to keep my eyes on the acquisition channels. You will find the following metrics on this page:
- Sessions
- Engagement Rate and Engaged sessions: To understand the relevance of the traffic.
- Item Views and Checkout: Traffic acquisition and commerce have an interlocking structure which makes it difficult to track the performance of each. That is why we are tracking the basic funnel metrics on this dashboard to oversee the business.
- E-commerce Purchase and Purchase Rate: Despite the branding campaigns, the ultimate single target for user acquisition is to sell them our product.
How to filter the dashboard?
We like adding features without complicating the dashboard itself. The filters are a great example.
We don't use the dropdown filter mostly. Instead, every table has a filter option to allow you to deep dive into the data if you need it right away. Let me explain.
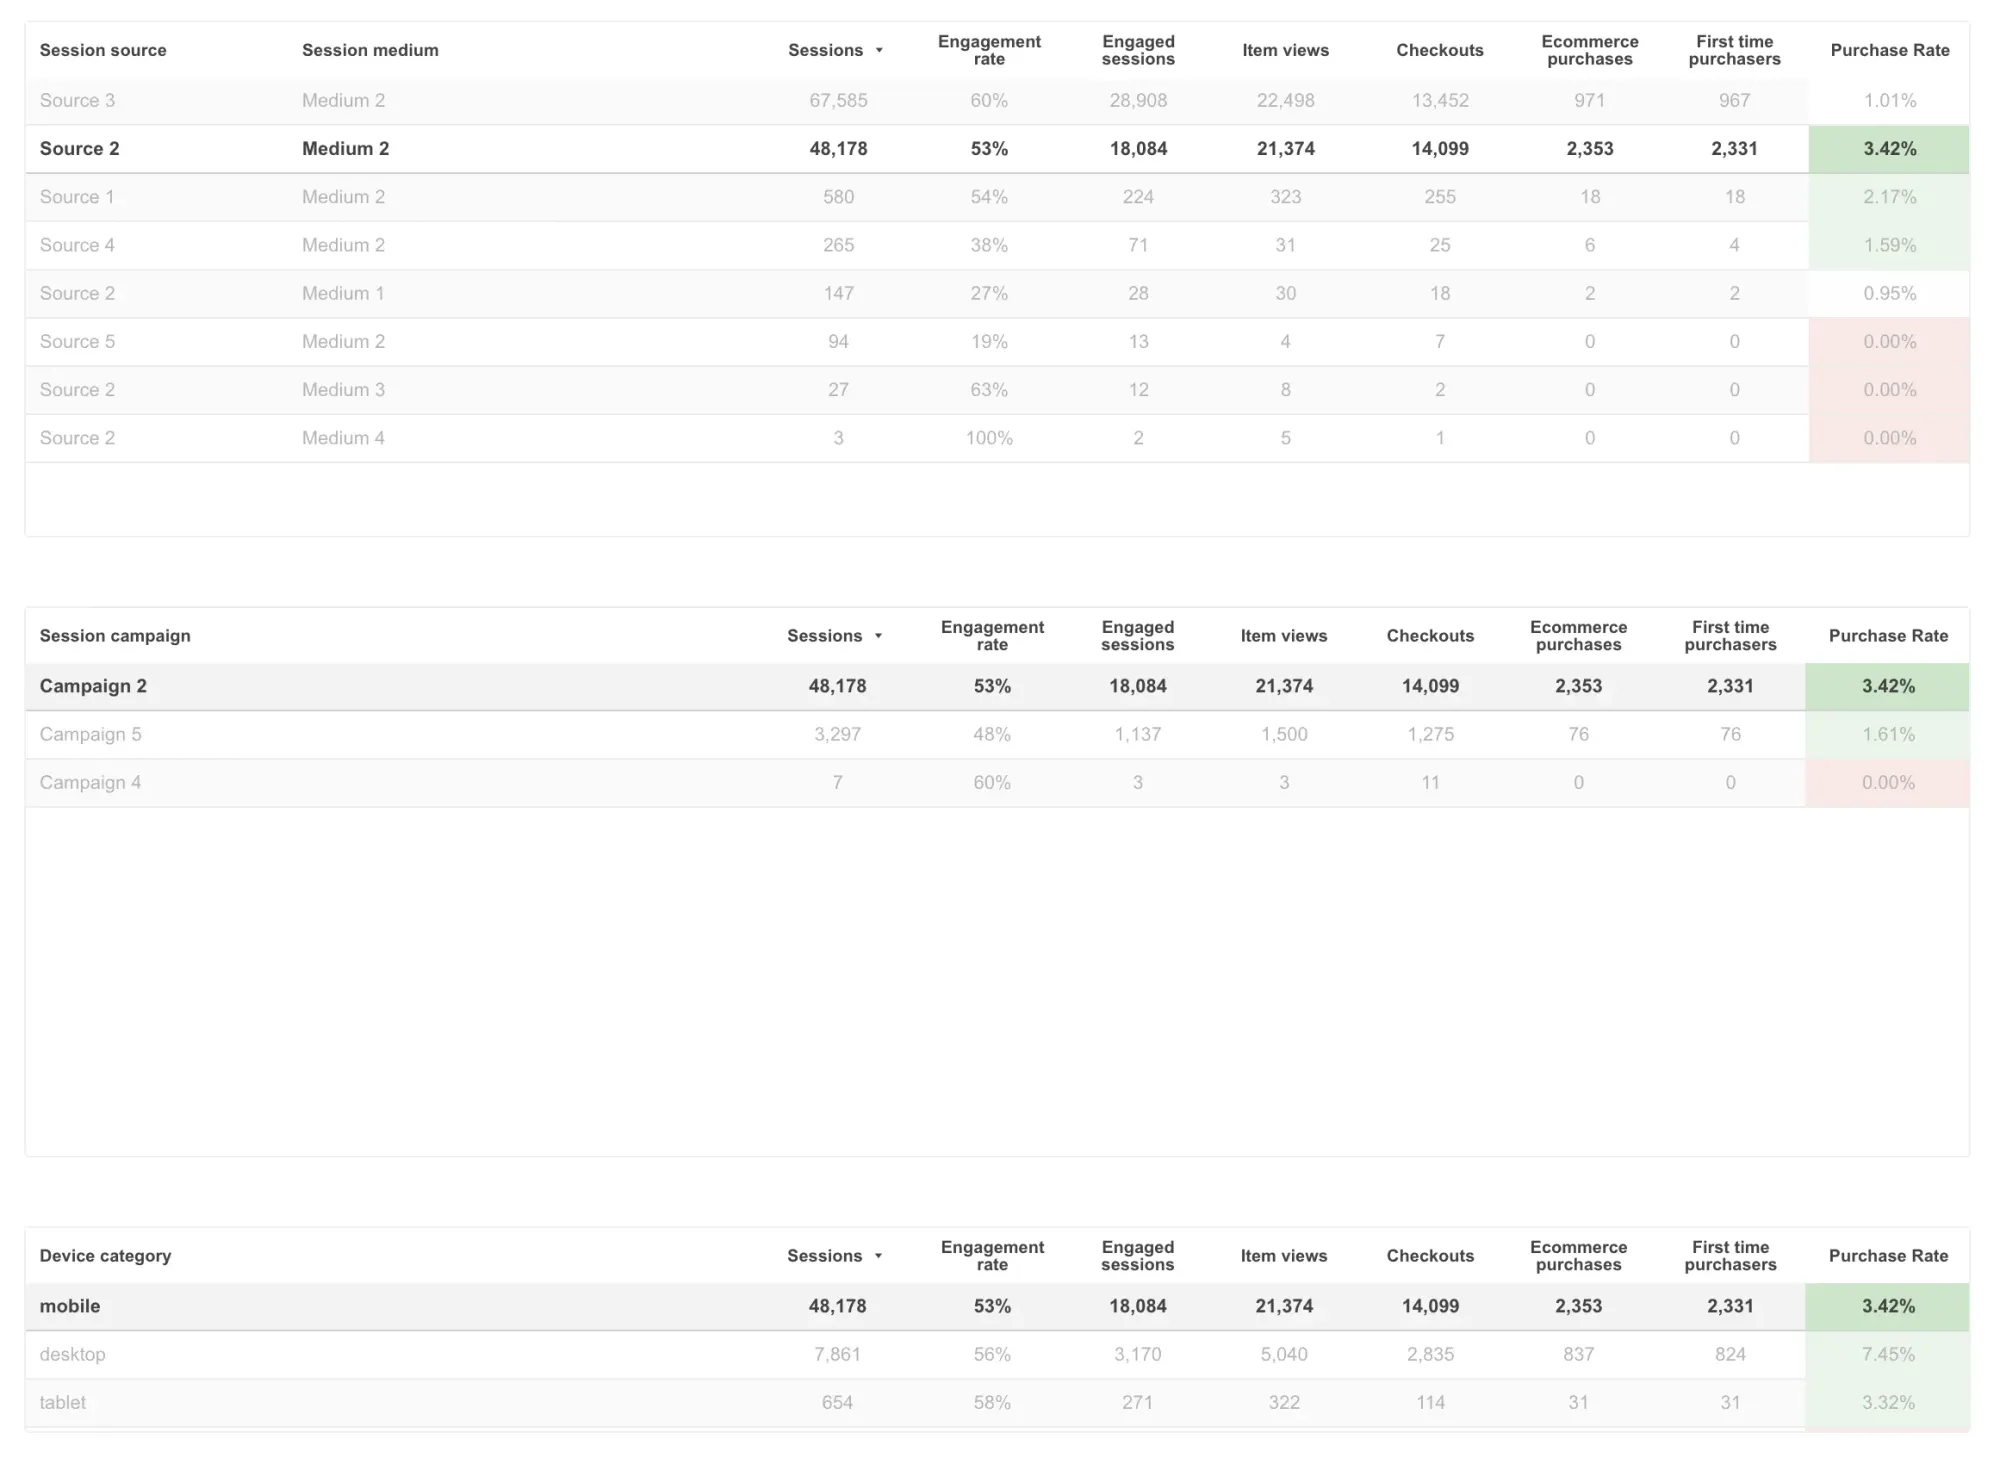
Below is the acquisition performance page. You can see the overall metrics and trends at the top. You are seeing a Purchase Rate uplift recently and want to know the reason for this.
You scroll a bit and see Source 2 / Medium 2 has a great Purchase Rate metrics and is curious about the trend of this source.
At this moment, click on Source 2 / Medium 2 to filter the whole page. Now, you can see the trend of the most important KPIs filtered by this traffic source only.
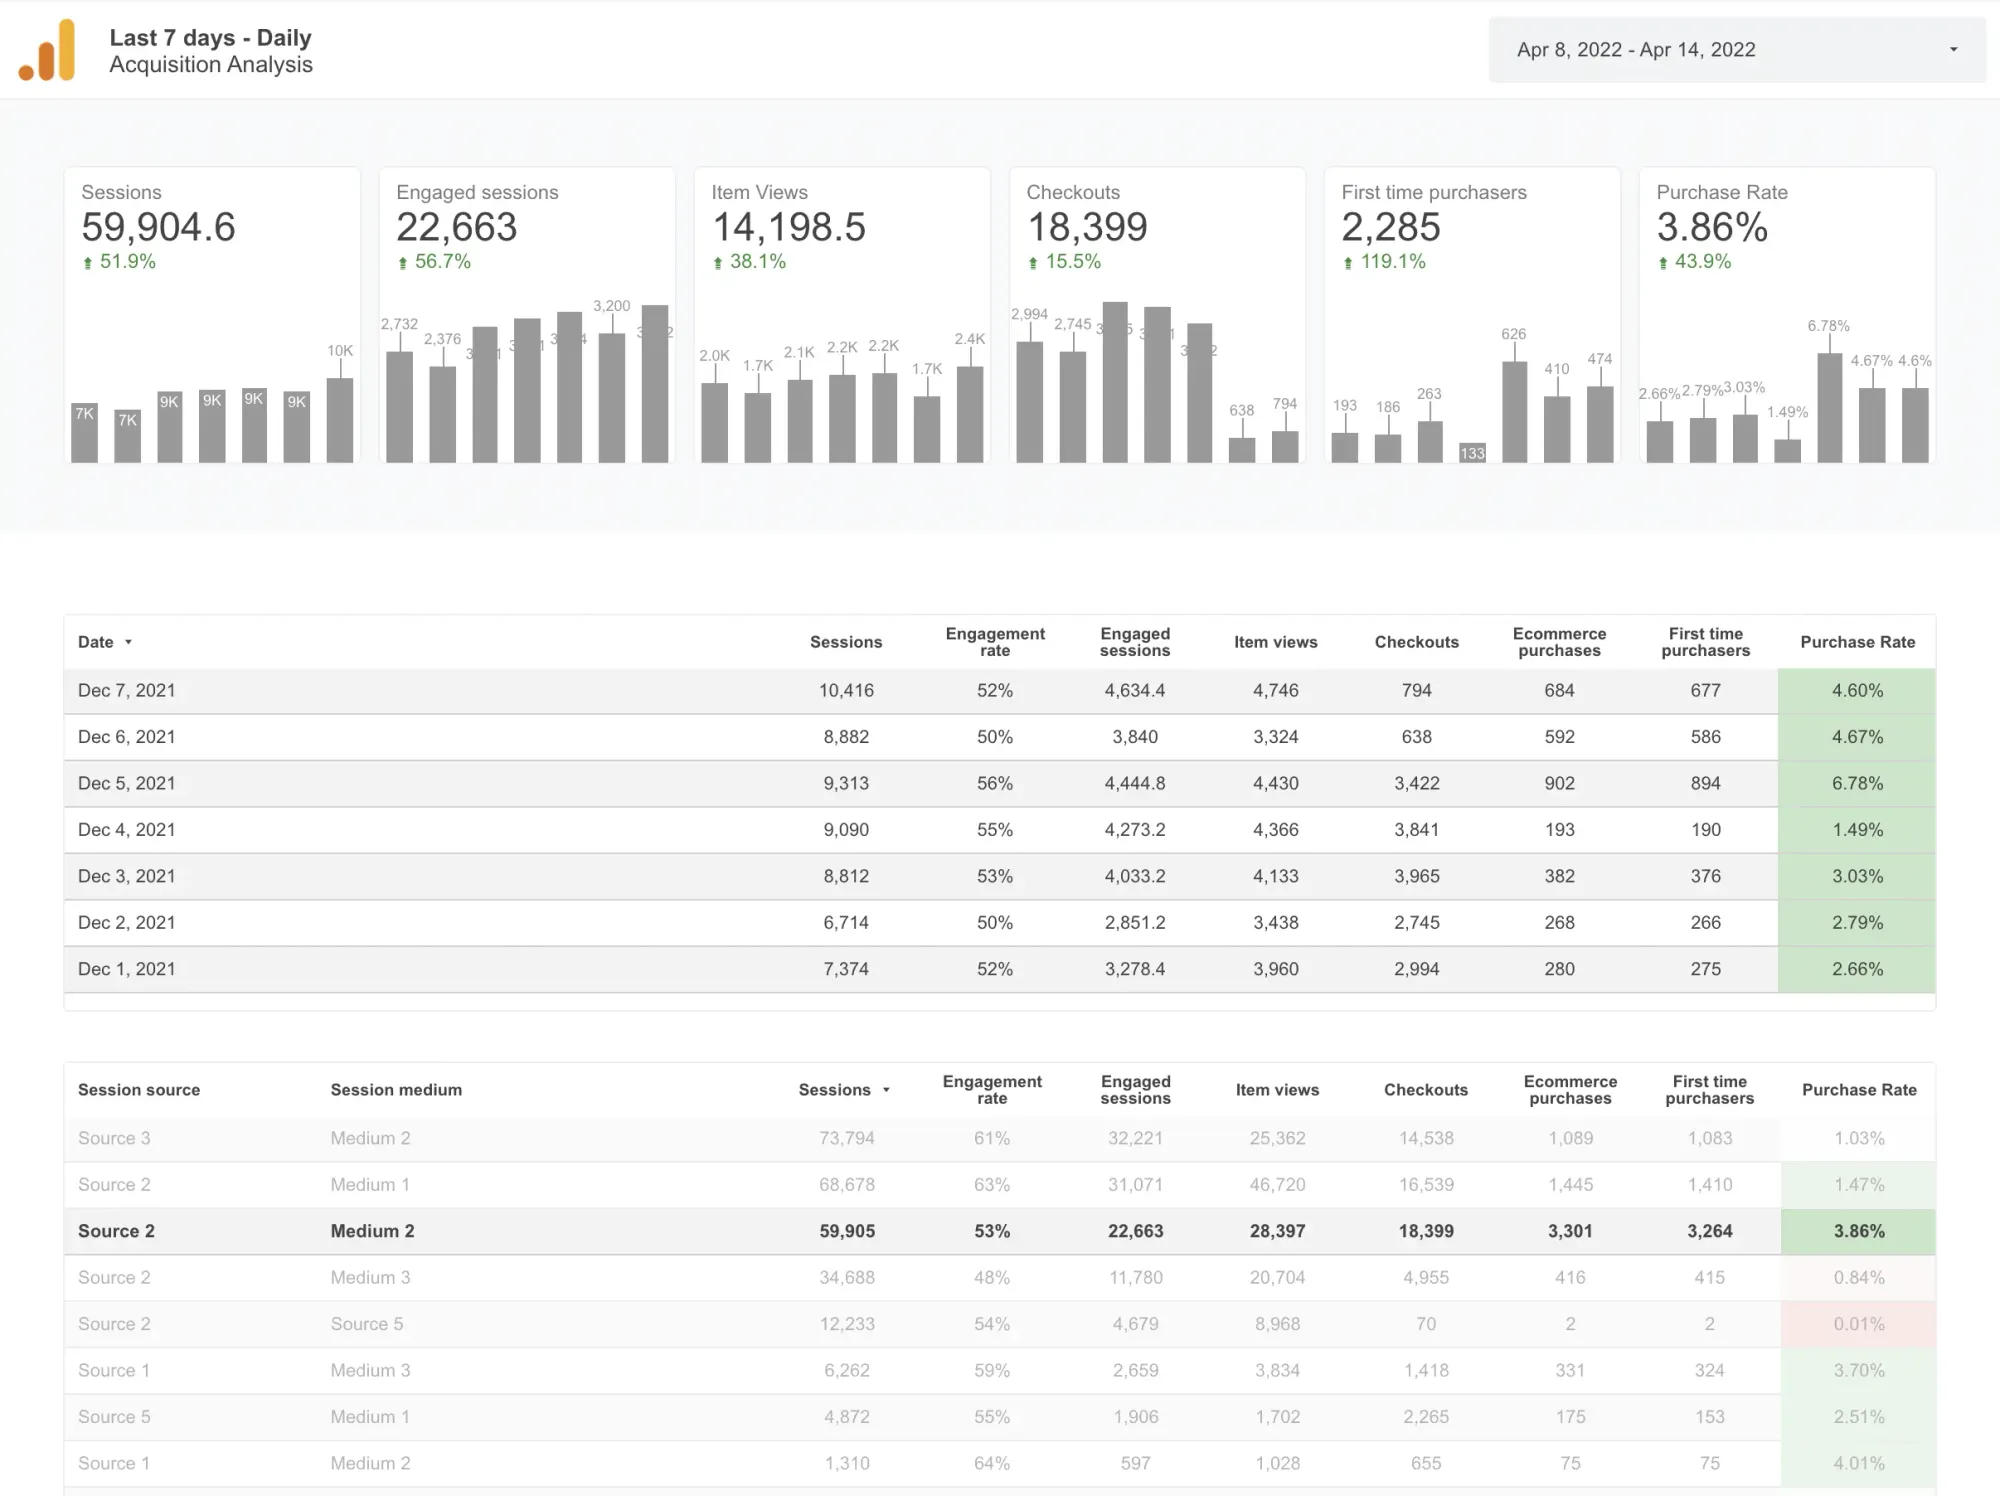
There are plenty of tables beneath the topline metrics. The magic is that you can click on every table to mix the filters. For example, you can filter mobile sessions that come from Source 2/ Medium 2 and Campaign 2 like the below screenshot.
This feature will give you the utmost flexibility while looking at your data.
E-commerce Performance
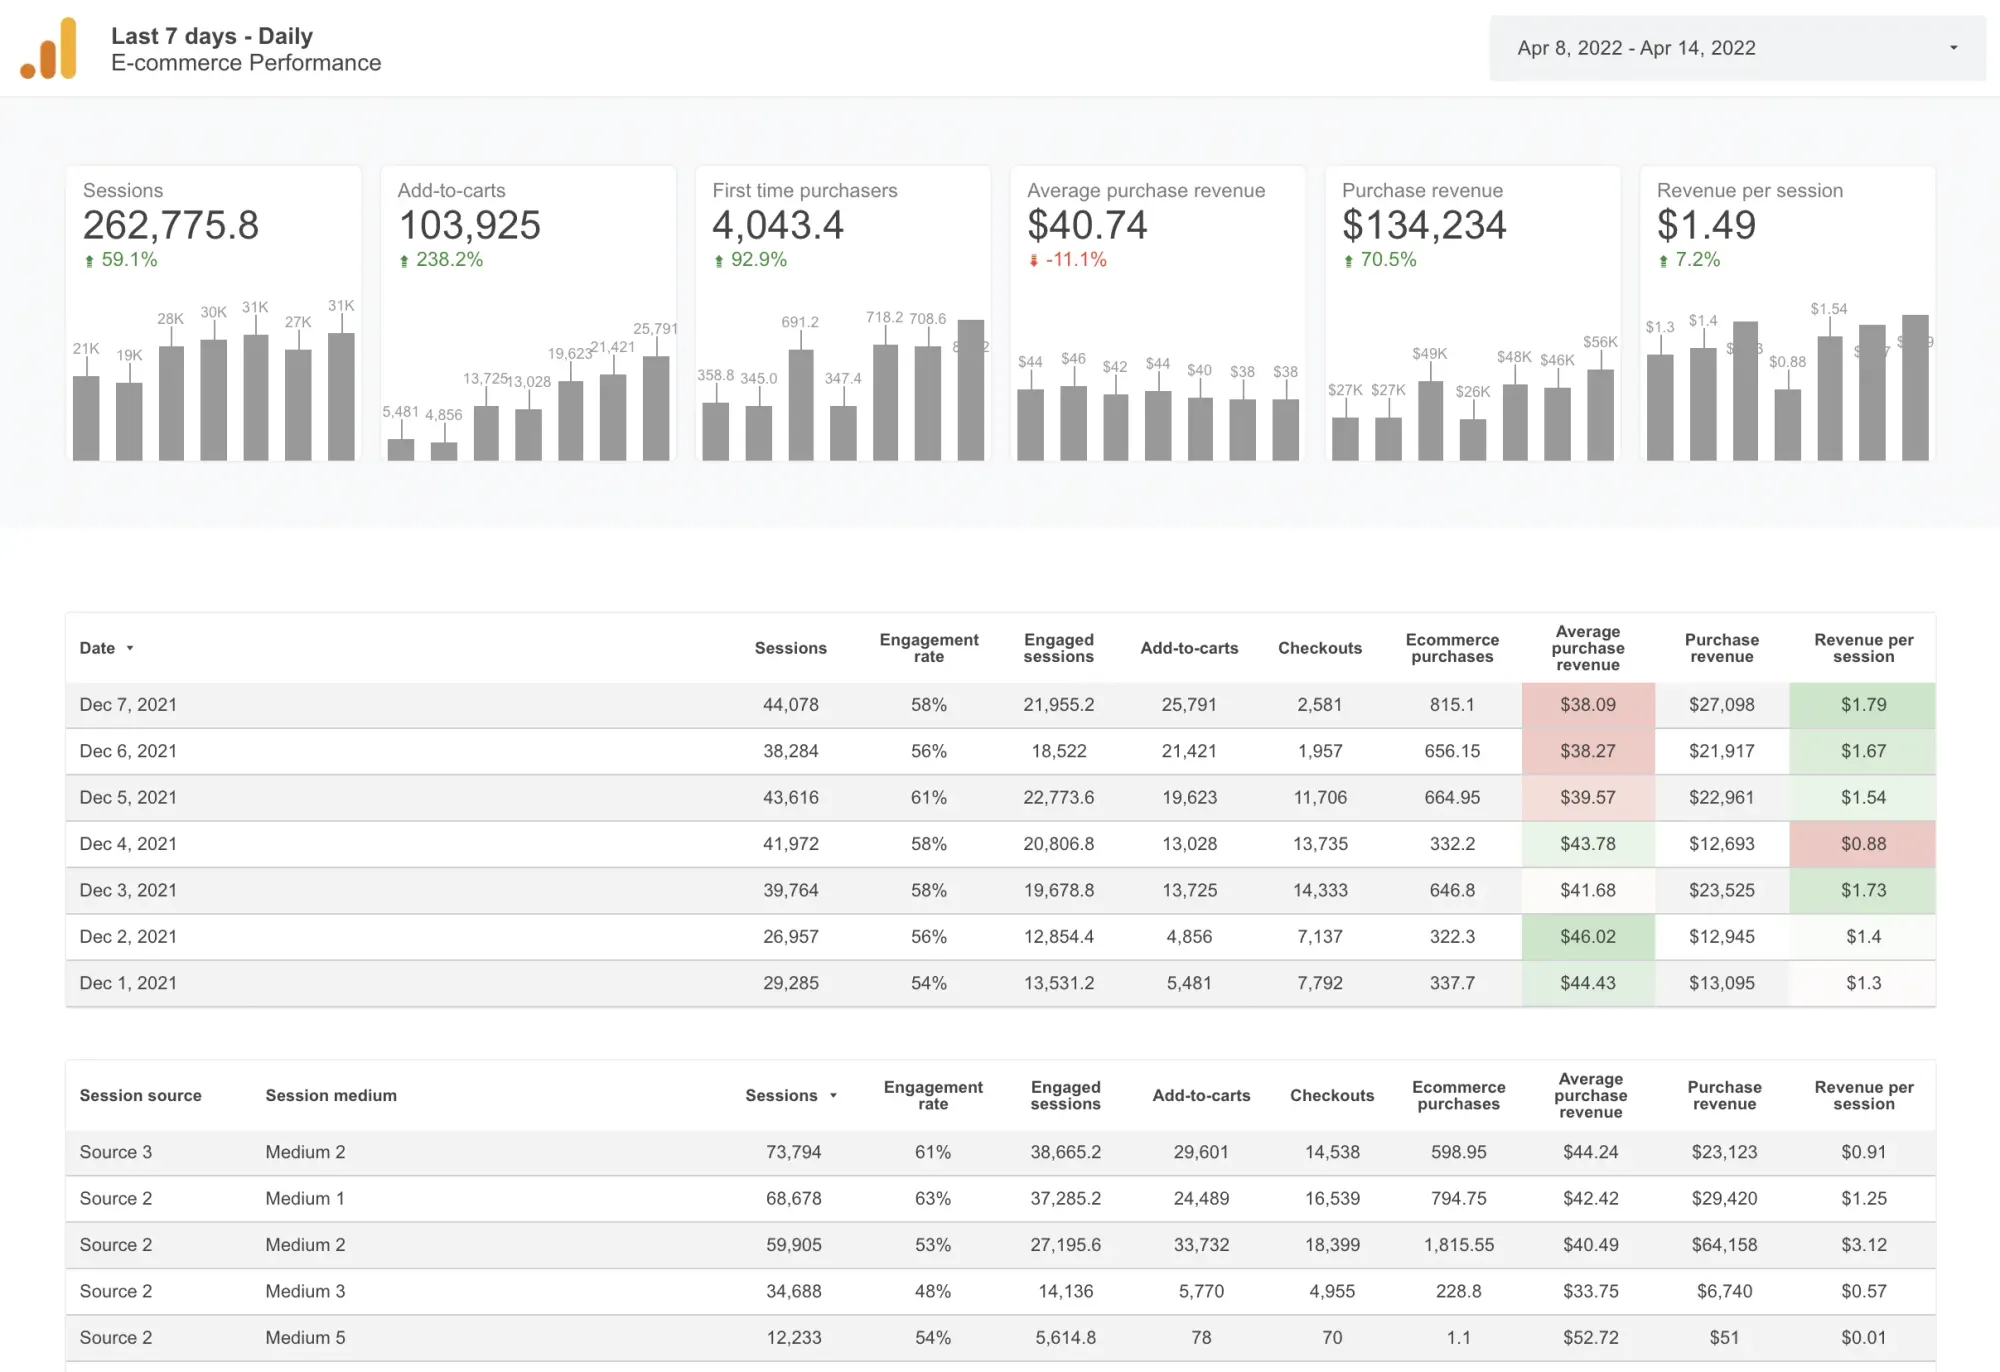
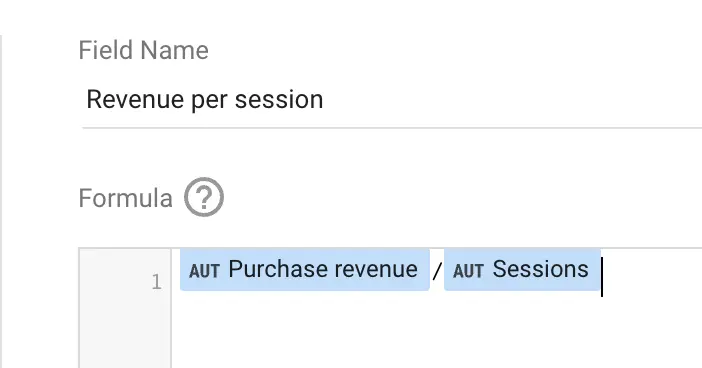
The user experience is the same as the above and the below pages but, we have the one and very important KPIs here to track the e-commerce performance; "Revenue per session".
Revenue per session KPI represents how much money you are earning every visit of users. The conversion rate can be high but, if the average basket value is lower than before then, the overall revenue will be shrunk. The revenue per session metric simplifies your decision-making process.
Product Funnel
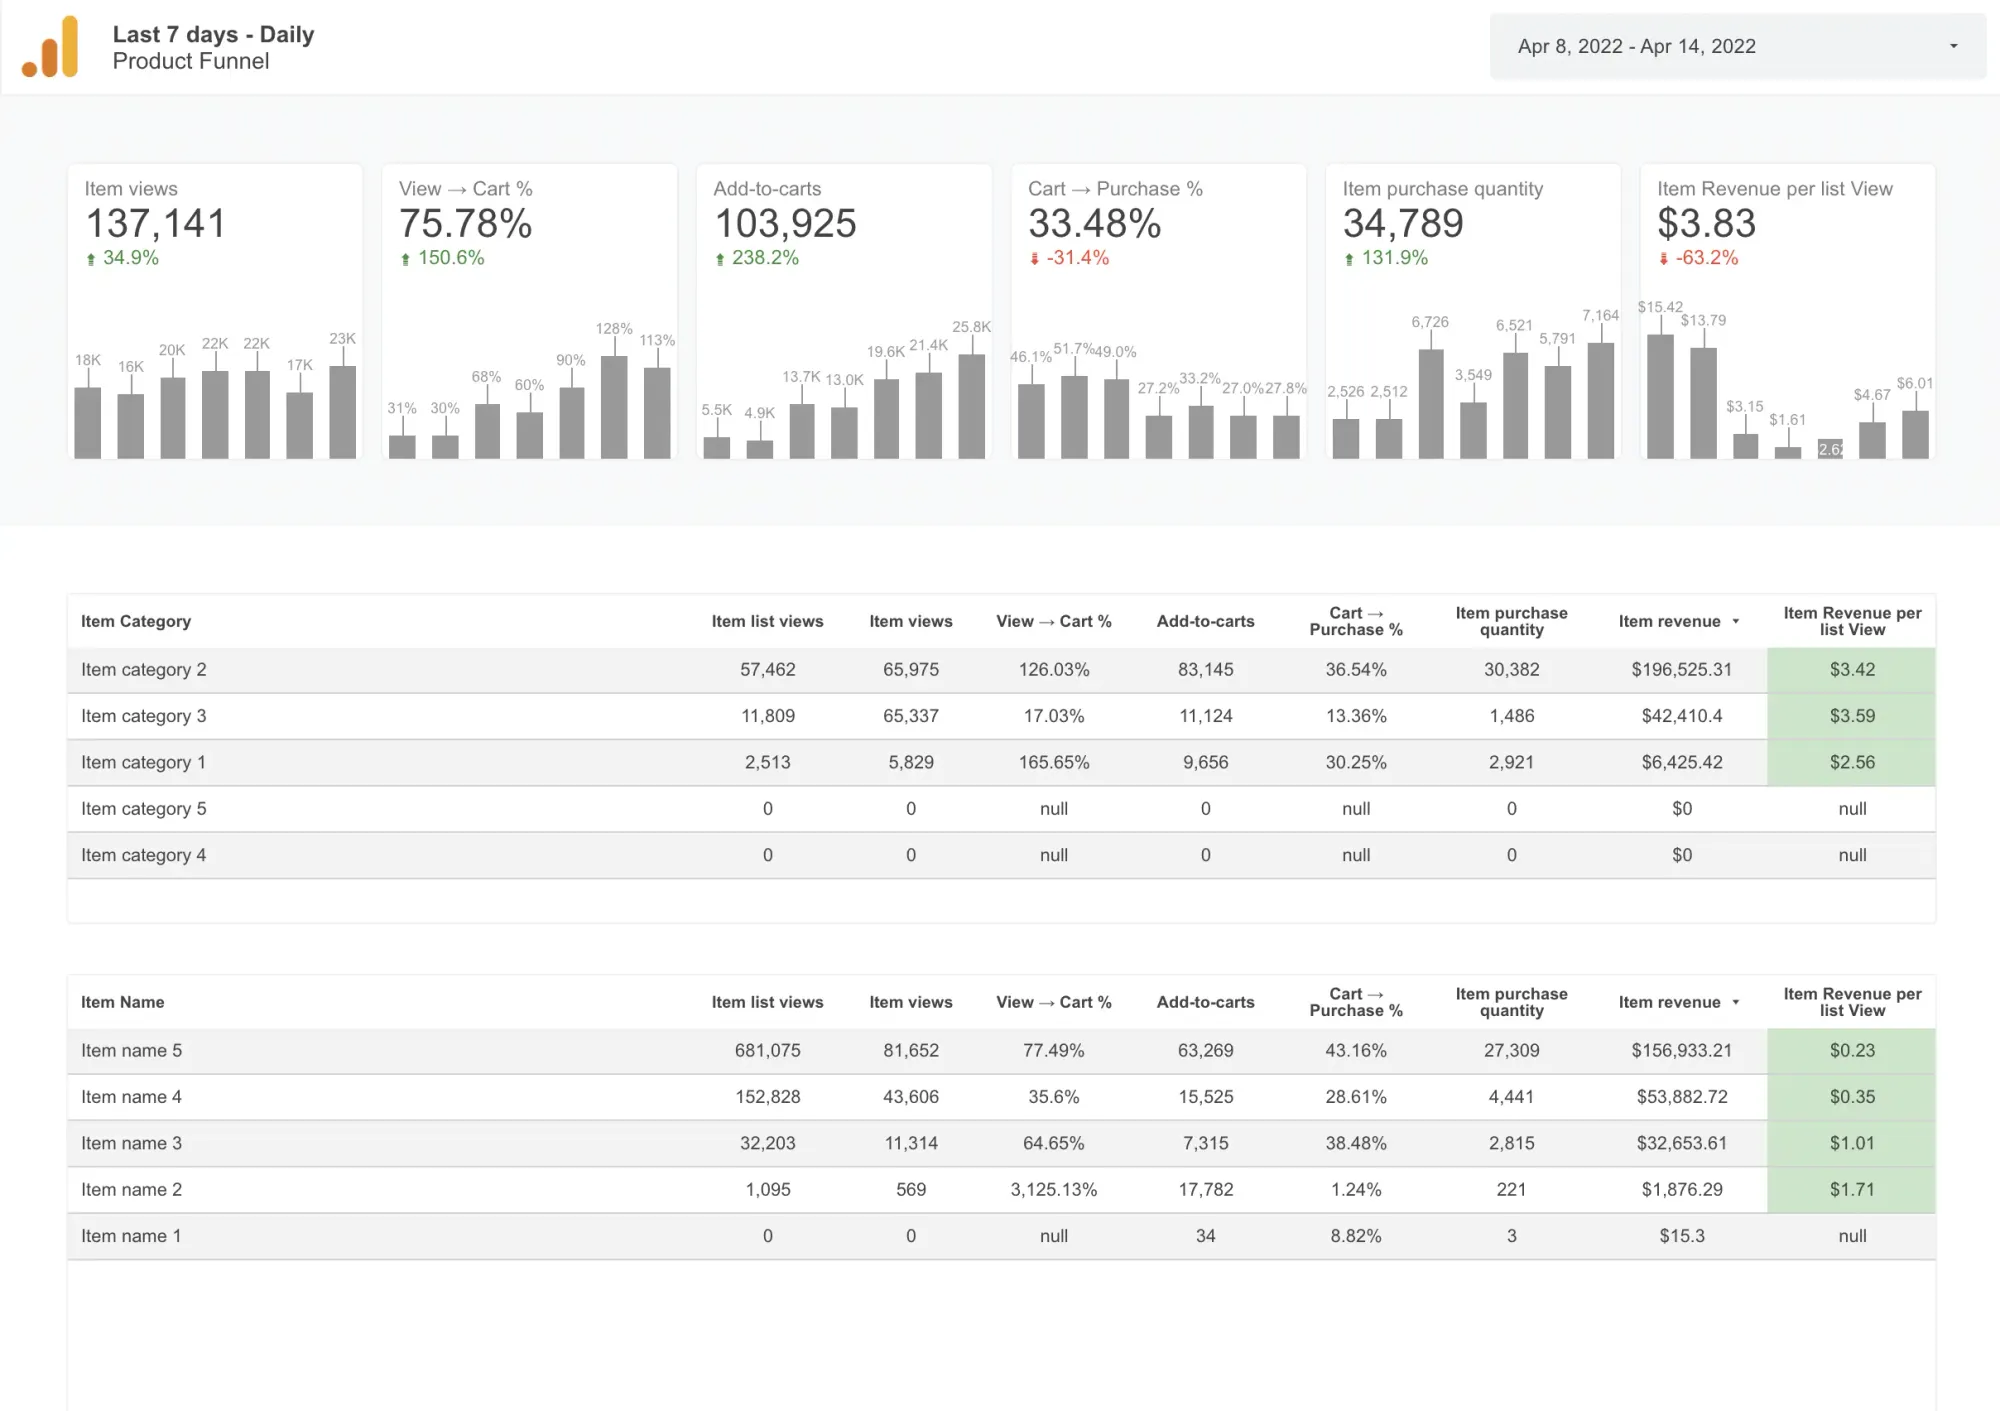
The last and one of the most important pages is the product funnel. This page will help you to optimize your product management process by giving you the performance of every funnel step at your website. Let's look at those steps together:
- Item views: A product's lifecycle start when a user views that product. So, we take this metric as the entrance of the funnel.
- View → Cart %: The ultimate job of the product detail pages is to convince users to add the product to the cart. So, this metric makes the product detail page review accessible to everyone. Look at the below screenshot. You can see and compare this metric for every category and product item easily.
- Cart → Purchase %: This part shows the actual purchase funnel of your website that starts from the basket page and then, the address/payment/purchase pages come after.
- Item Revenue per list View: This is one of my favourite metrics which is calculated by the total revenue generated divided by the total list view. The concept is that we should show products to the potential buyers only they have a high chance of being purchased by them. Otherwise, we can show products on website listing but, they just consume space without no use.
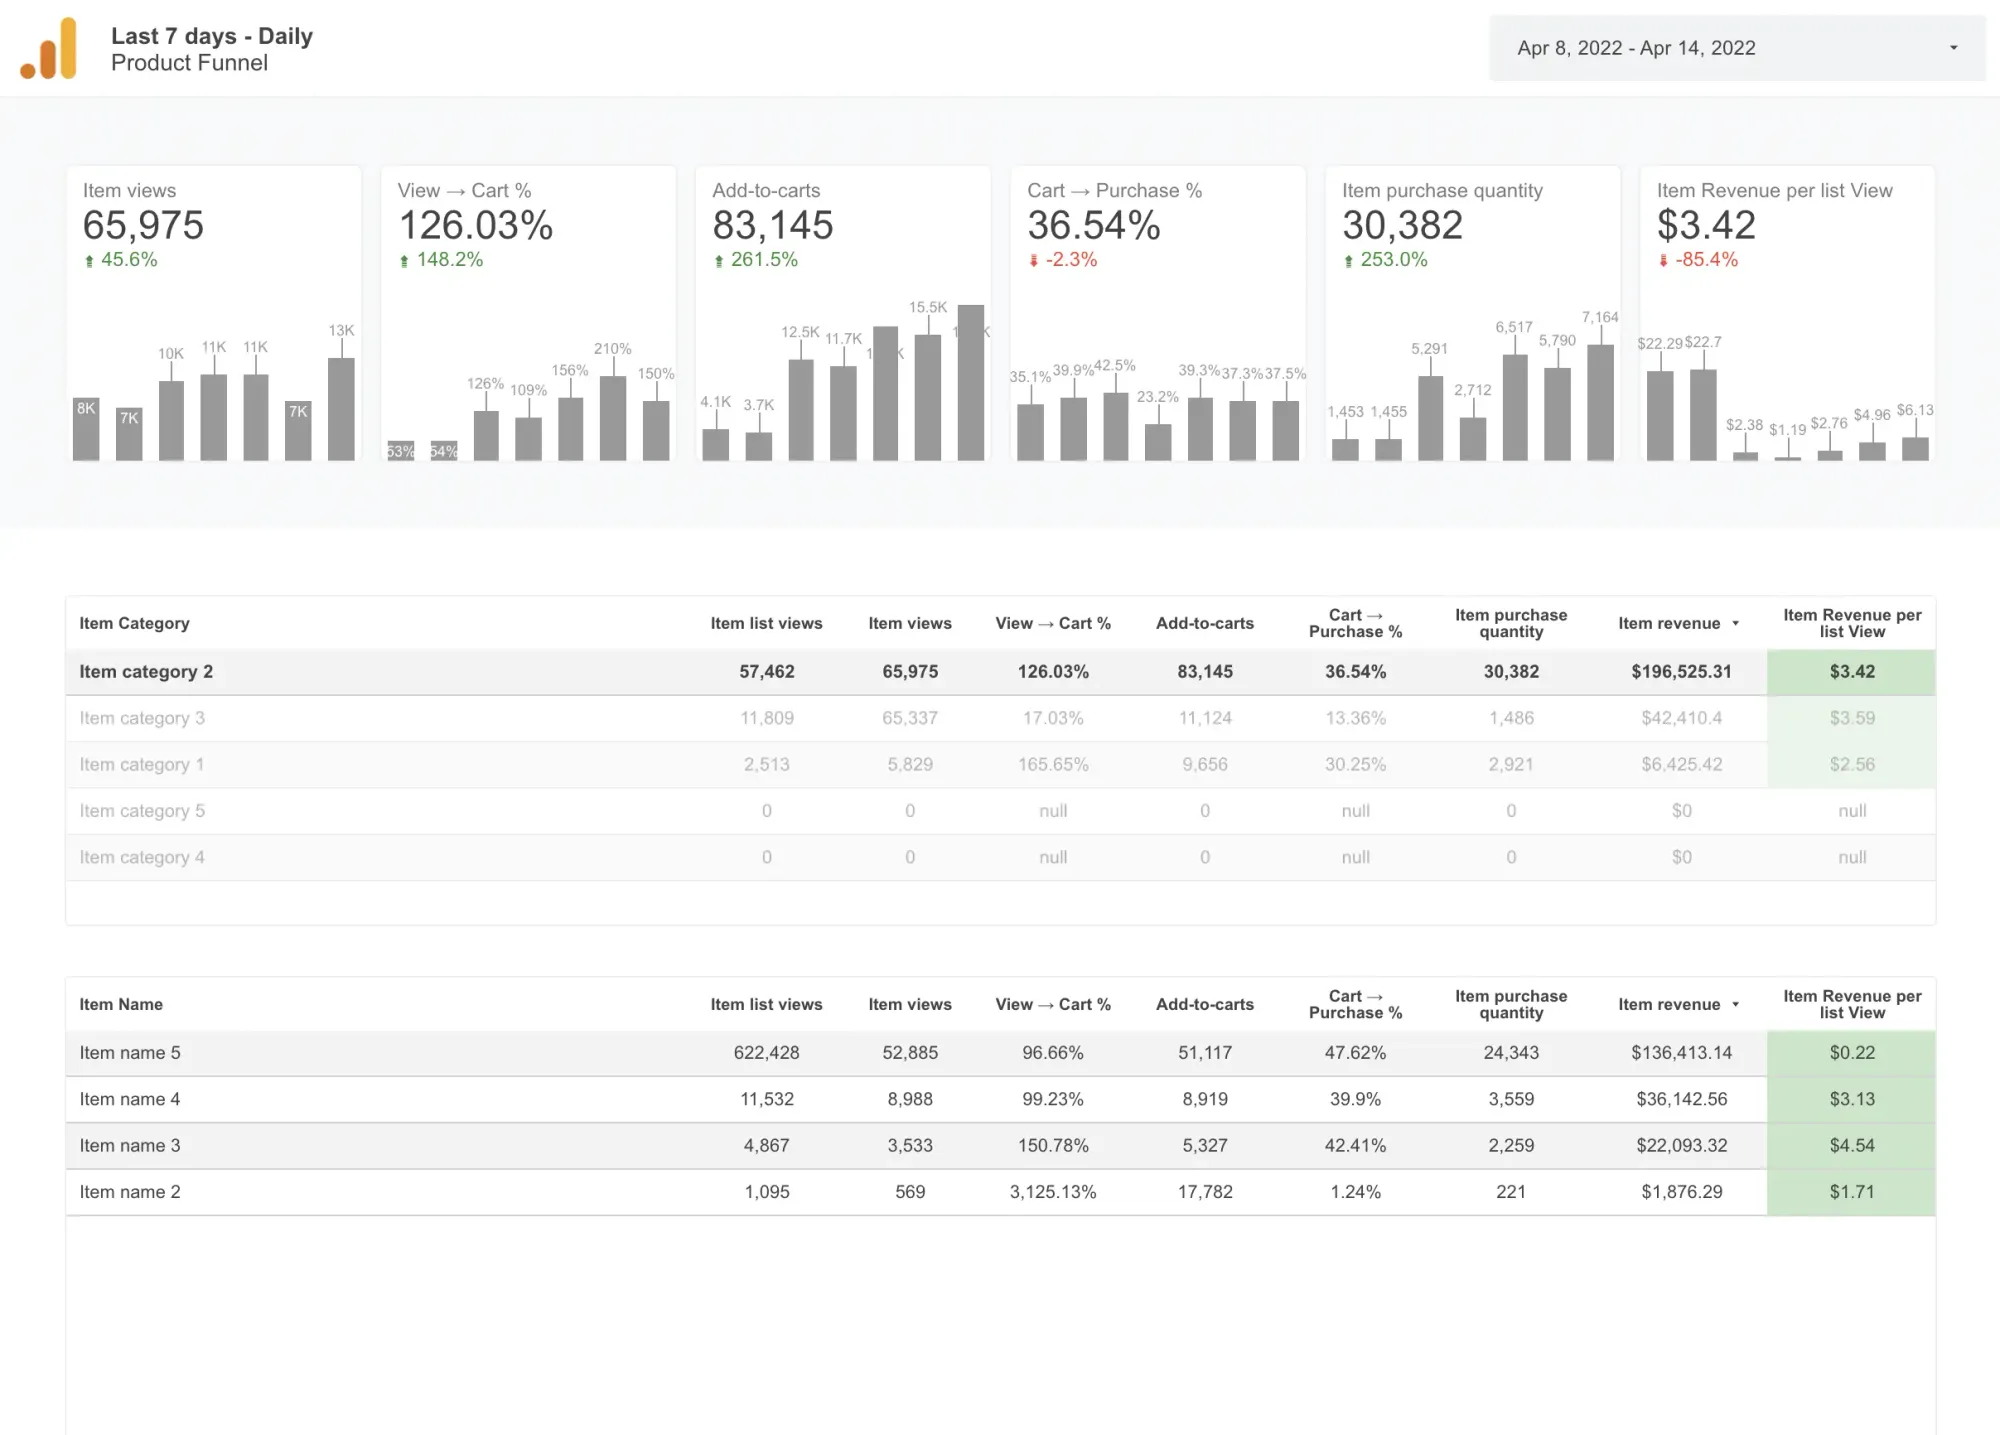
You can use the filters here as well as on the other pages. Your category managers can look at their own category performance by clicking on it. The page will be filtered by this category.
How to copy this dashboard?
Step 1: Create GDS Data Source
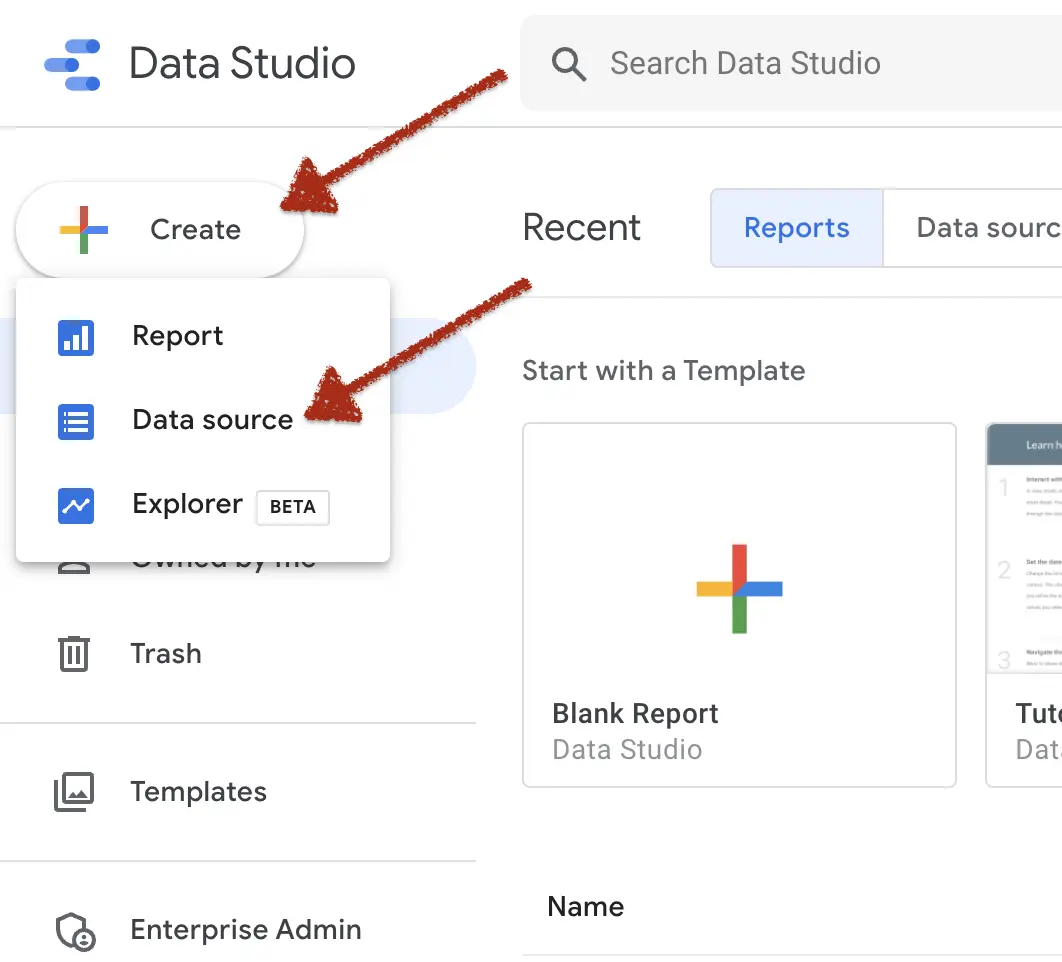
We need to create data sources before creating the dashboard. Please visit this link or navigate to the top-left button and click Create → Data Source to create a new data source.
Step 2: Select the GA4 account and name the source
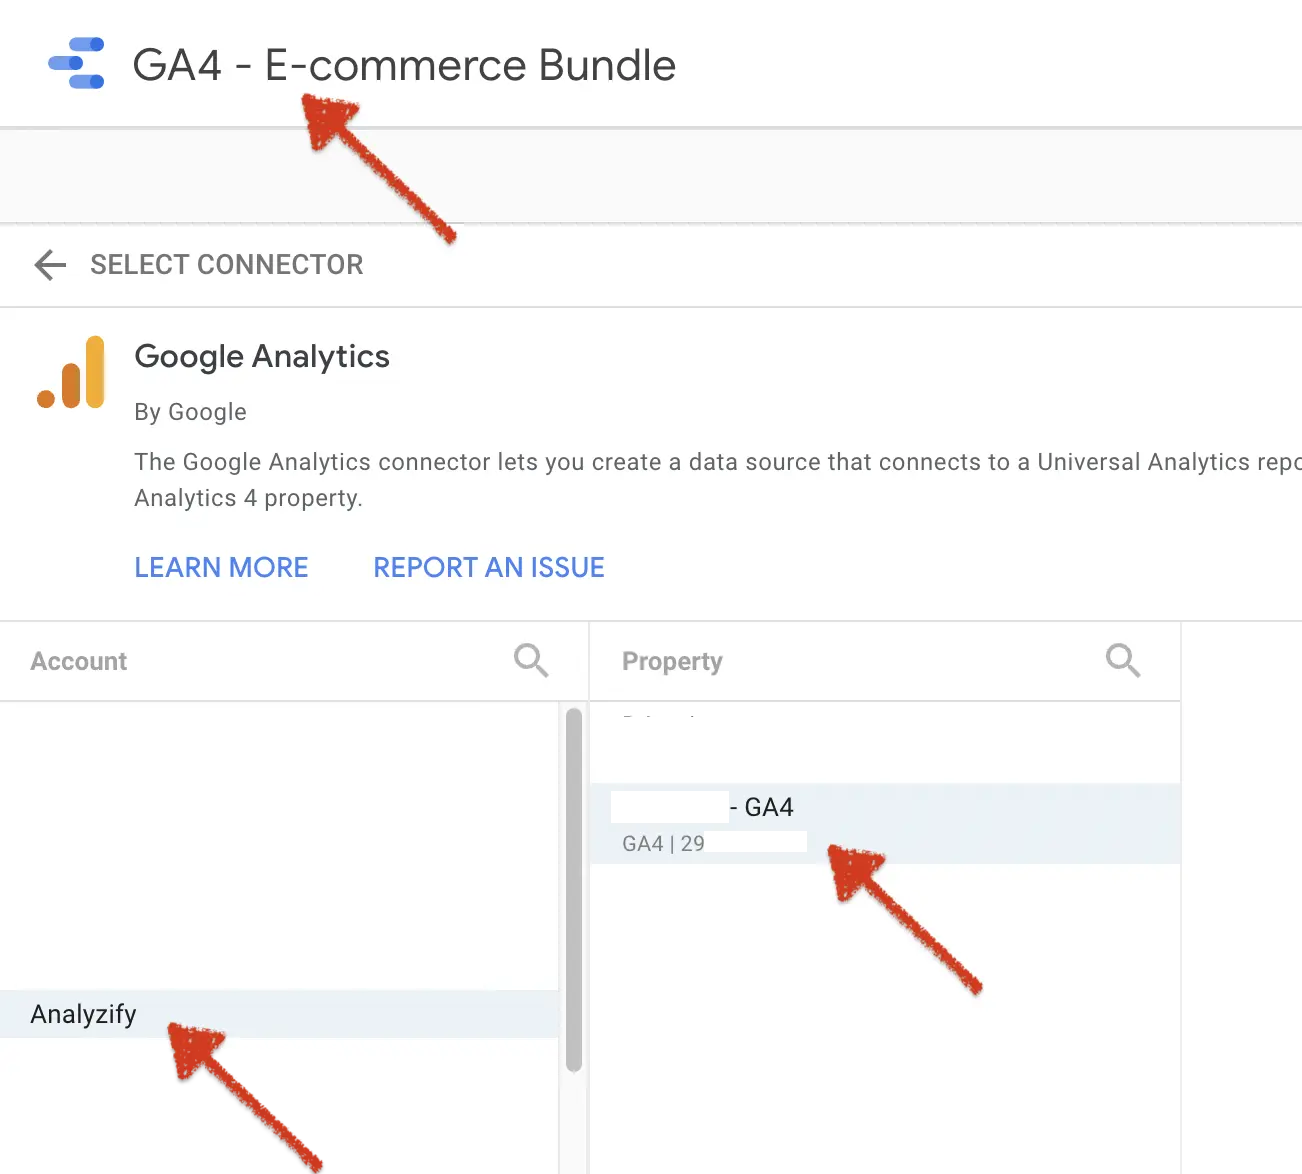
Select the GA4 account and click the title (it should be Untitled Data Source) to change it. Then, please click the blue "Connect" button on the top right side.
Step 3: Adding calculated metrics
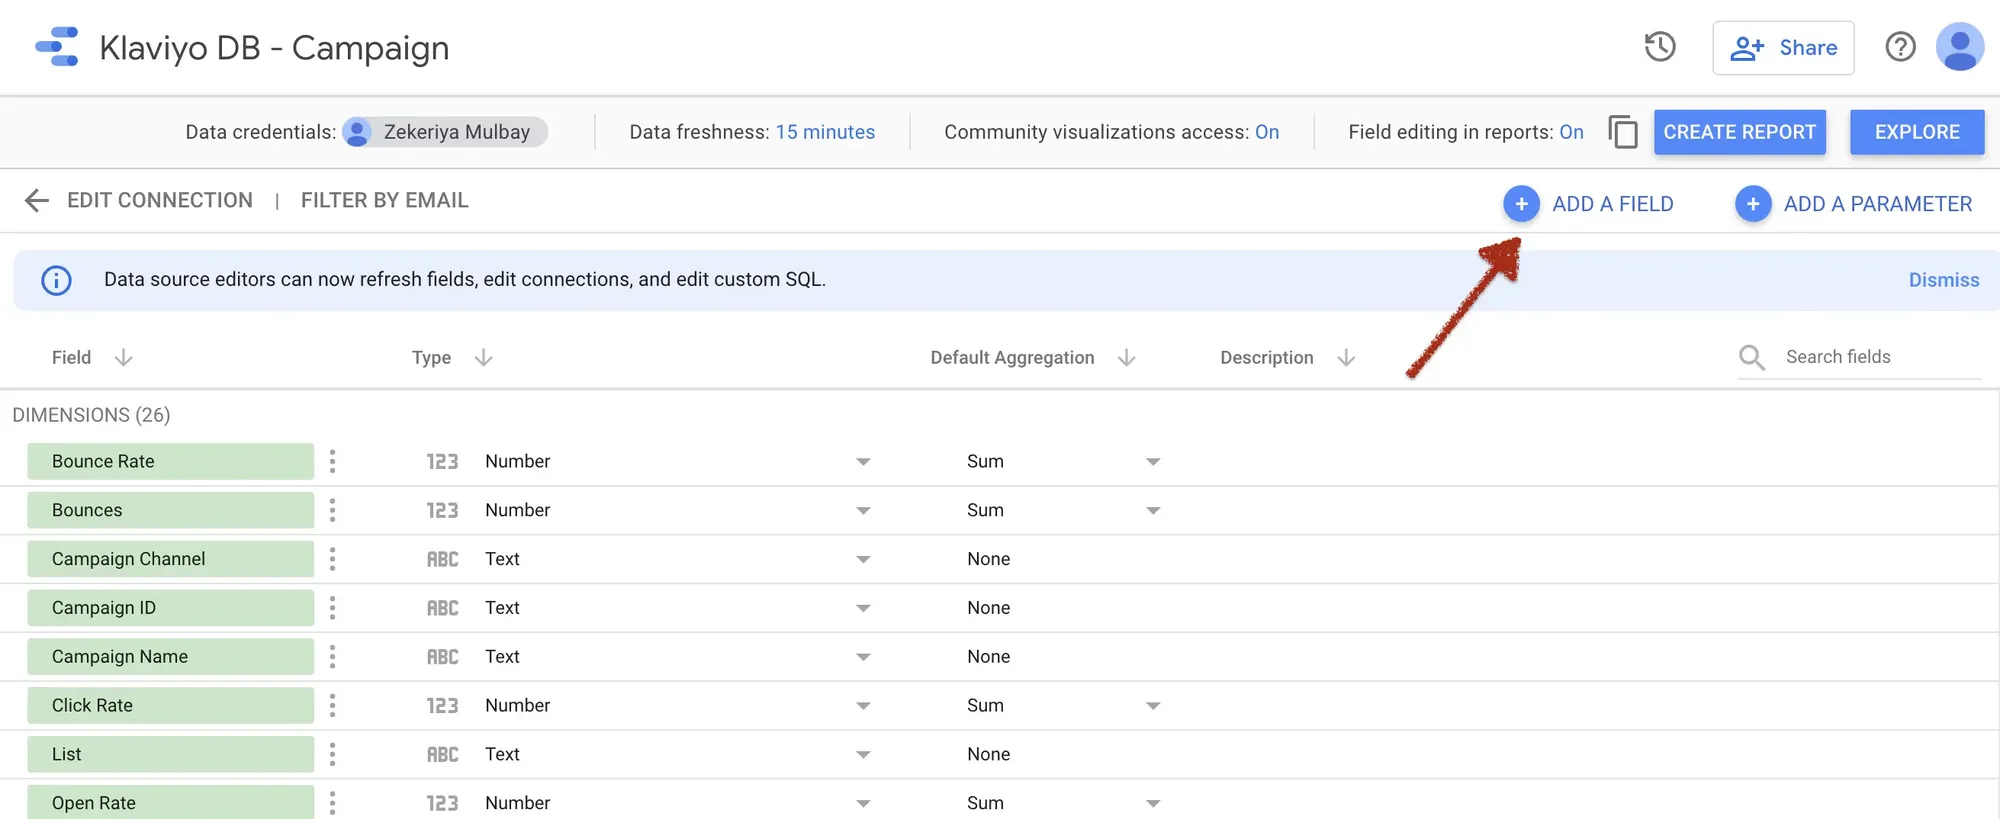
Now we will add some custom metrics which Google Analytics 4 doesn't give or need to be calculated when you view the dashboard. To start this process, please click the "Add a Field" plus icon.
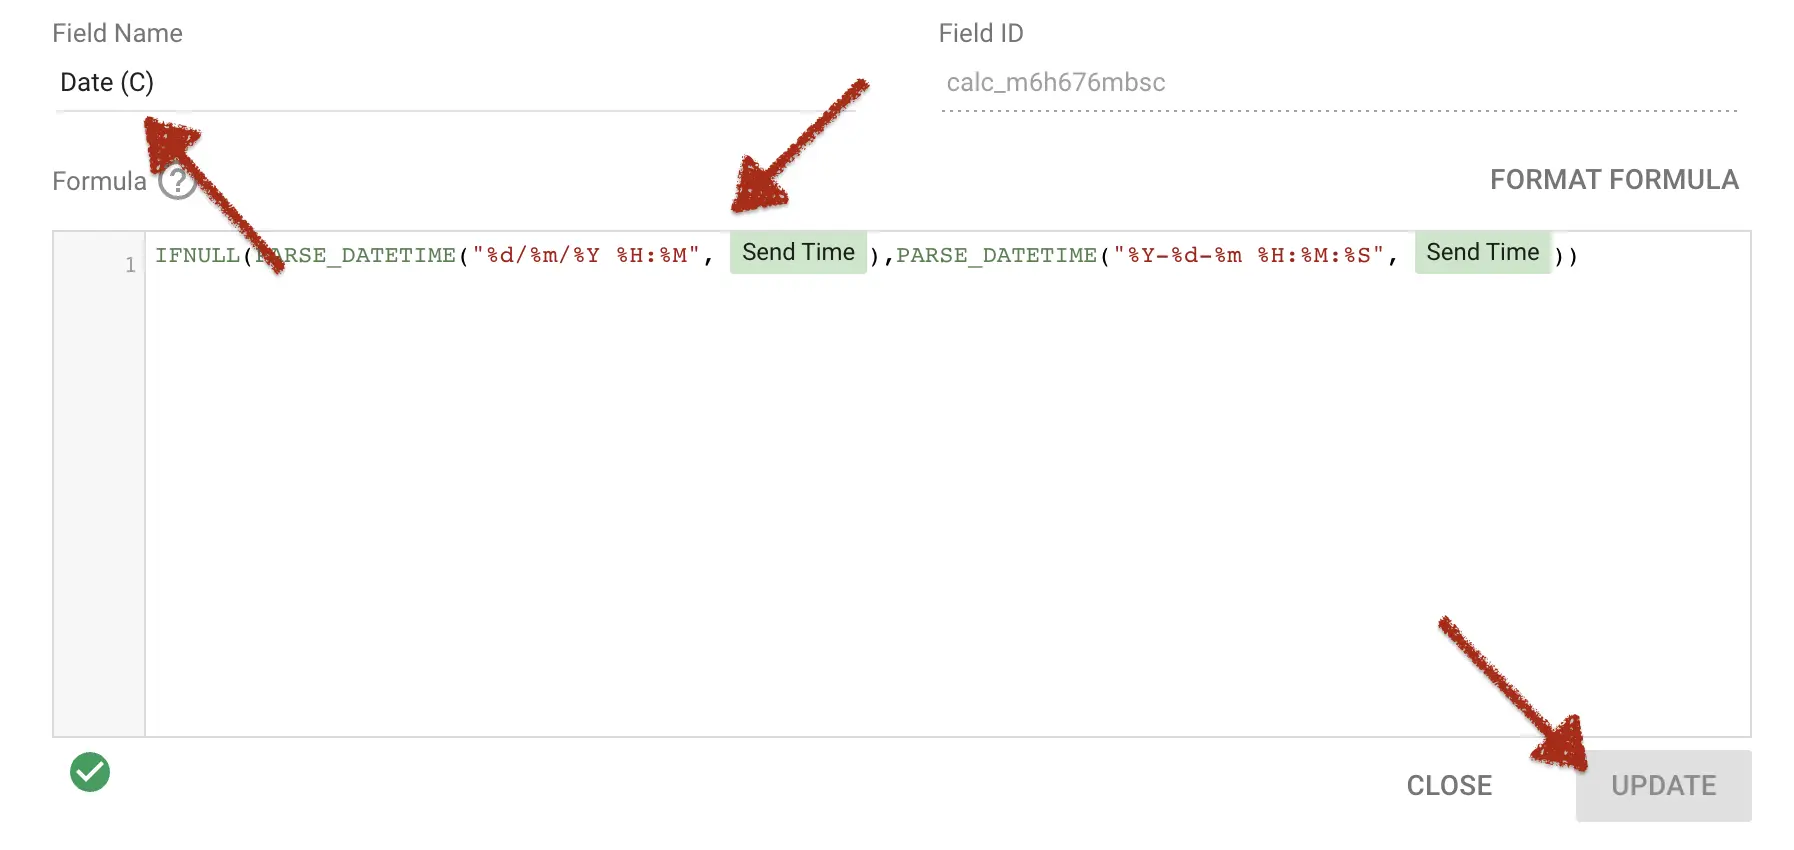
Before proceeding, I'd like to explain the custom field panel:
- Field Name: The name of a new metric or dimension
- Formula: We can handle data in many different ways thanks to GDS functions.
- You need to click the blue button to add/update the field every time.
Session → View %: This new KPI shows us what percentage of visits have been directed to the product detail pages.
Item views/Sessions
View → Cart %: Do users who look at the product detail page add the product to the cart?
Add-to-carts/Item views
Cart → Purchase %: Number of product sales divided by the number of product details views. This is a great indicator to understand the conversion rate for each product.
Items purchased/Items added to cart
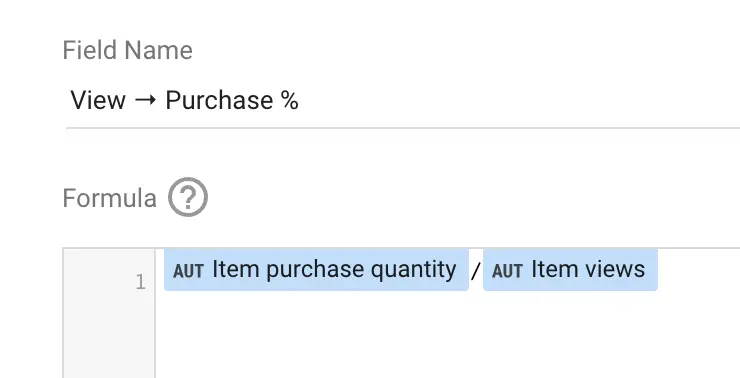
View → Purchase %: This is the calculated version of the "Purchase-to-view rate" metric. We will use the calculated metric instead of the native one to make sure you have accurate data on weekly and monthly aggregated pages.
Item purchase quantity/Item views
Purchase Rate: This is the old E-commerce Conversion Rate metric that hasn't been placed in the current GA4, yet.
Ecommerce purchases/Sessions
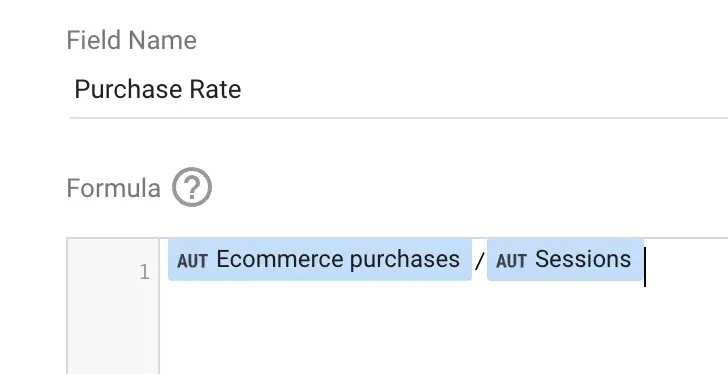
Average Basket Size: Represents the number of items per transaction. There is no metric to give this data to us for now.
Item purchase quantity/Ecommerce purchases
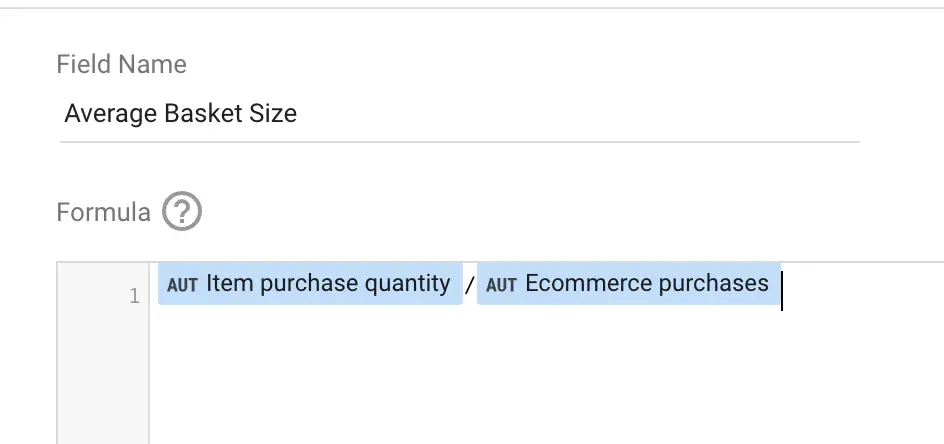
Item Revenue per list View: This is a non-native KPI that we use mostly to understand the e-commerce listing performance.
Item revenue/Item list views
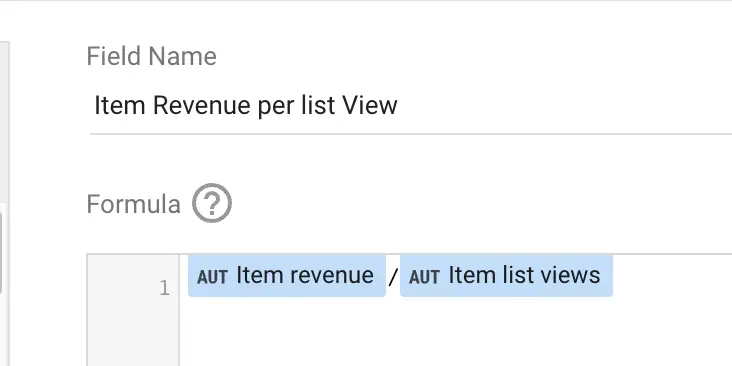
Revenue per session: This KPI gives the revenue stream per user. We mostly use this metric to evaluate e-commerce performance.
Purchase revenue/Sessions
Step 4: Format the calculated metrics
The last thing before copying the dashboard is to adjust the format of the new calculated metrics.
Scroll down till the first calculated metrics. Click on the cell in the "Type" column and select the appropriate type.
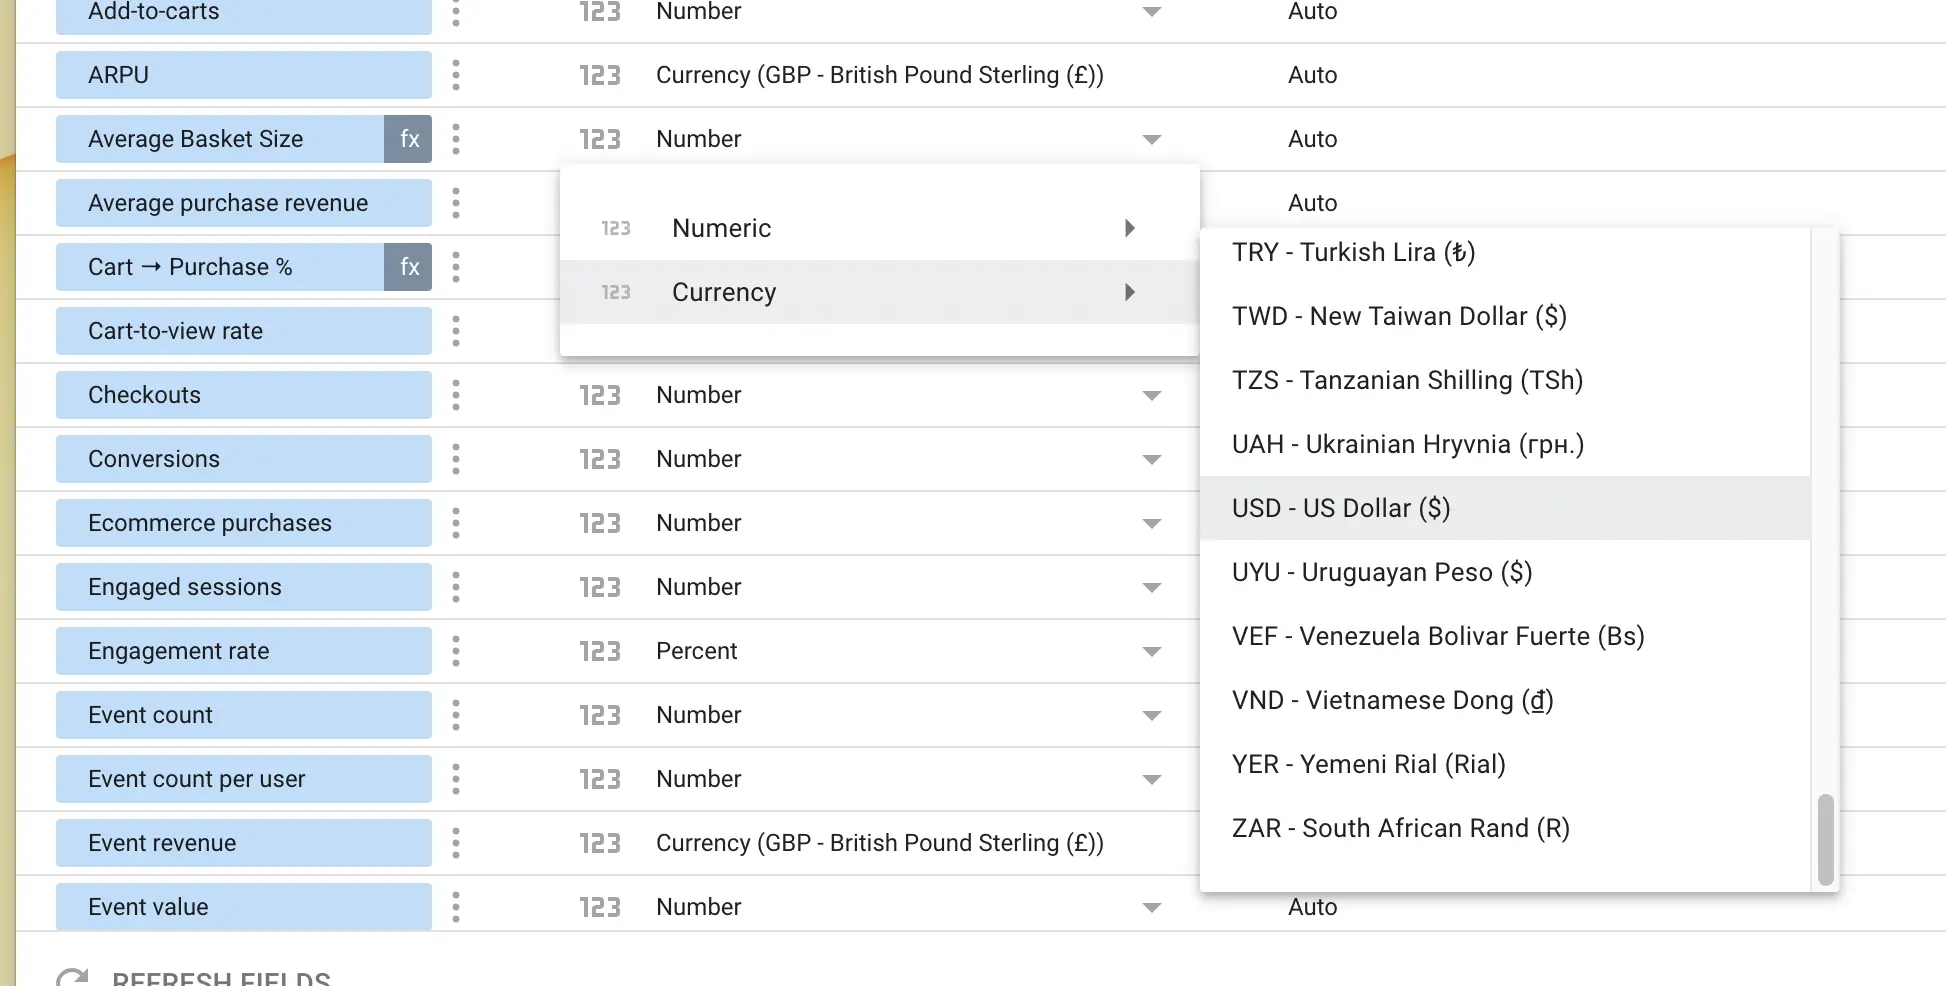
Here are the types of the above-calculated metrics:
- Average Basket Size: Currency
- Cart → Purchase %: Percent
- Item Revenue per list View: Currency
- Purchase Rate: Percent
- Revenue per session: Currency
- Session → View %; Percent
- View → Cart %: Percent
- View → Purchase %; Percent
Step 4: Copy the Dashboard
This is the most exciting part of the process. Please open the link to the dashboard you purchased. You should see errors on every widget. Don't be afraid of them. They are like that because of not show another account's data to you.
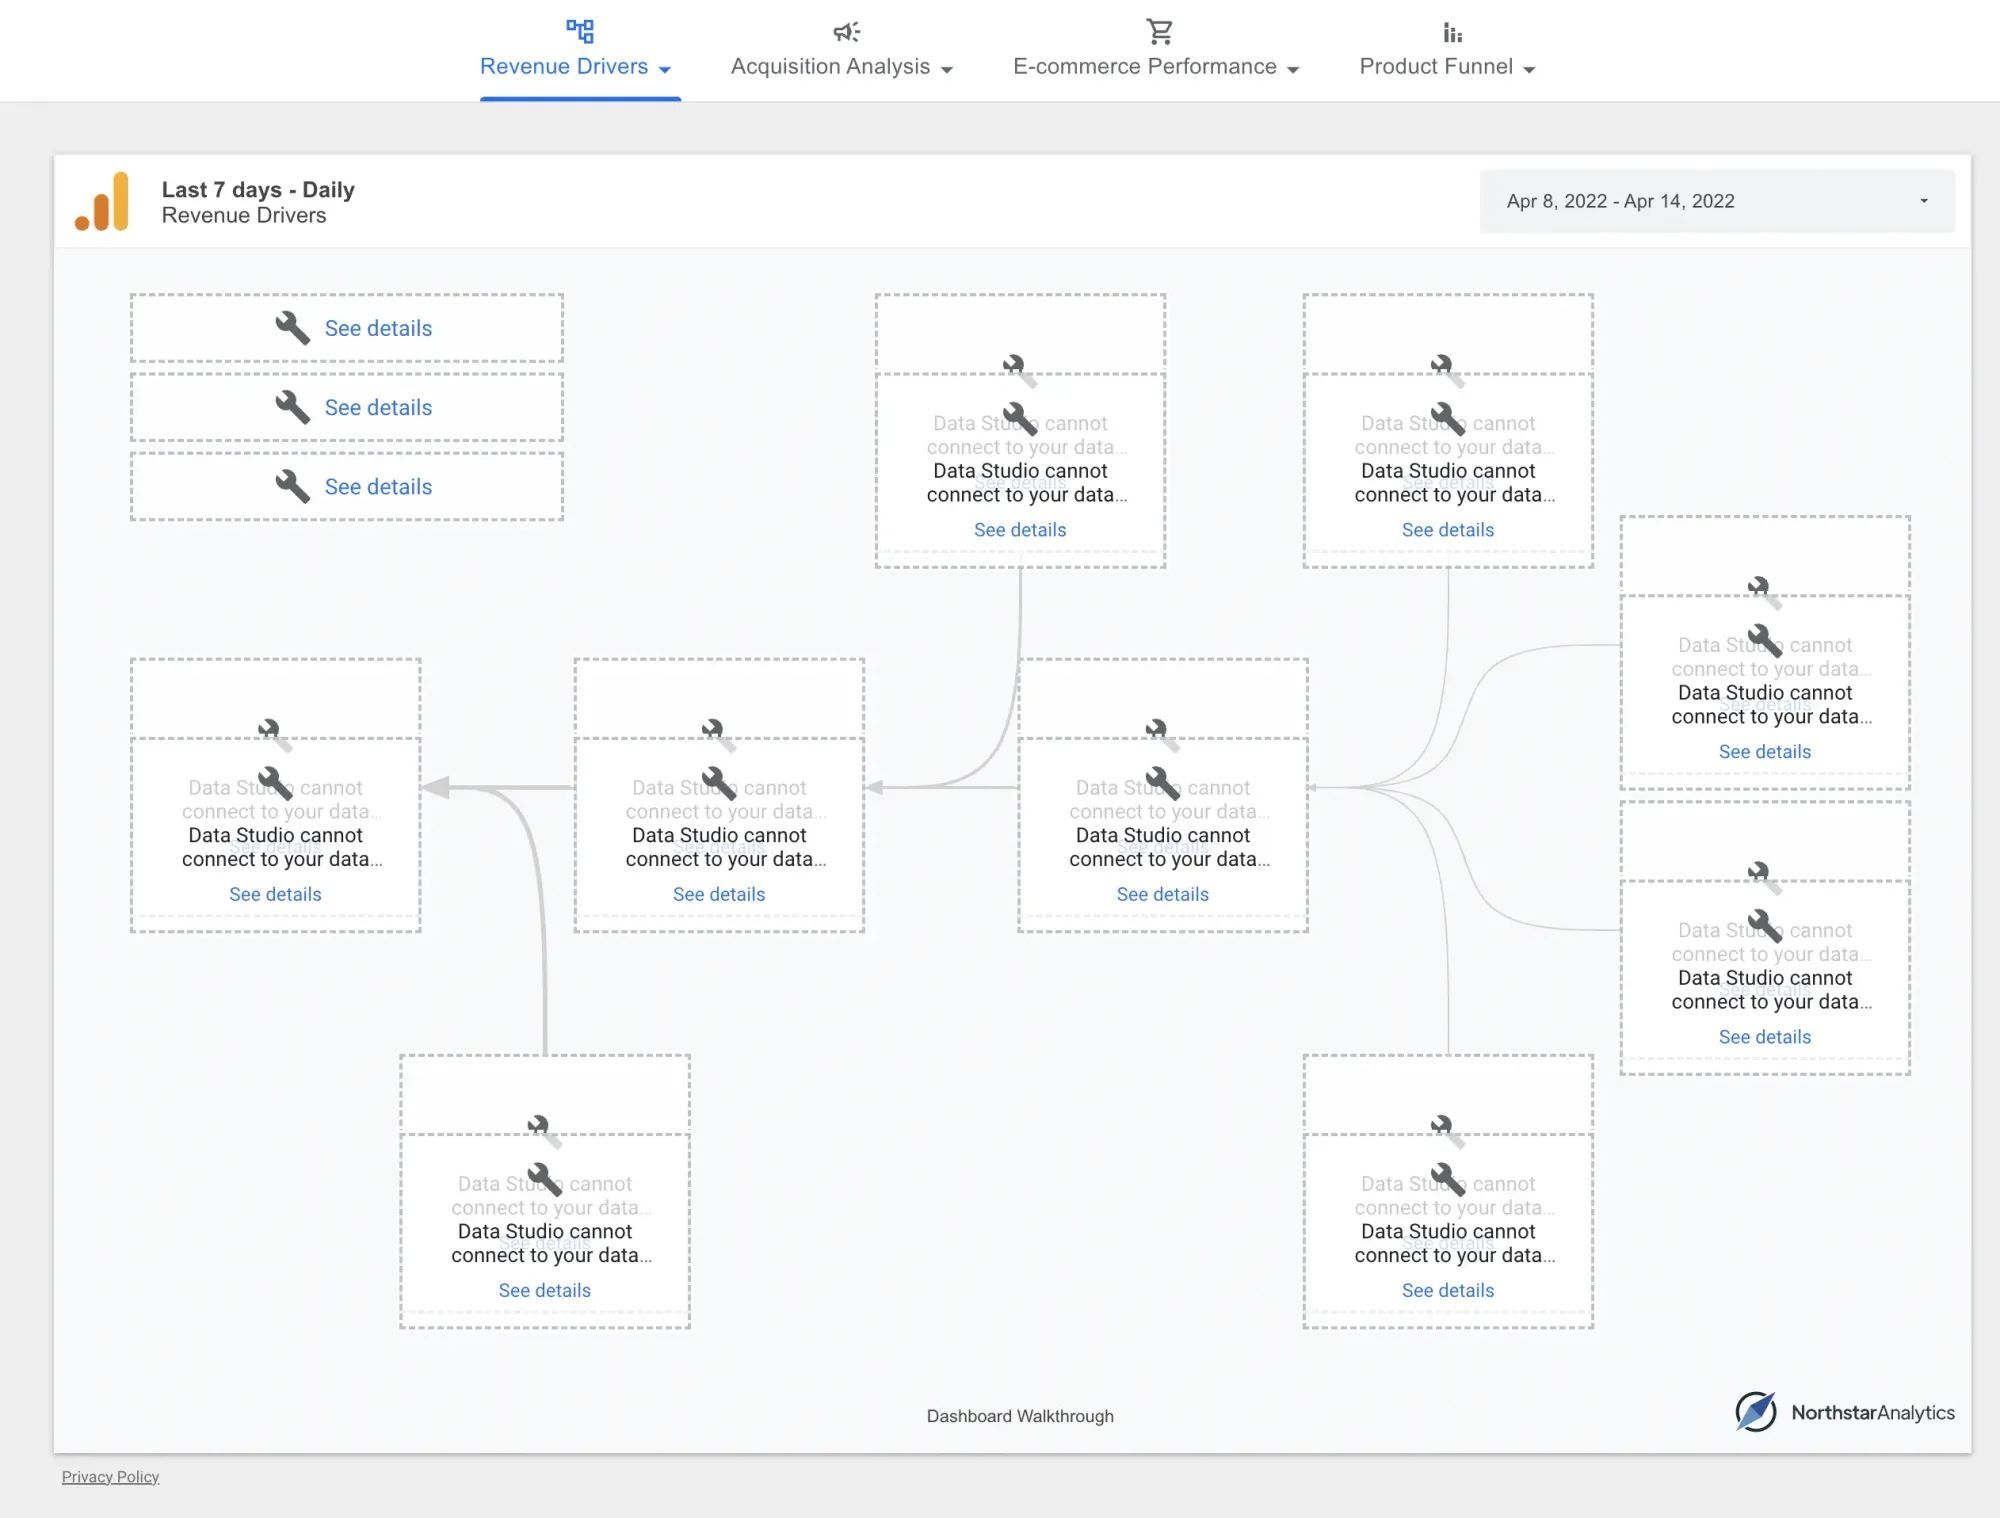
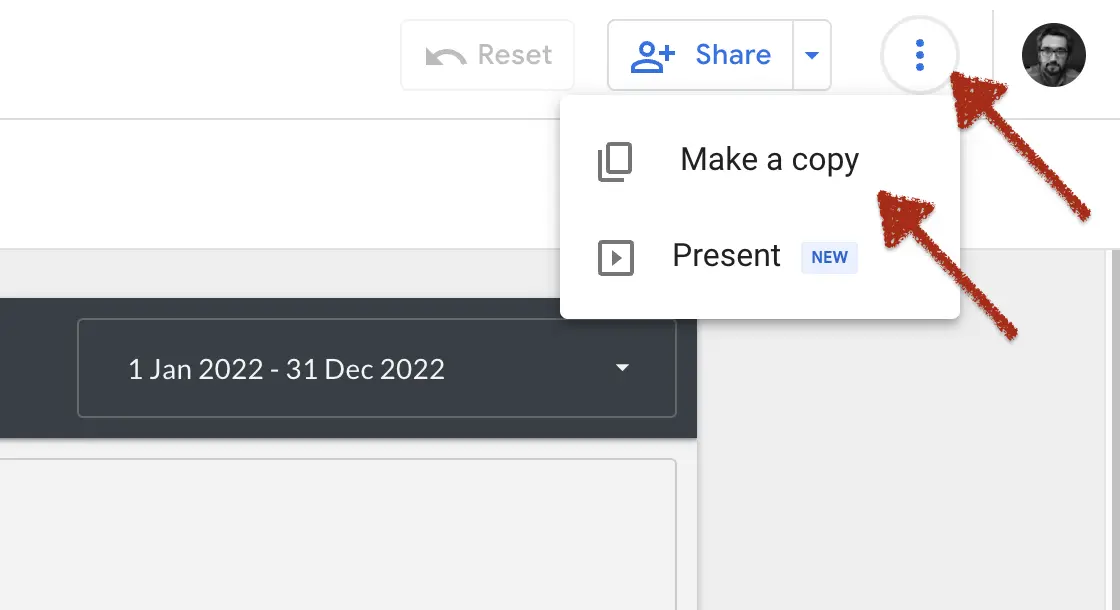
Click make a copy
You will find this option on the top right part of the dashboard. You may need to hover on the header for a few seconds to see these dots.
Select data sources
You'll see the unknown data source at first. Click there.
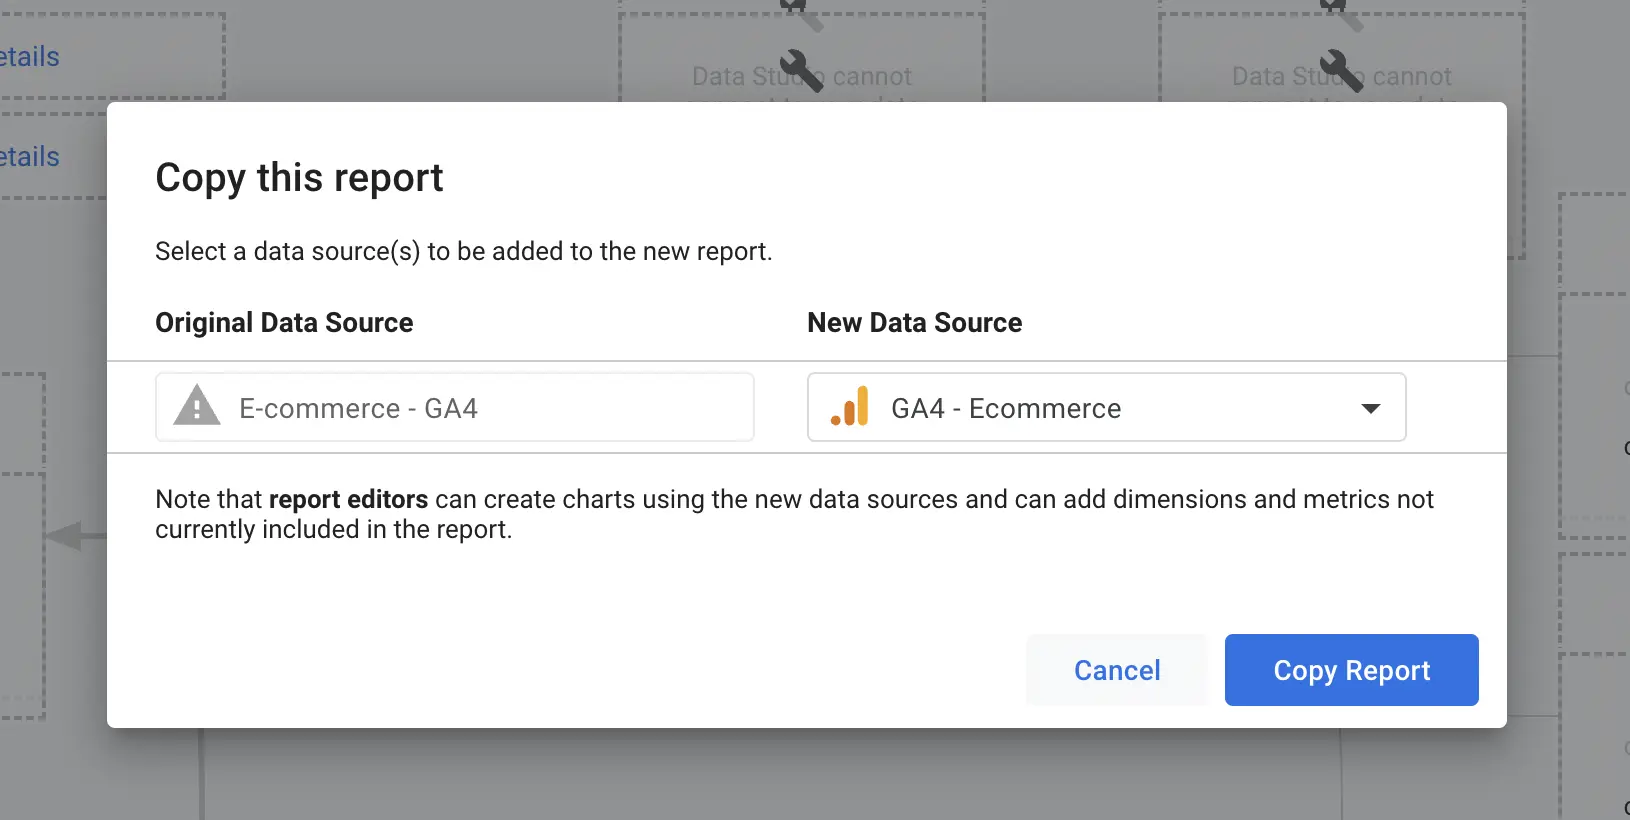
You have already prepared your data sources in the previous sections. So, please select these data sources by using the dropdown.
These data sources should be under the "Available data sources" part of the dropdown.
Copy the dashboard
Then, click the blue "Copy the report" button. If you did everything above, you should have your own dashboard right now.
Congratulations!


