SEO Dashboard Template

Personally, I have multiple businesses and looking for ways to bring more leads to my businesses. Organic traffic will be one of the very first doors that should be open but, I postponed it for years.
I decided to start at the beginning of this year and I have great traction right now. Barely anybody visits my website 3 months ago (1-2 visits per day) but, now I'm getting 30-50 visits per day which are wonderful for me because I just started 2 months ago!
As an analyst, I always look for automation to save my life. I'll walk through with you one of my favorite Google Data Studio templates. I open this dashboard EVERY DAY.
If you don't want to read the whole article you may click the below link to watch the video instead.
What will you find? / Navigation
This is a huge Google Data Studio template that contains multiple functions in it:
- The cockpit gives the overall performance
- Overall trends make you aware of trends
- Landing page and query trends give you the trend per LP and query
- Landing page and query analysis give you the comparison of each breakdown
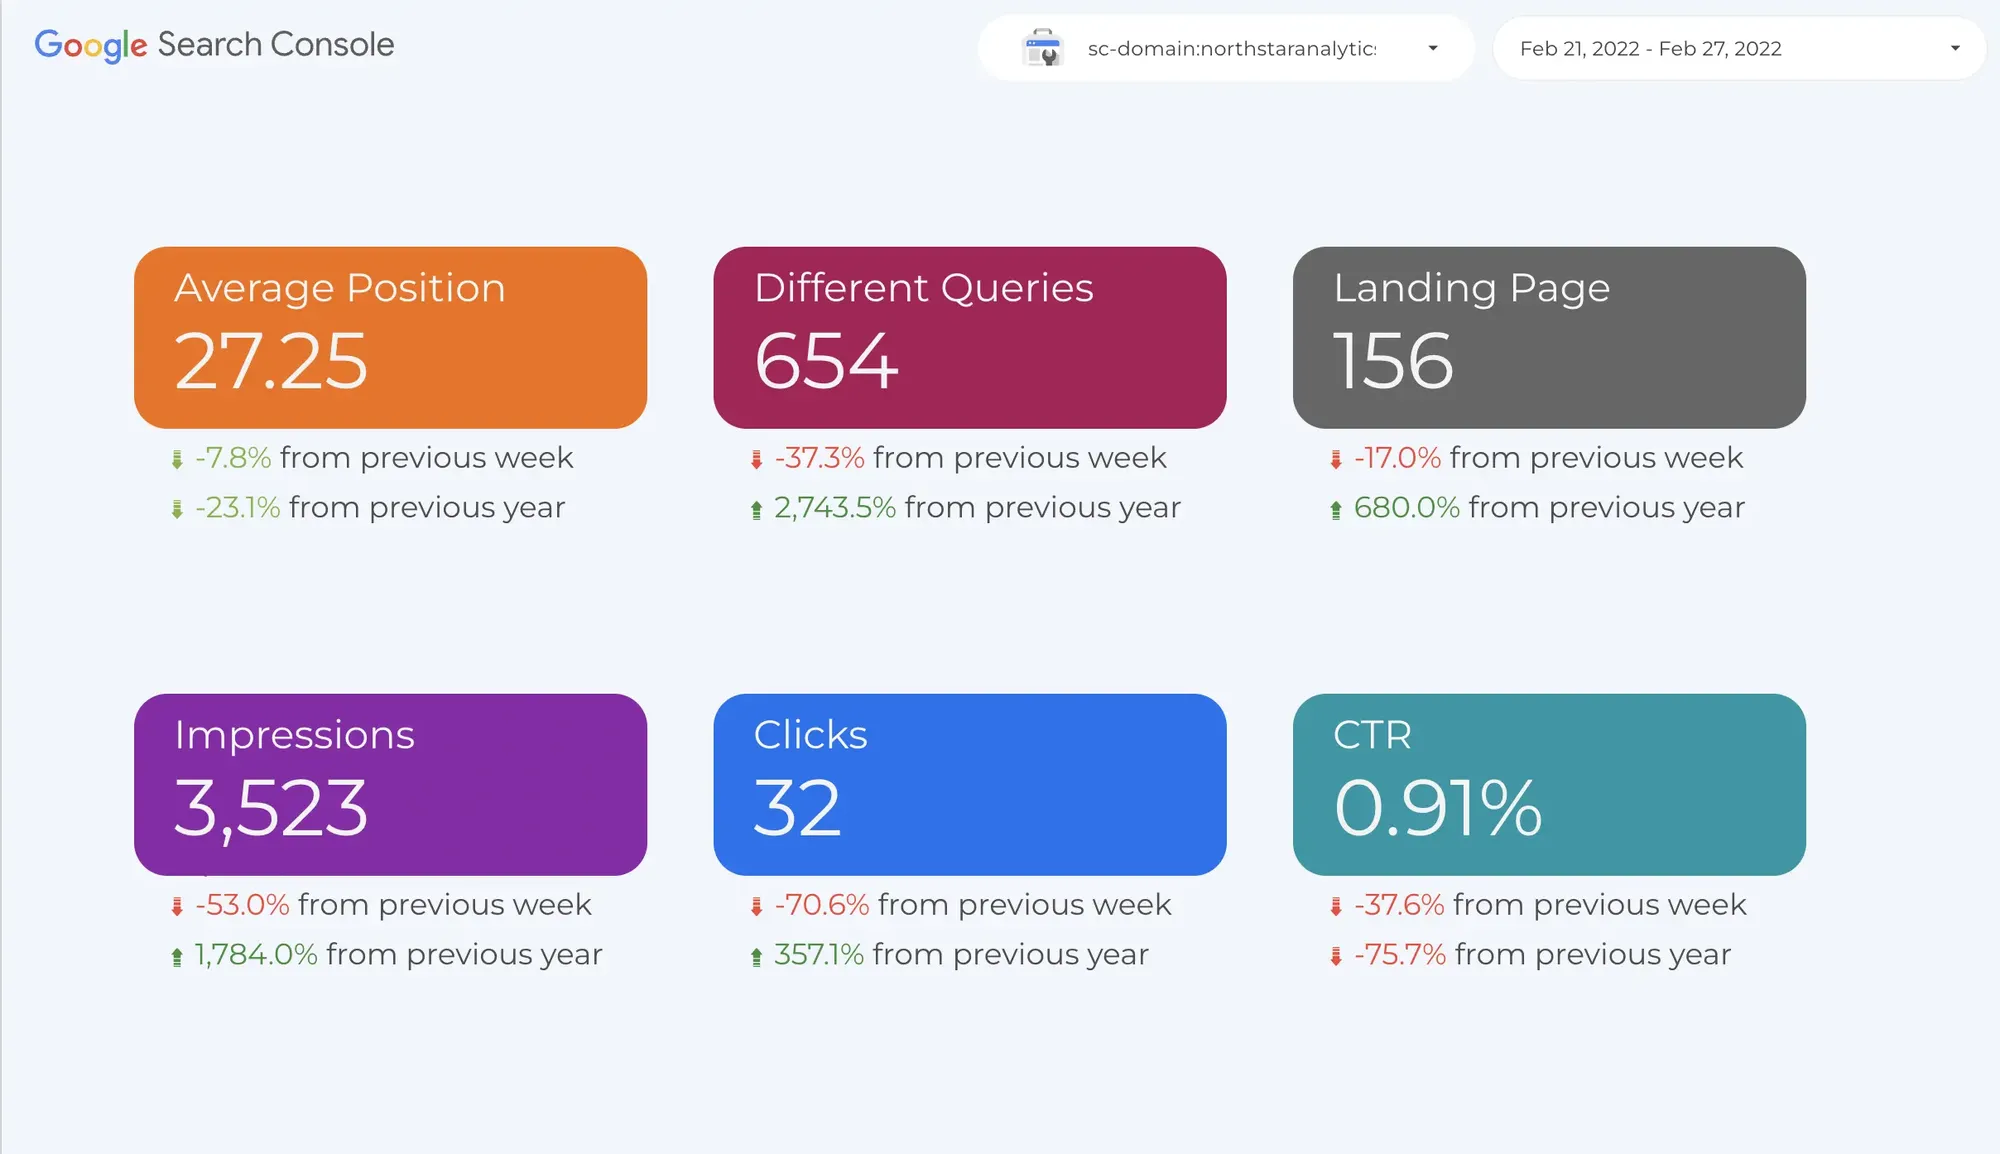
The Cockpit page
These pages (there are 7 Cockpit pages) have the most basic to give the most important metrics only:
- Average position: The position of the keywords in the Google search results.
- Different queries: How many of your queries got organic impressions?
- Landing page: Same as above. Are all of your pages get listed?
- Impressions: How often did someone see a link to your site on Google search results.
- Clicks: How often someone clicked a link from Google search results and navigate to your site.
- CTR: Clicks / Impressions
If you notice that there are calculations under each widget. I chose 2 periods:
- Compare with the previous period. If you select the last 7 days then, the dashboard will compare this data with the previous 7 days.
- Compare with the previous year. Everyone wants to compare the data with the previous year to avoid seasonality.
Take a screenshot of this page from your Google Data Studio template and put it in your weekly/monthly presentation.
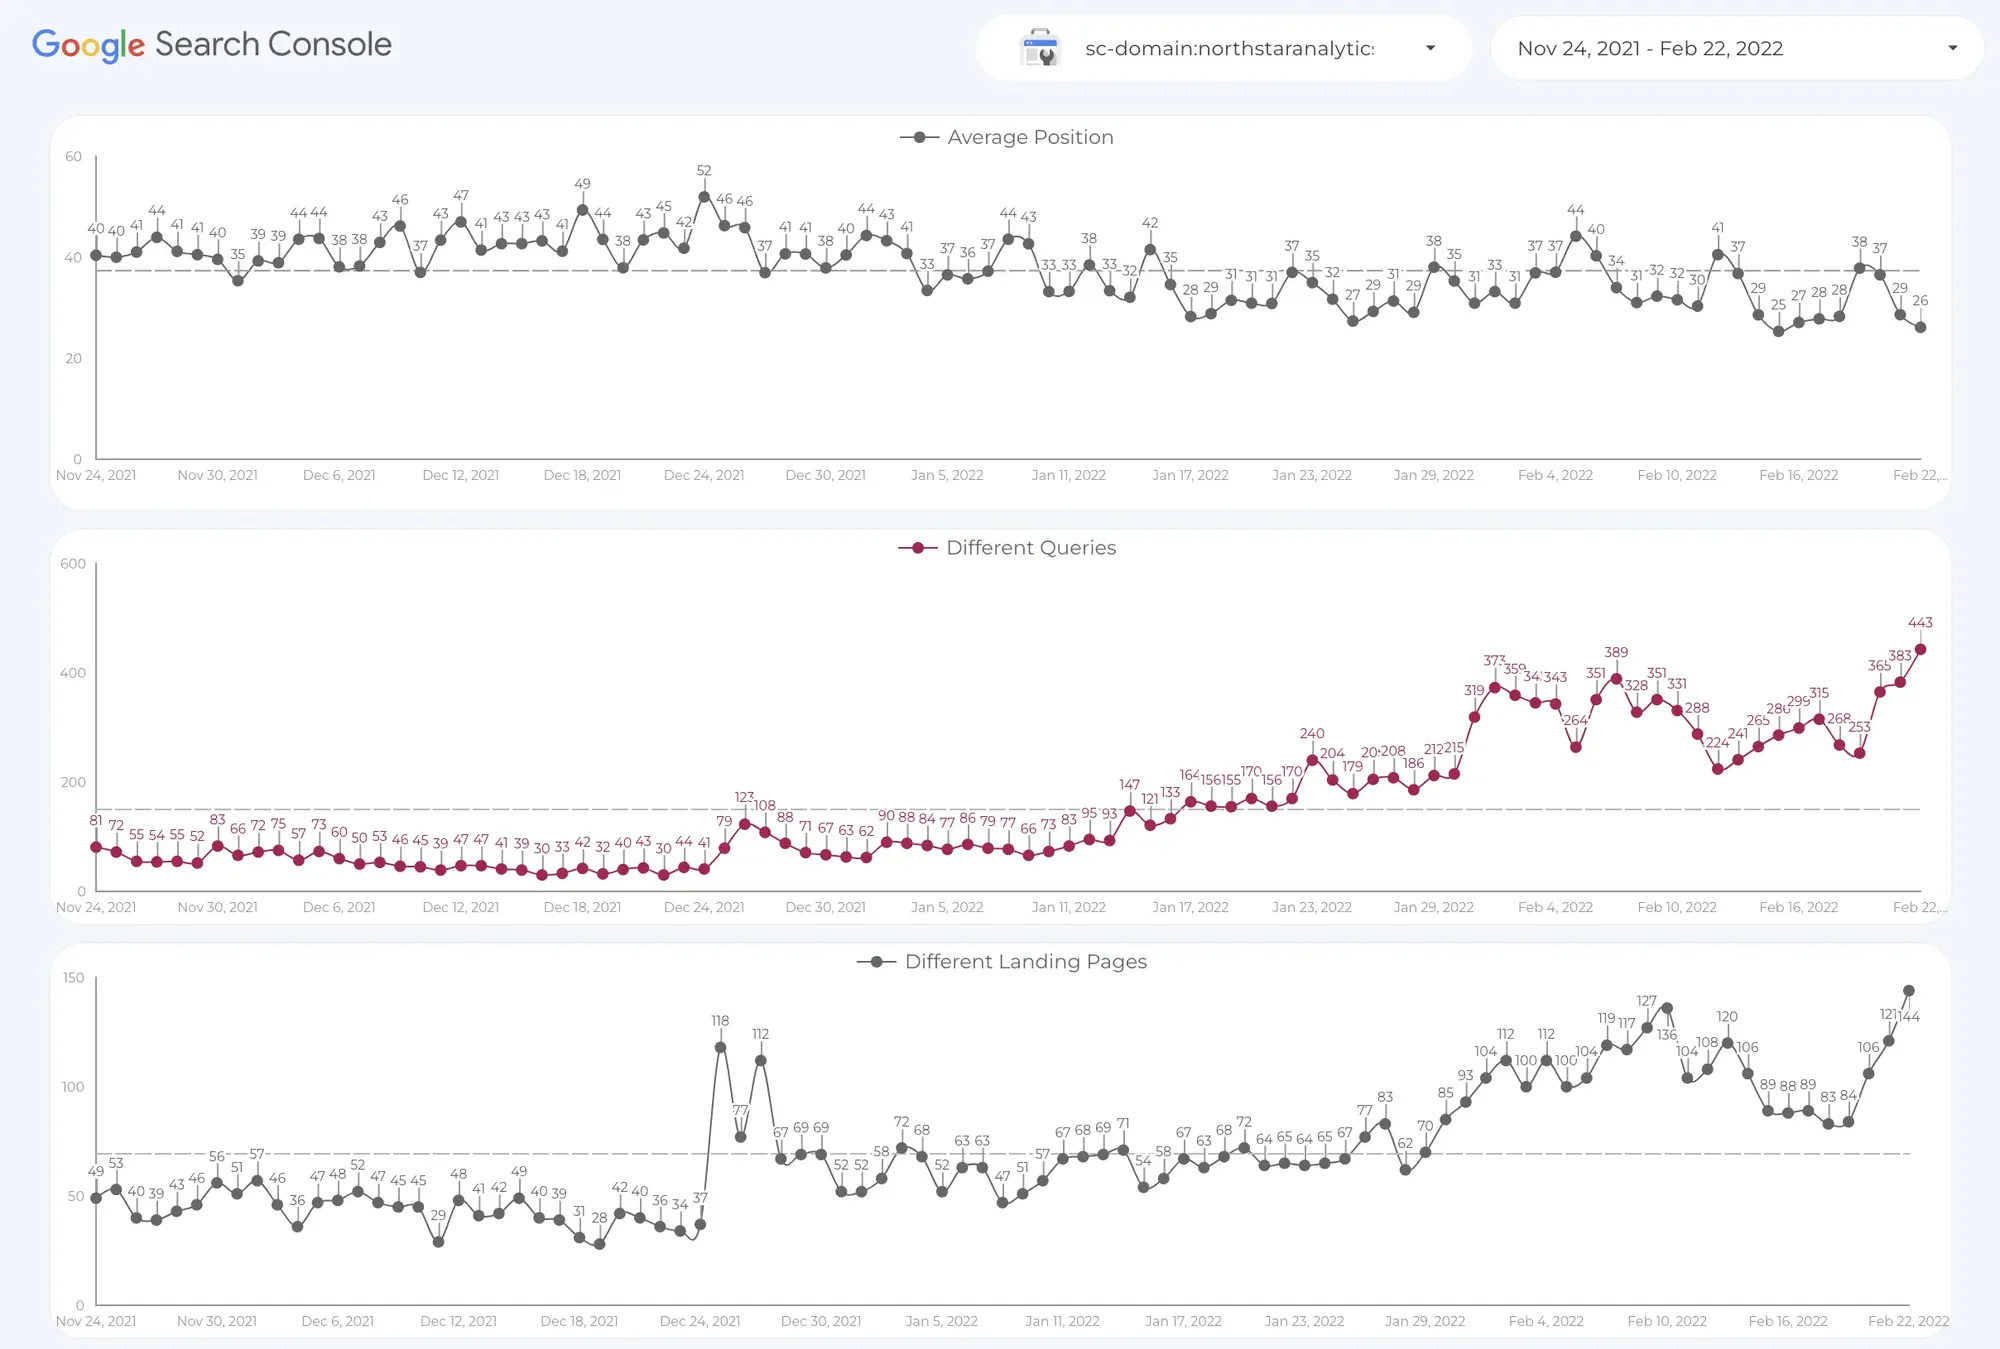
Overall trends
If you don't want to deal with all the details but want to track all the important metrics to push the SEO guy if needed, this is the perfect page for you.
There are only important metrics in trend charts without any breakdown. You'll both know the direction of each metric and your organic presence also doesn't distract with the minor details that your SEO guy should focus on.
Look at the below screenshot. The average position has been decreased which is a great thing because we are aiming to place in the first (1) position theoretically.
Also, 12 different pages have organic visibility which increase the change of our organic traffic increase in the future.
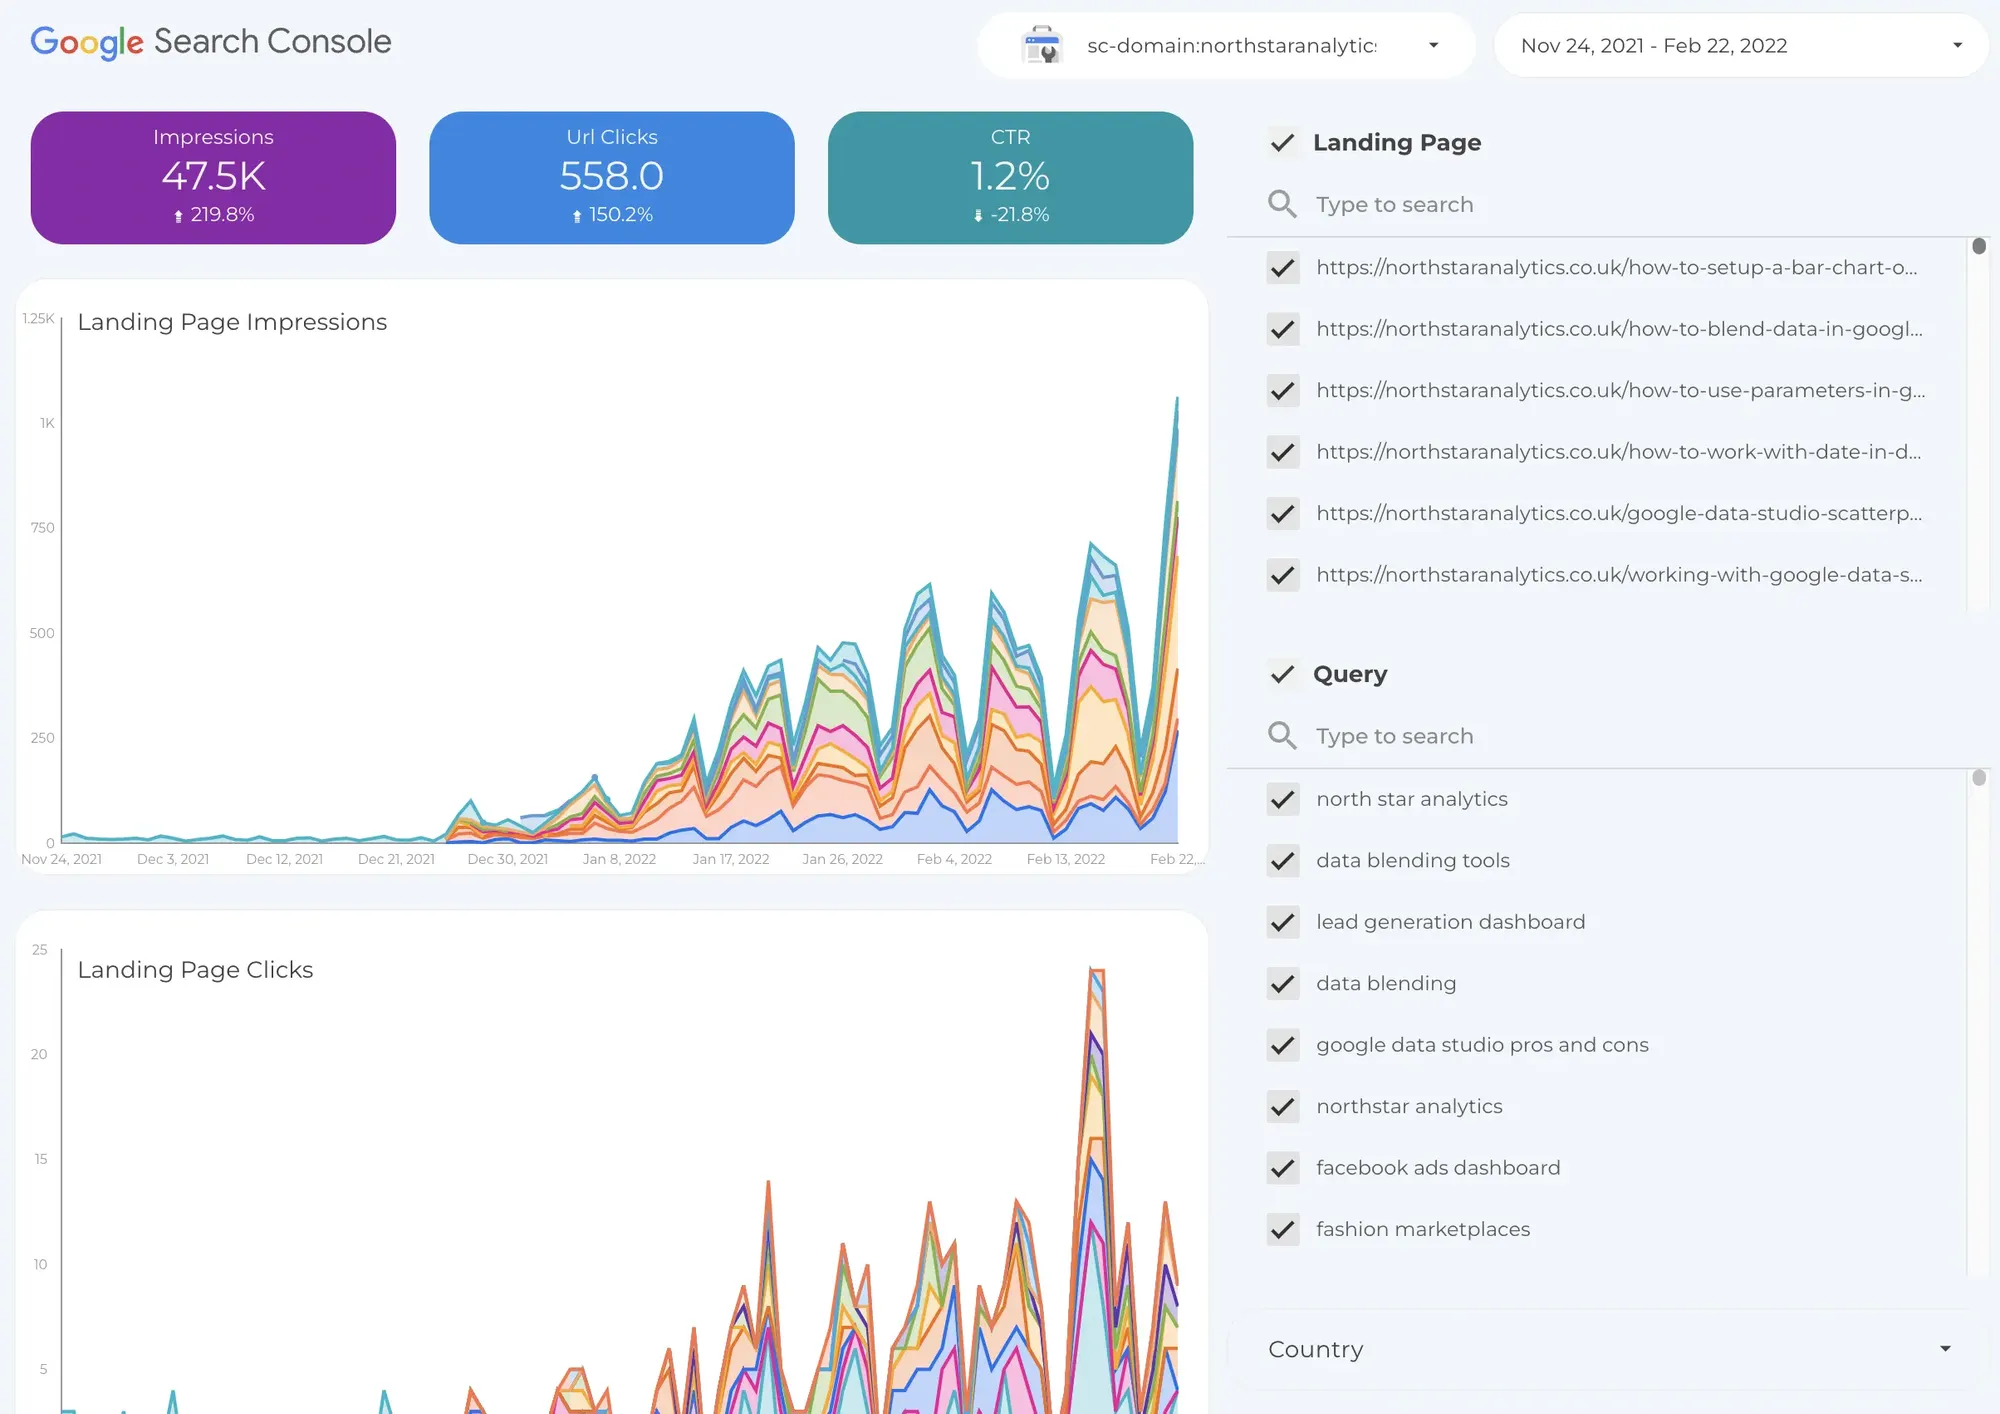
Landing page trends
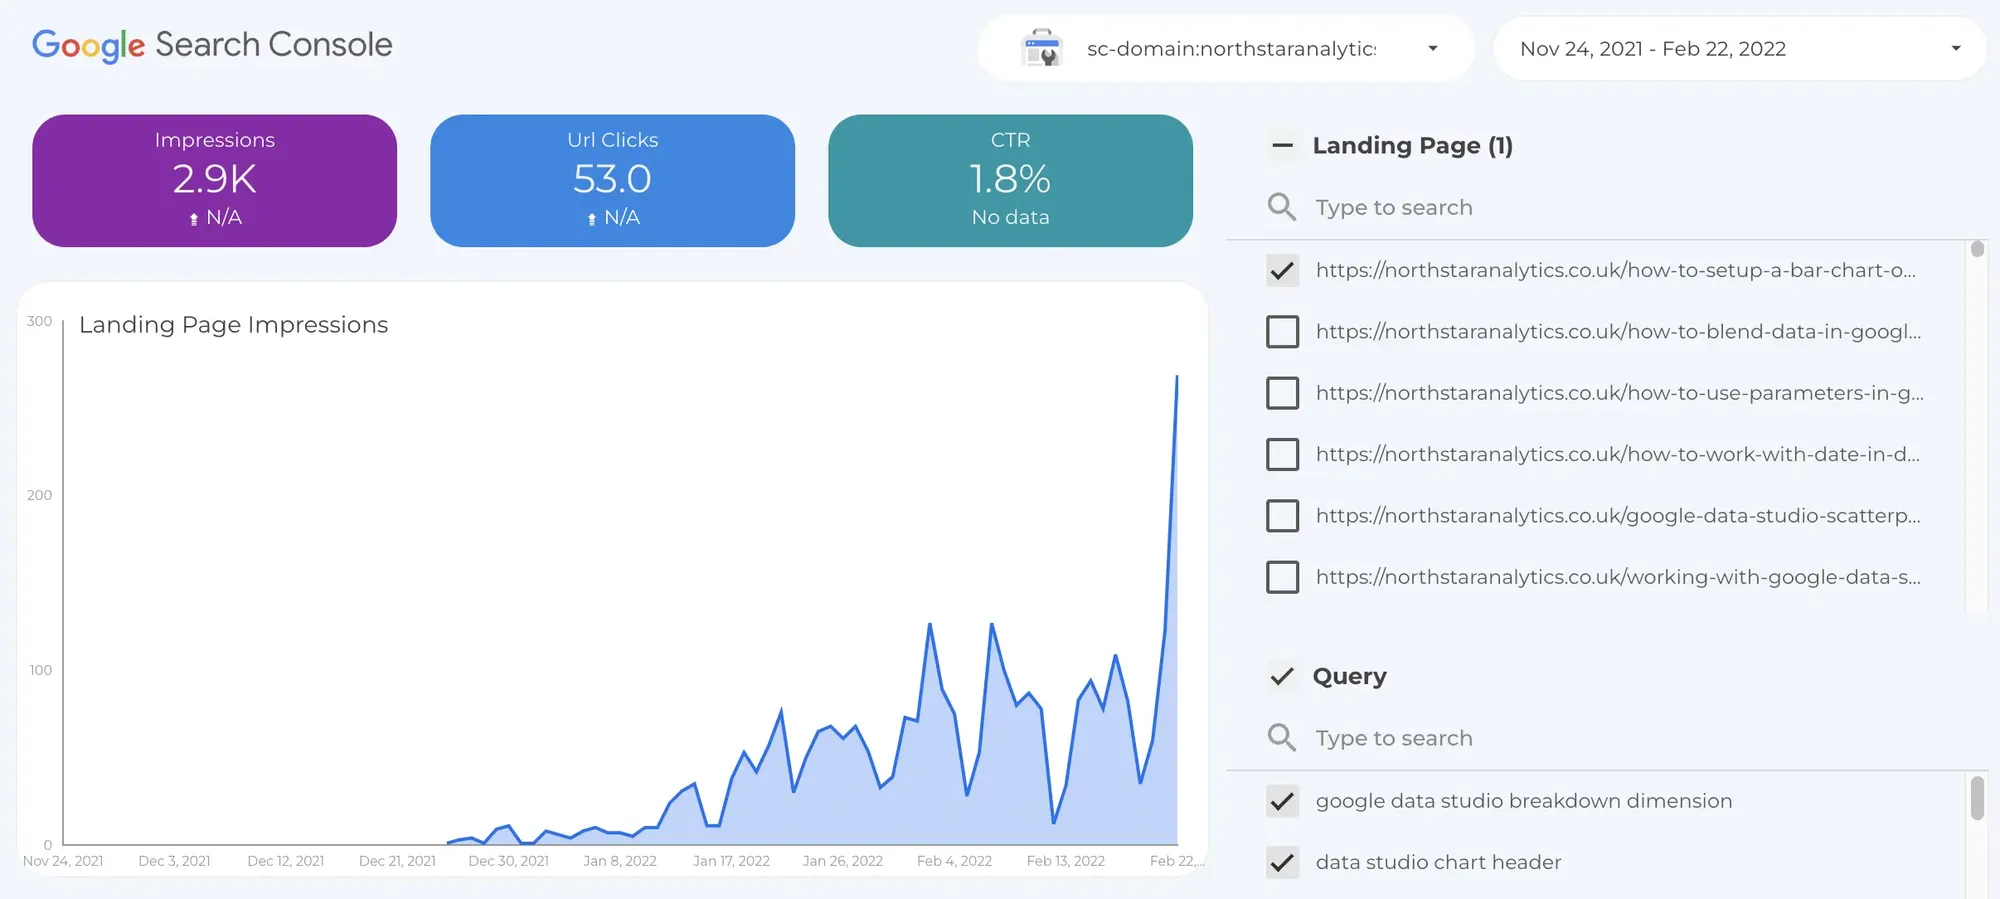
Search engine optimization is about the introduction of the right keywords to the right landing page. The below page will show us the impression, click, and CTR trends for every page you have and gets an impression.
If you don't click anything the page should be like below. You'll have 2 line charts with the breakdown of the top 10 keywords according to impression.
If you click any landing page or query on the right panel then, you will filter the whole page and the line charts, too. This SEO Data Studio template will give only this landing page or query's impression, click, and CTR performance.
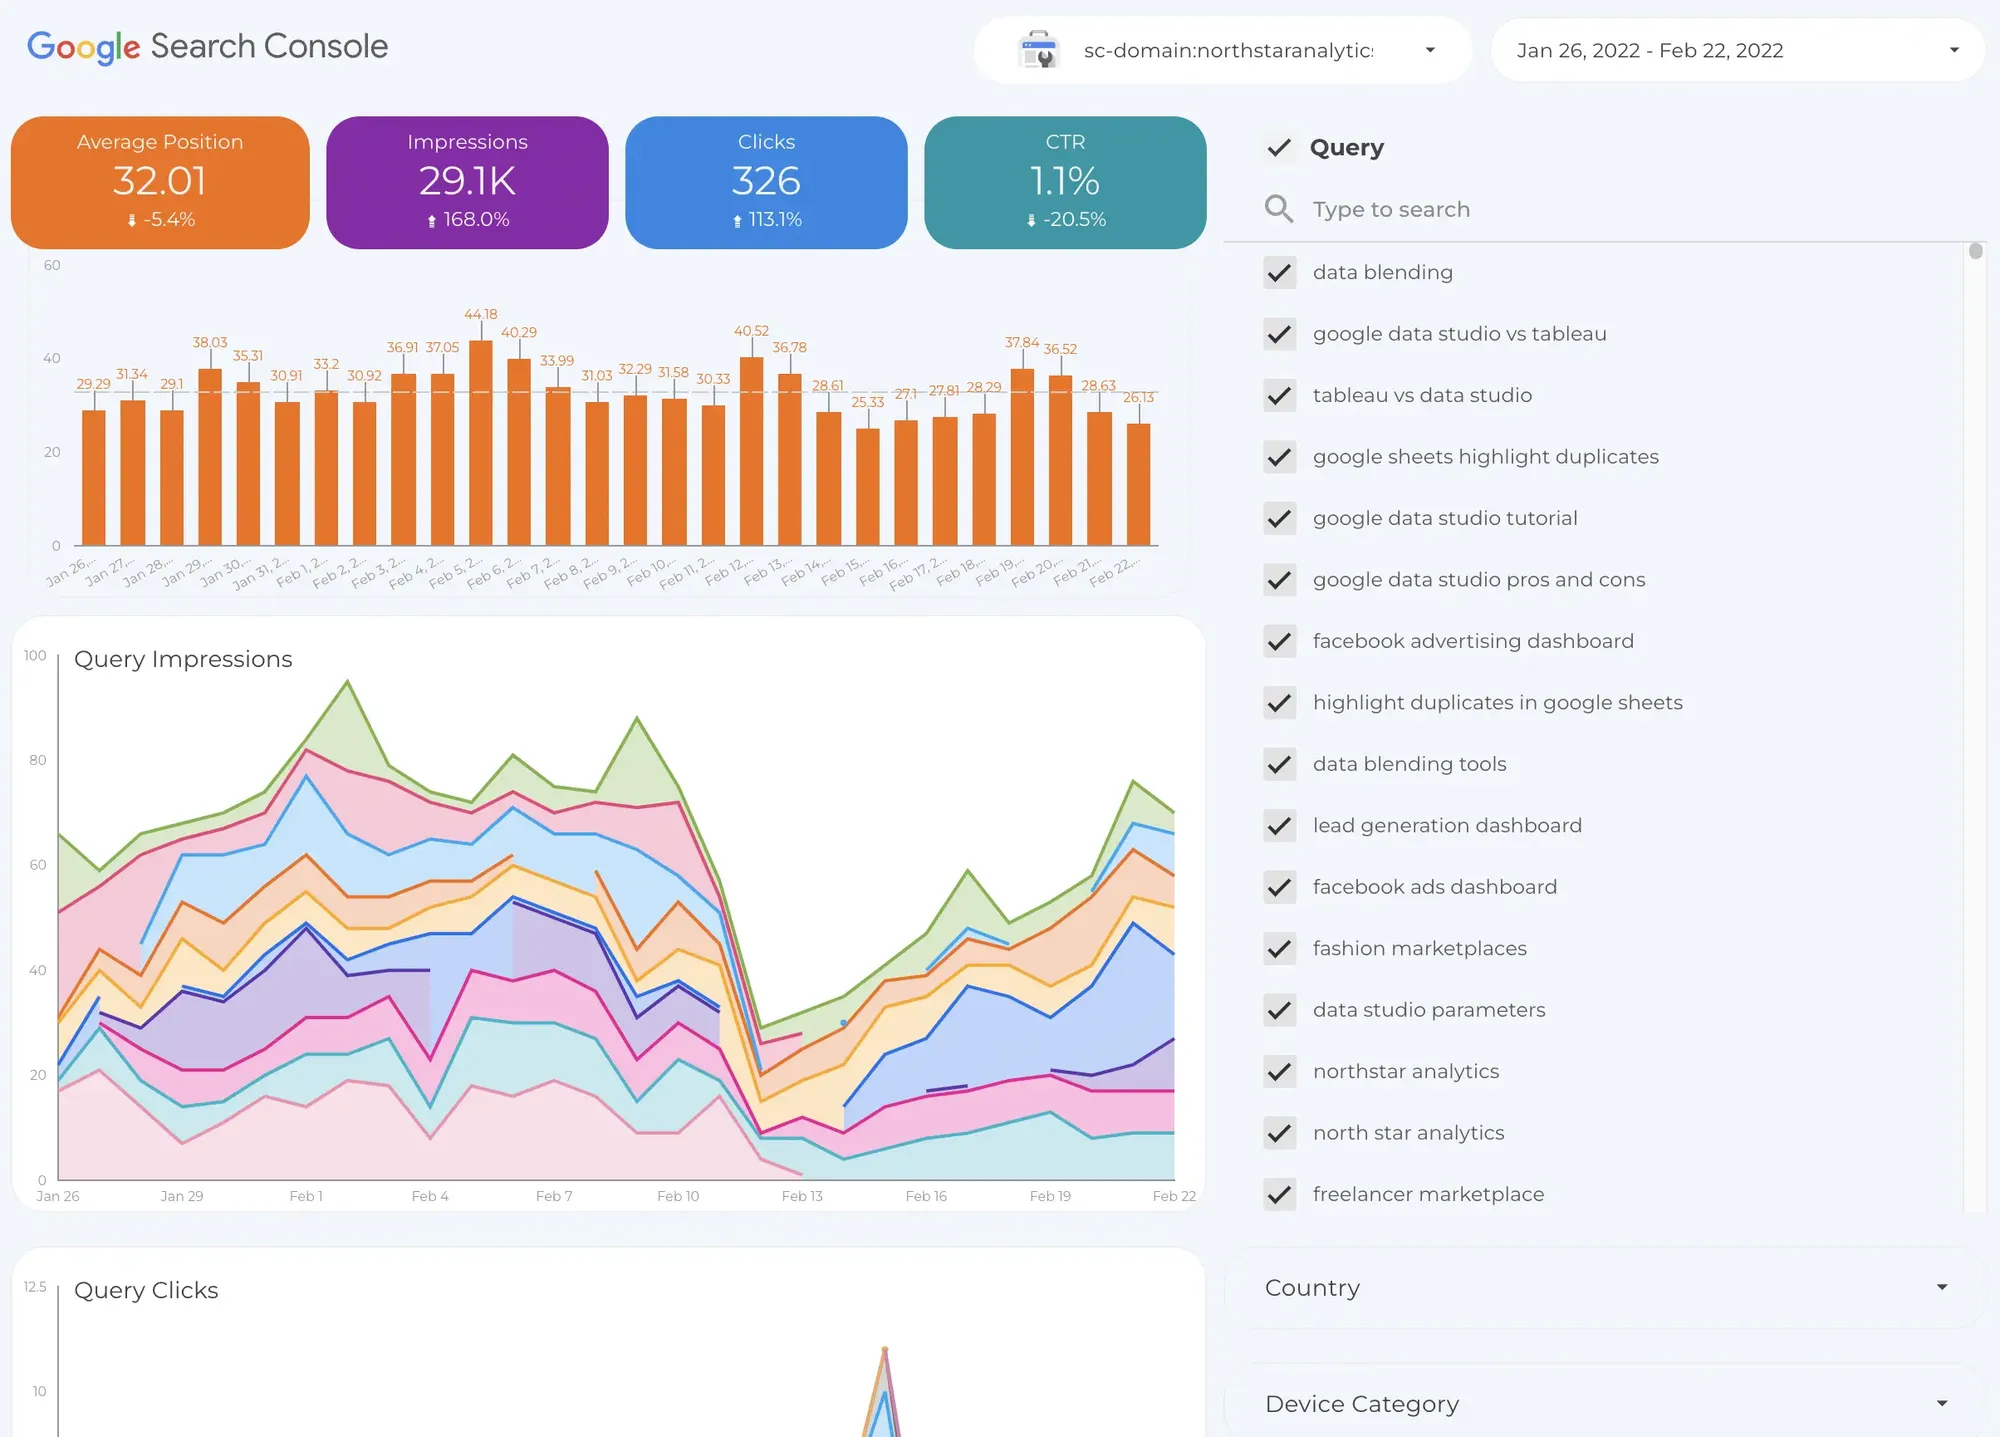
Organic keyword trends
This page of the Google Data Studio template is the same as above except "Average Position" metric. This metric is so important that we added our second data source just to get this metric.
I always click every query on the right side of the dashboard and review the average position of this keyword. The position is the indicator of you are doing great in the SEO space.
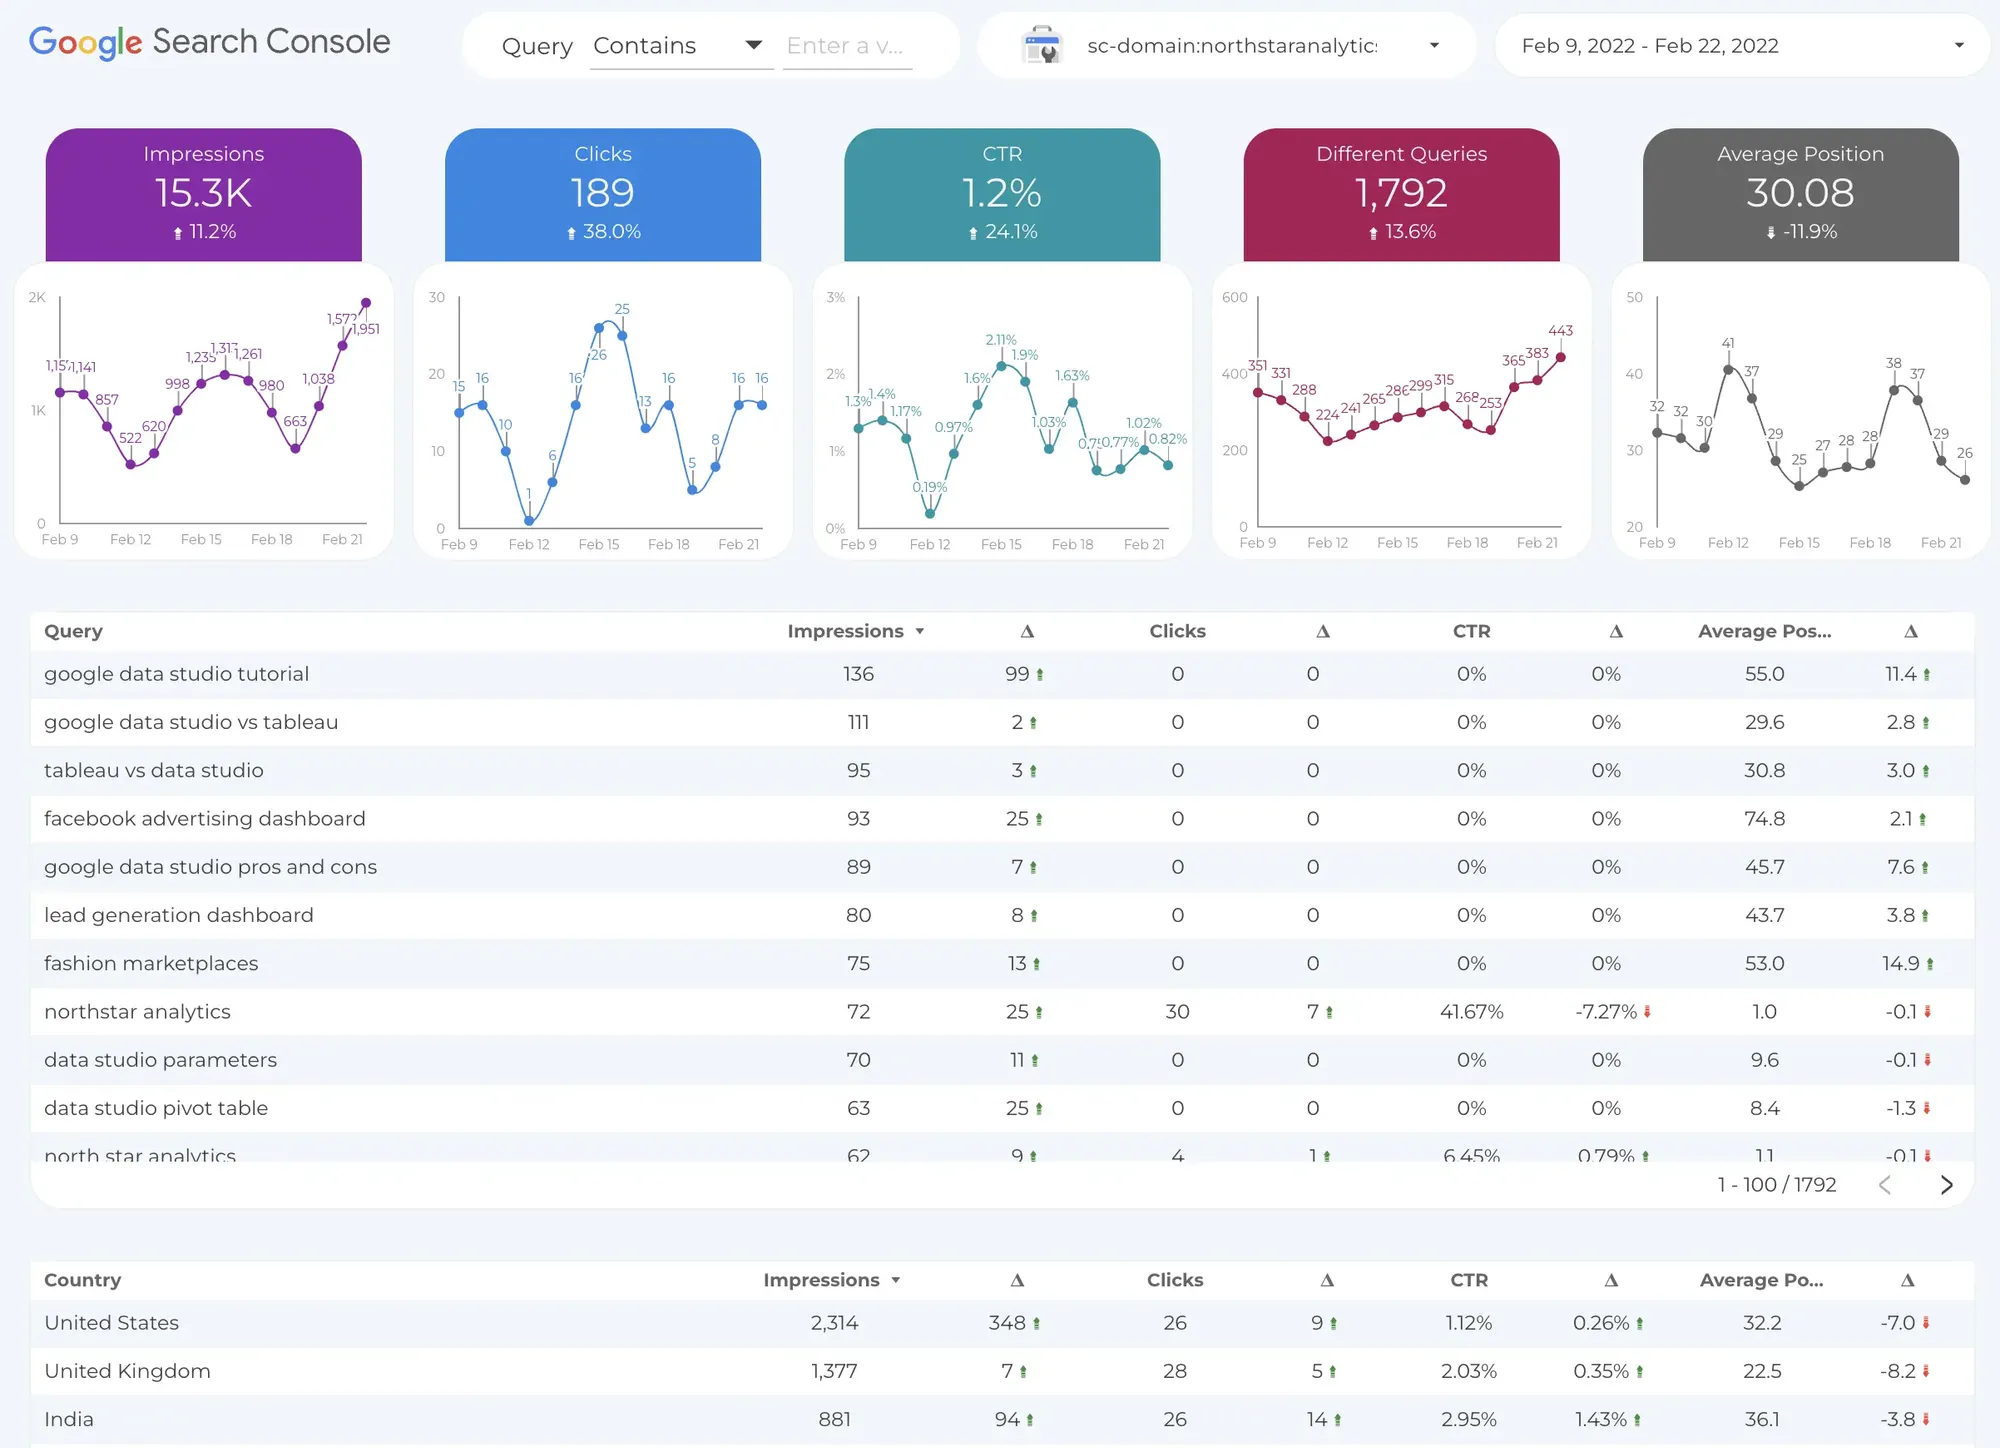
Query analysis page
This is the first page designed for the most technical SEO guy in your team, or you. We have looked at the overall trends, trends per landing page, and queries so far. But, what if we see the comparison for EVERY detail?
Honestly, I like trend pages more than this page but, I have to use this page to be sure that I don't miss anything. There are so many breakdowns and sometimes it will be hard to follow each easily.
If you look at the first row of the below table you can easily see "google data studio tutorial" keyword has more impressions than the previous period but, it lost its position. Now the keyword is 11 rows behind where it was in the previous period.
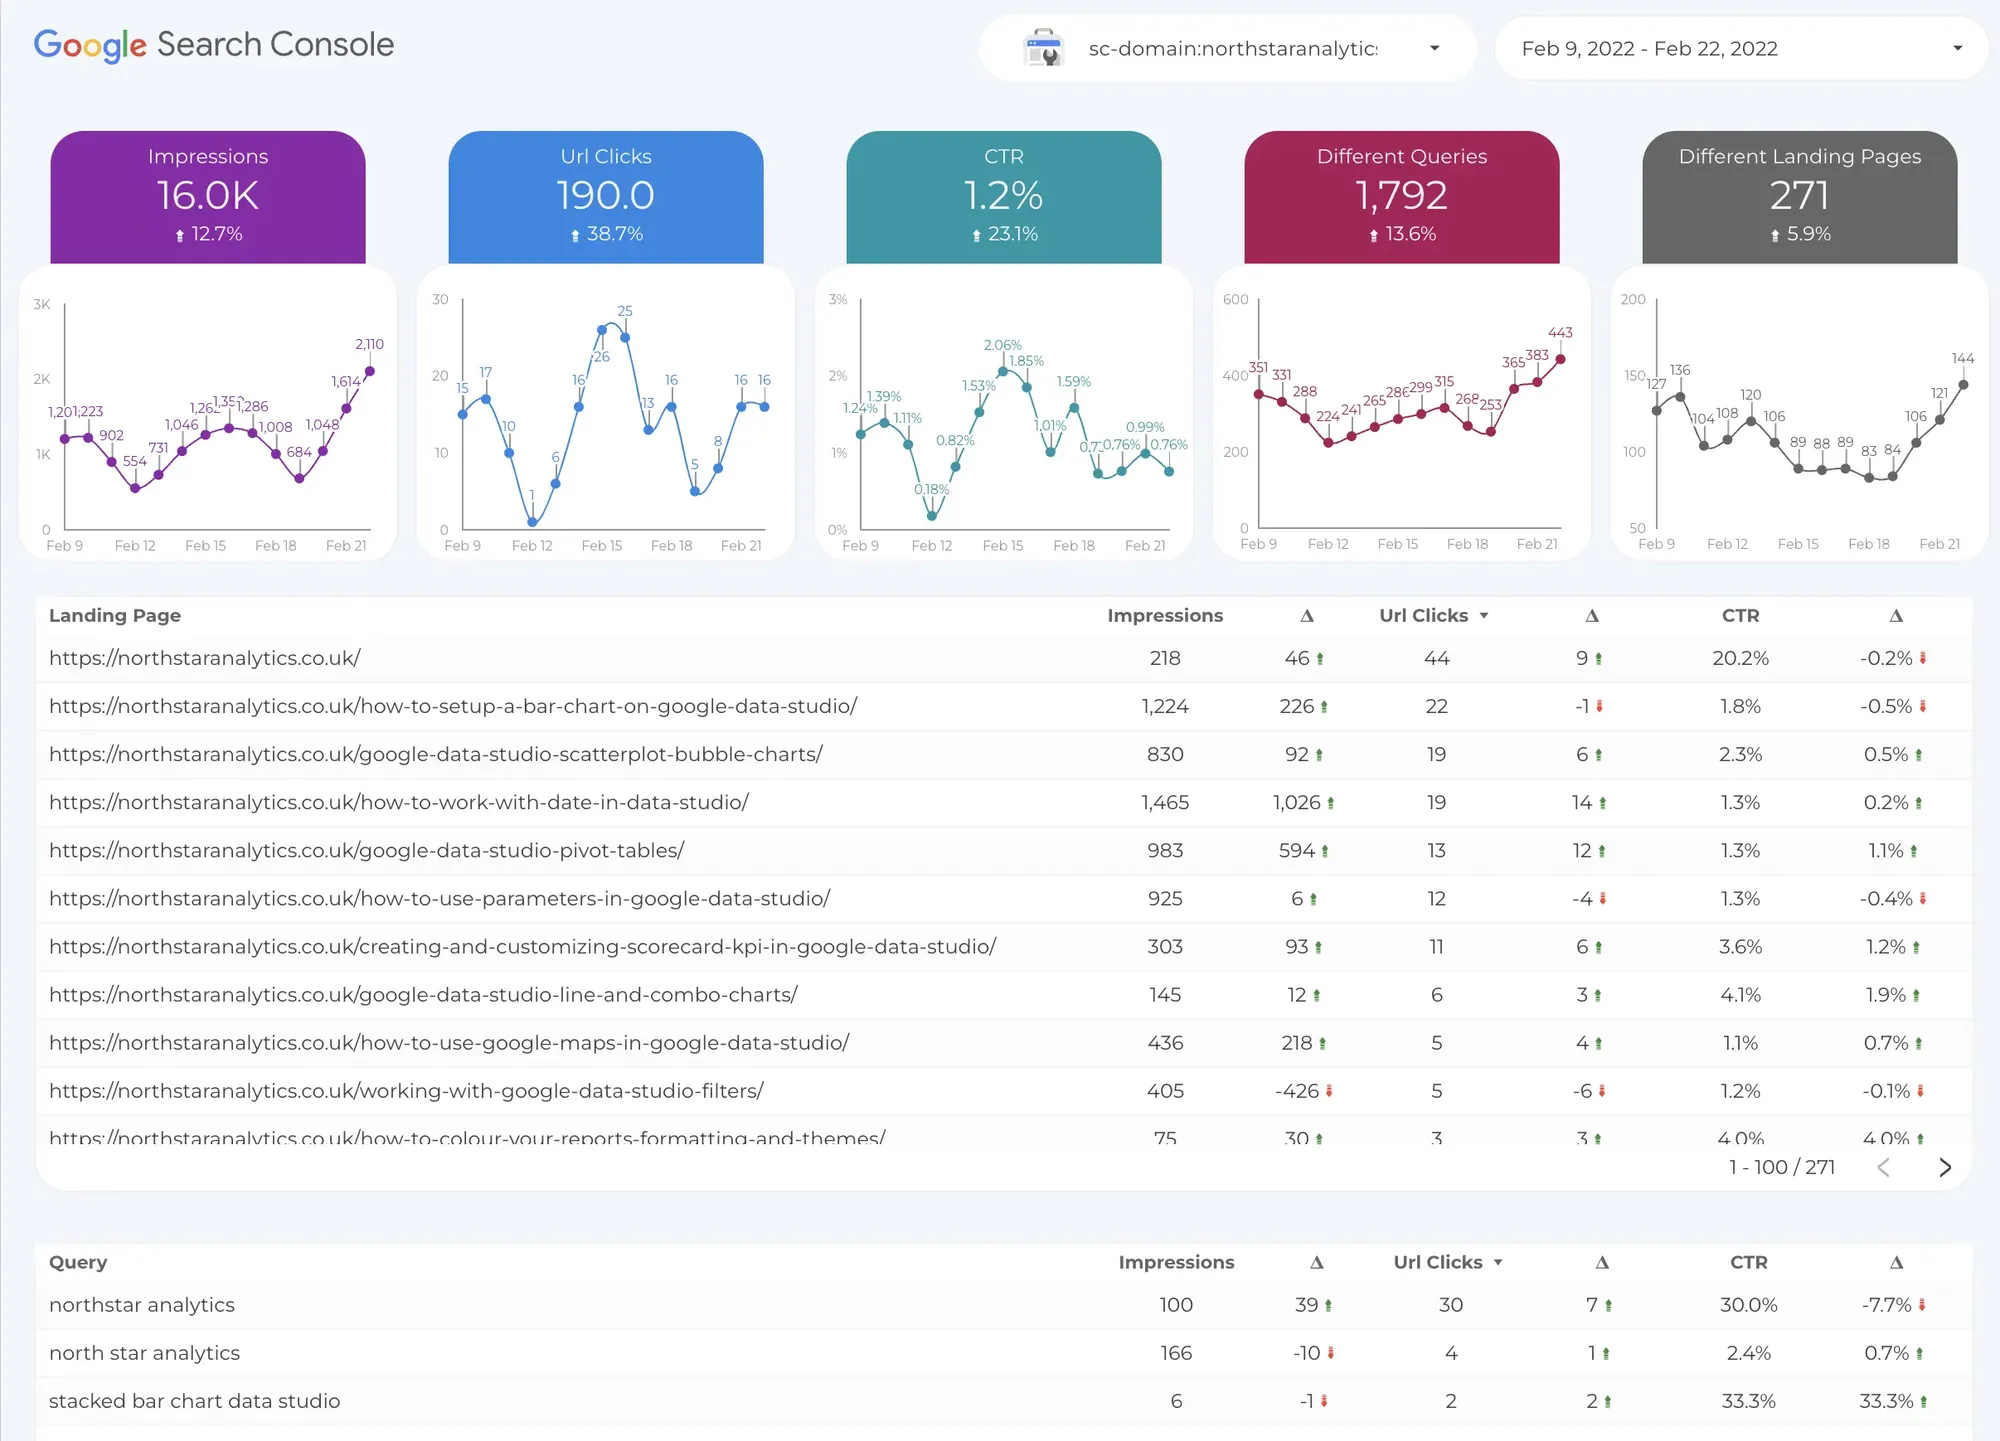
Landing page analysis page
This page is designed for a technical person as the above page and shows the landing page performance changes. Look at the /working-with-google-data-studio-filters page. It lost half of its impressions. That is why we updated that article a week ago.
How am I analysing my SEO performance?
I would like to walk through how I'm analyzing my landing page with this Google Data Studio dashboard template. Since I'm a technical guy who loves looking at trend charts; landing pages and query trend pages are my favorite ones.
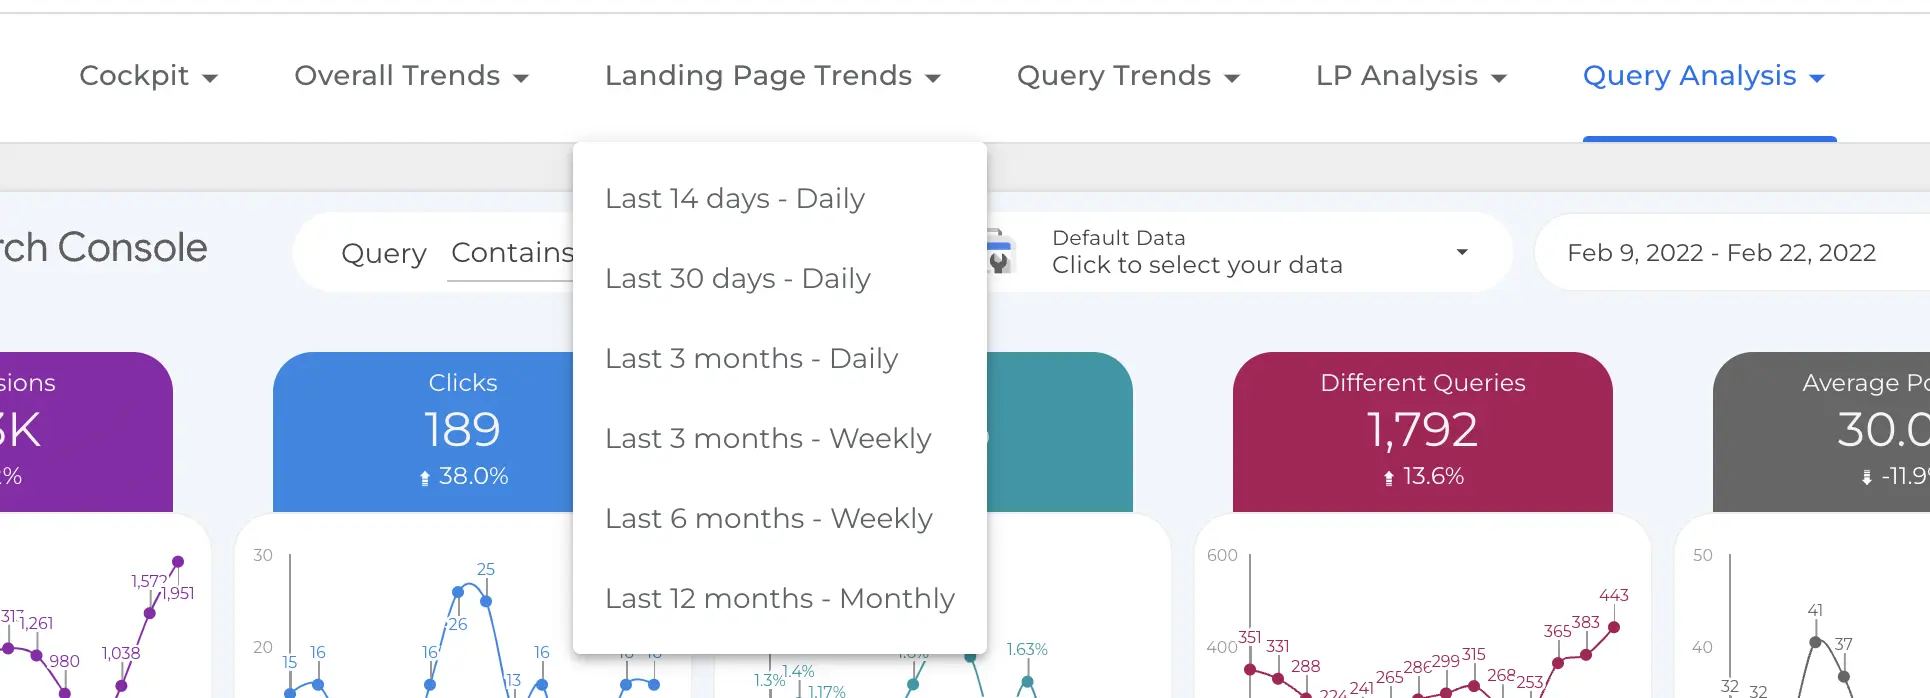
Mostly, I'm selecting the last 3 months on the top menu to see enough time range to decide whether the project is doing great or not. Then, I start clicking each landing page on the right filters.
Look at the first one in the following screenshot. It gains huge traction in terms of the impression thanks to Selim's update.
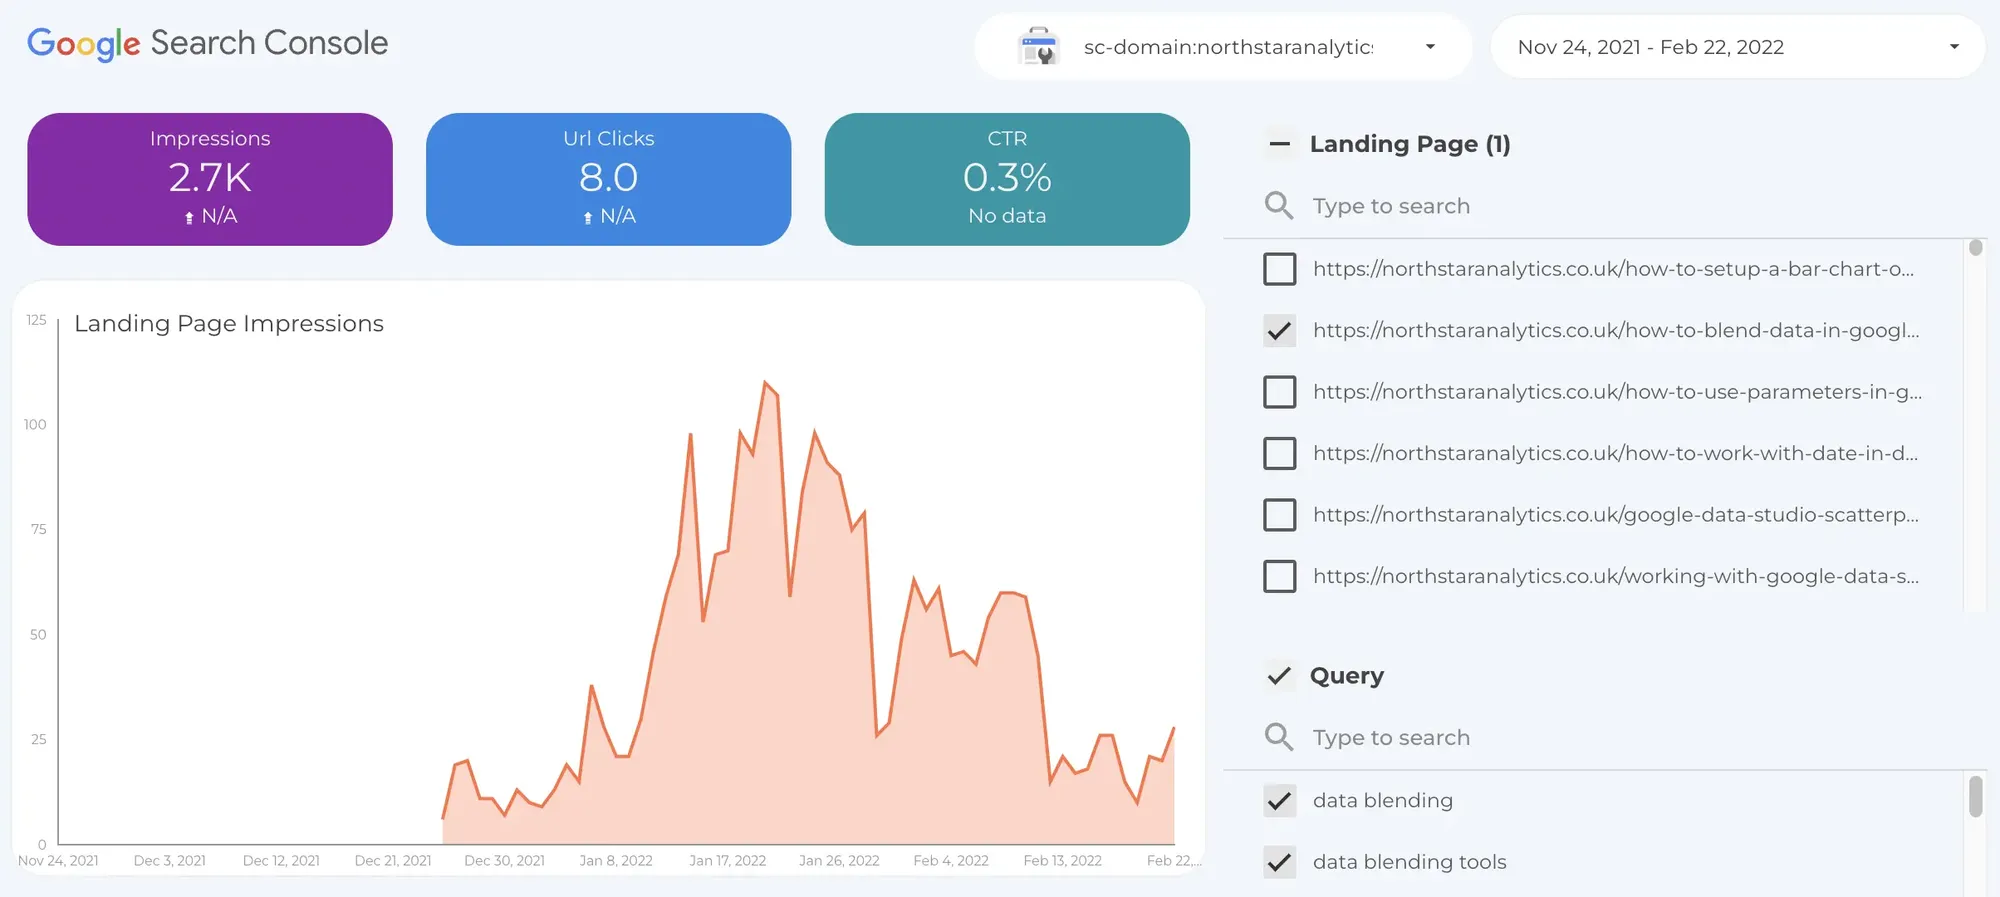
But, the second landing page is losing traction in Google's eyes. We have looked at the competitors and noticed that our content was out of date now since Google Data Studio came up with the enhanced blending.
We are writing new content and updating the article ASAP.
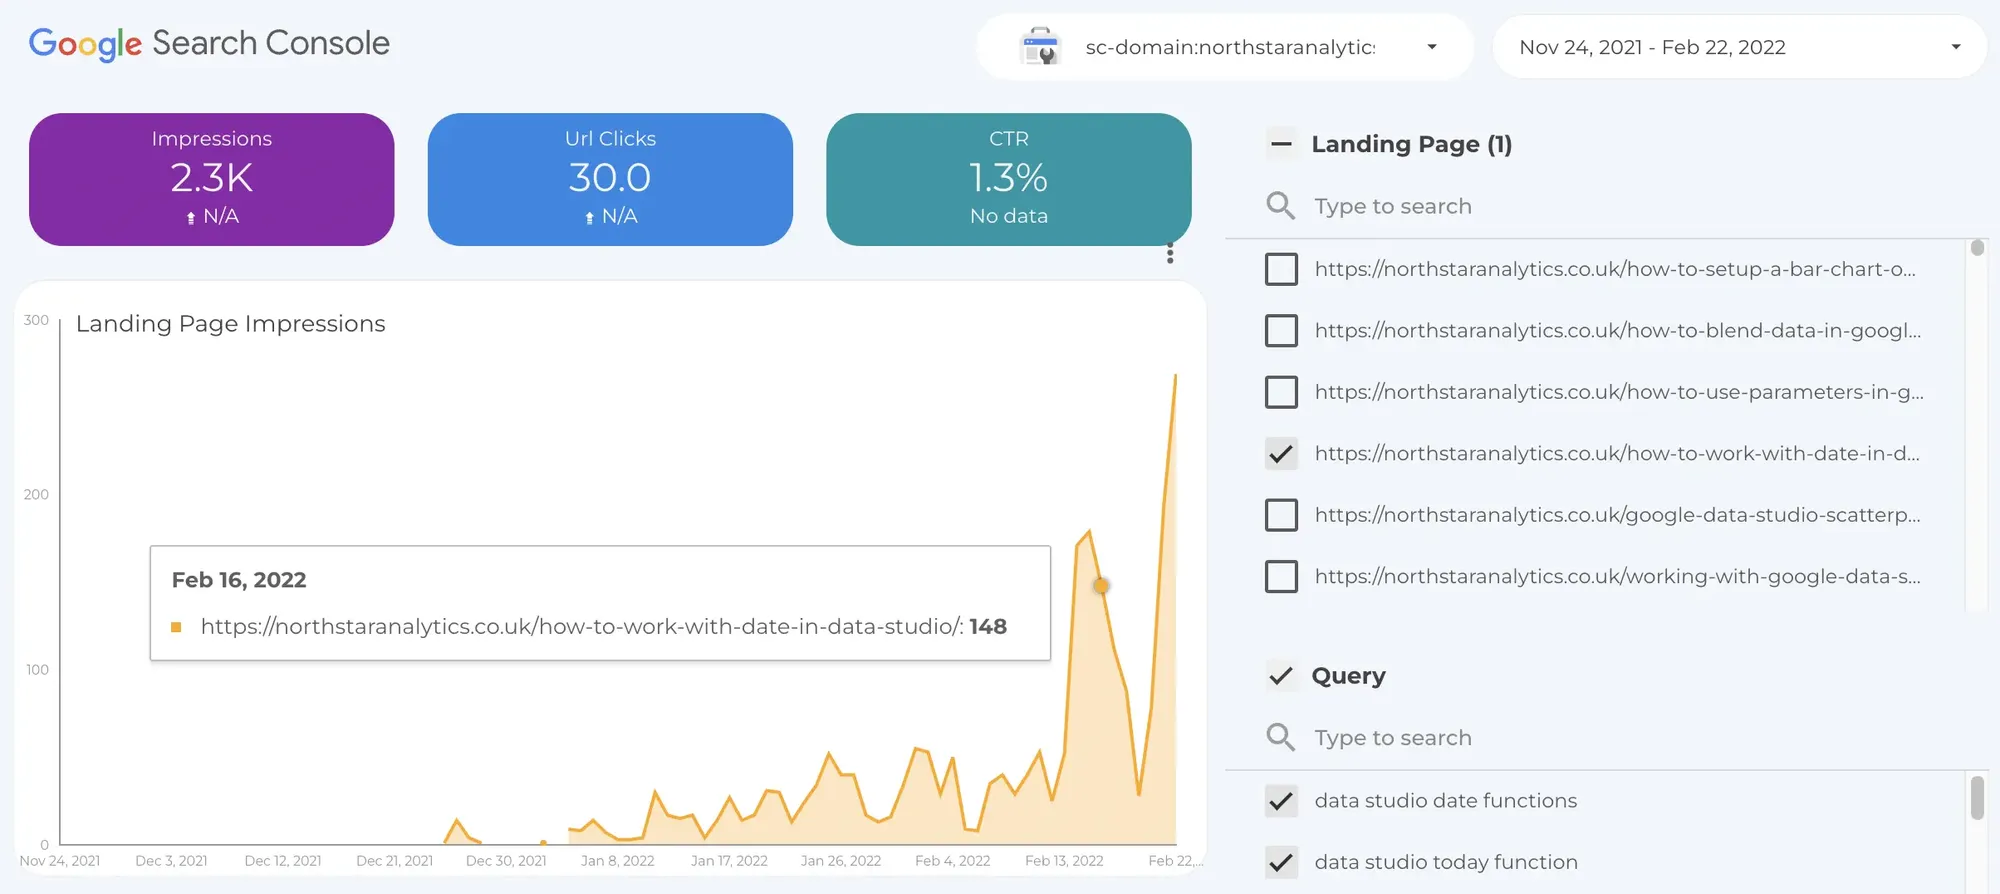
The last example is one of the great ones. We have been updated this article recently and it is gaining traction.
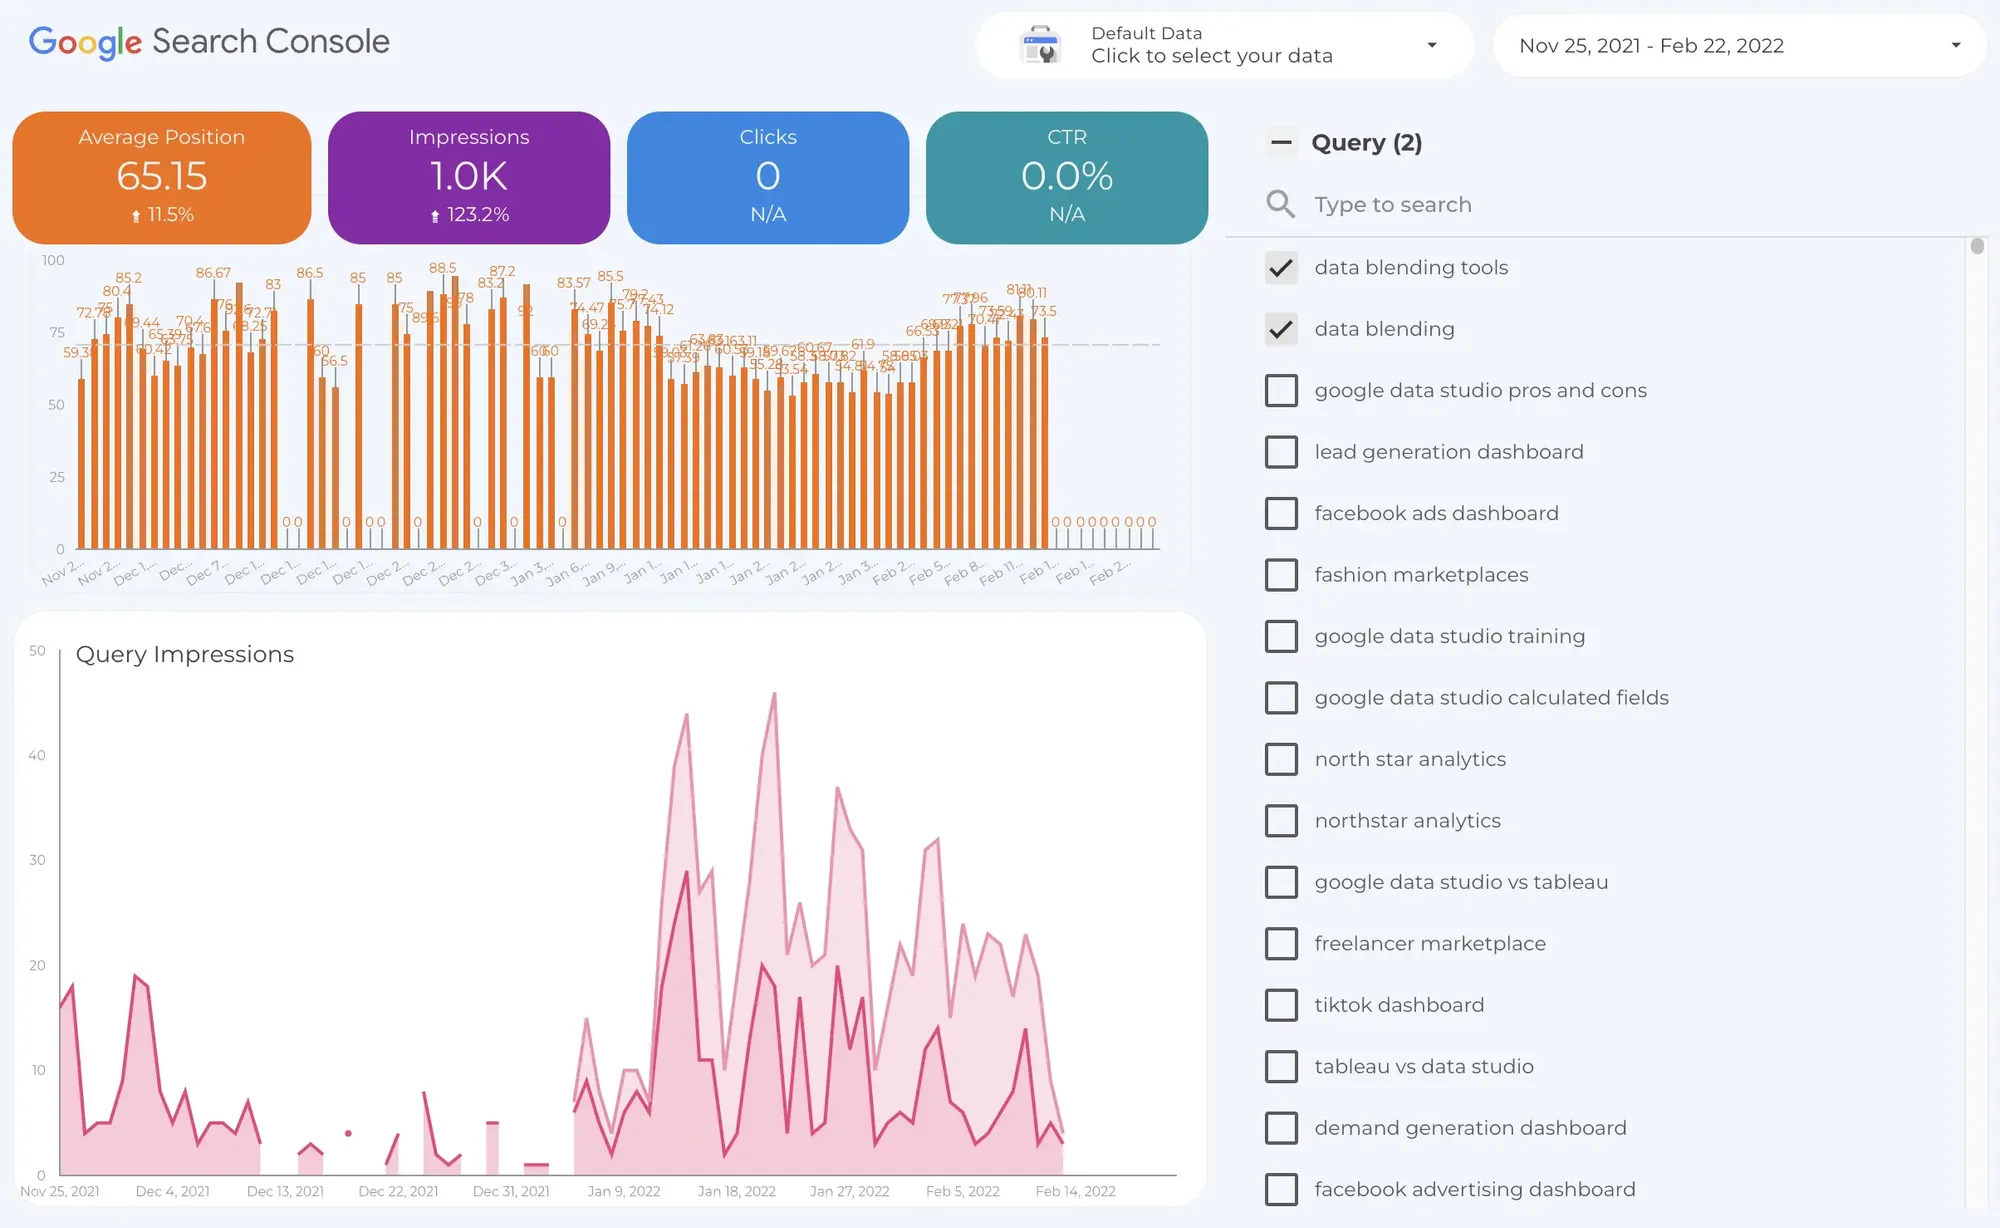
The query trends page is just as important as landing page trends but, I'll only one example from this page to not stretch this content a lot.
I love data blending and am using it for almost every project but, I noticed that we don't get listed in the search results even we have content on this topic. I noticed this while I'm preparing this article so, we'll take care of this problem and be sure that the page will be indexed and getting traffic from this keyword.
How to purchase this template?
If you need a custom-made dashboard then, please reach us through the contact page, if you prefer to purchase the template and edit by yourself please check one of the options below.
Through Fiverr
If you have a Fiverr account and like to proceed through here then, please follow this link to access our Fiverr account page.
Through Etsy
We are putting these templates on our Etsy page, too. Here is the link to the store in case you have an Etsy account and prefer to proceed through this platform.
You may think why all of these dashboards cost so little. Because you caught me in the phase of learning how to sell digital products rather than my hours. So, enjoy your templates, and let me know if you have any feedback for them.
Subscribe to the lifetime plan
We are offering lifetime access for current and all future templates. Also, you'll have a template request option without extra cost if the template gallery hasn't included it yet.
Click here for details: https://northstaranalytics.co.uk/membership/
How to copy this dashboard?
Please visit the following article to export Klaviyo data to Google Sheets then, visit the following article again or this Loom recording.
 Ebru MULBAY


