How to Use GOOGLEFINANCE Function in Google Sheets?

With the GOOGLEFINANCE function, we can easily transfer our data from the Google finance web application to our worksheet.
We can receive real-time foreign exchange and financial information daily, and we can track stocks. In addition, we can get historical securities data, show them with graphics and easily share what we do with others. A stock's opening value, closing value, highest or lowest value, closing values for the last 3 months, etc.
Let's look at the function syntax and how it works through an example.
What is the syntax for the GOOGLEFINANCE function?
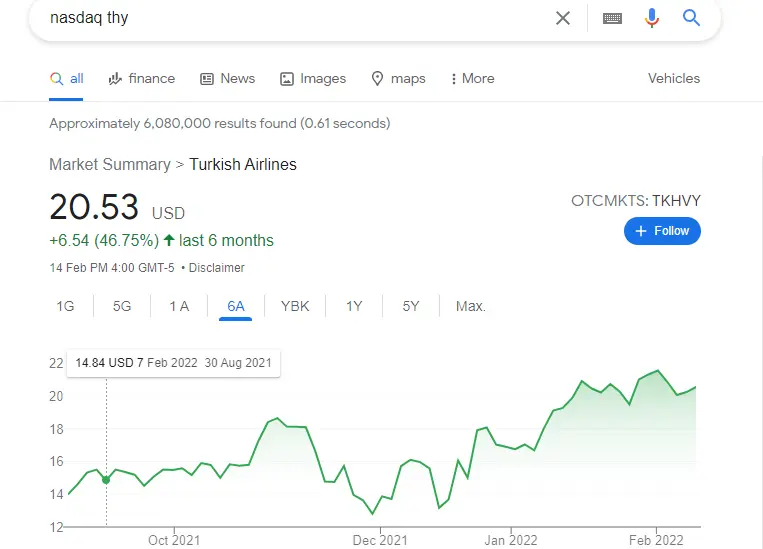
Let's transfer this page we searched on Google to our own worksheet, only the information we want.
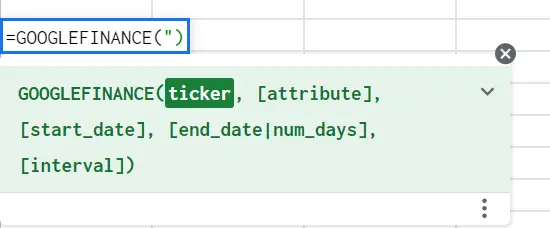
The syntax of the GOOGLEFINANCE function is as above. Let's explain in order.
=GOOGLEFINANCE(ticker,[attribute],[start_date],[end_date | num_days],[interval])
Ticker: The stock whose data we want to get. In our example, THYAO
Attribute: What do we want for the stock we want? We can bring the features I will write below to our page.
- name: Returns only the name of the stock we are looking for.
- price: Gets the real-time price. (20 min delayed)
- low: Lowest price of the day
- high: The highest price of the day
- all: brings all
- change: change in price compared to the previous day
- changepct: percentage change in price compared to the previous day
- low52: lowest price for the past 52 weeks
- high52: the highest price in the past 52 weeks
- volume: the trading volume of the day
- vomueavg: Average daily trading volume
- marketcap: market value of the stock
- PE: Earnings per share
- shares: number of outstanding shares
- beta: beta value
- netasets: net assets
- open: the opening price on a date
- close: closing price on a date
[start_date]: We use it to get values in a certain range. Specify the date from which date.
[end_date | num_days]: We use to get values in a certain range. It specifies what date it will be or how many days we want to get from the start.
[interval]: We use it to specify the time-frequency when we get a specific date range. It can be daily or weekly.
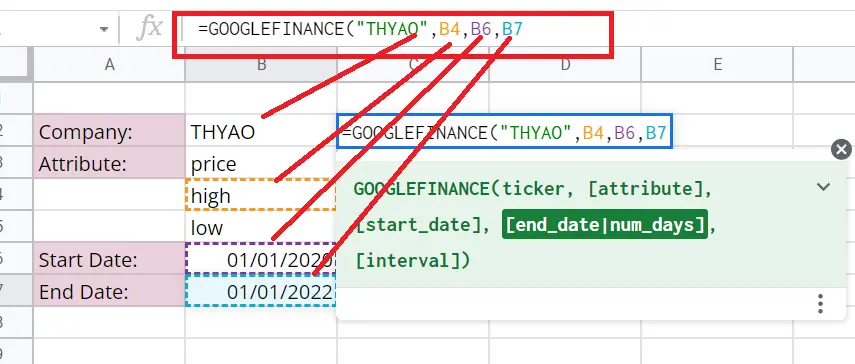
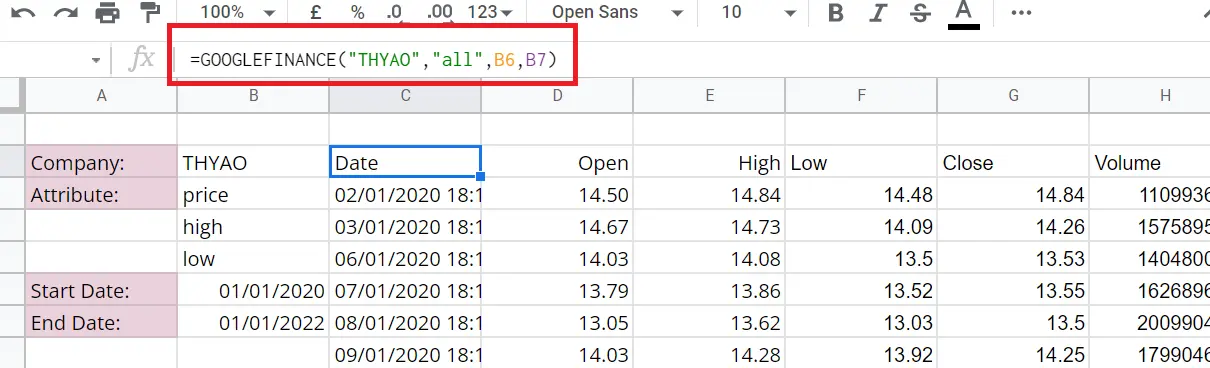
=GOOGLEFINANCE("THYAO","high","01/01/2020","01/01/2022")
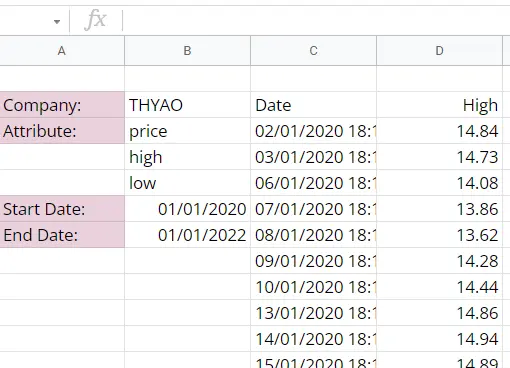
I created a table with a few of the above attributes. It can be written inside a function or used this way. After closing the function, my worksheet will be as follows.
Let's see what happens if we do attribute=all.
Since we have the data of the stocks, we can create graphs with this data as we want. Let's choose the variables we want and add the chart by
Menu-> Insert->Chart
I will take the opening and closing values and make a Line chart.
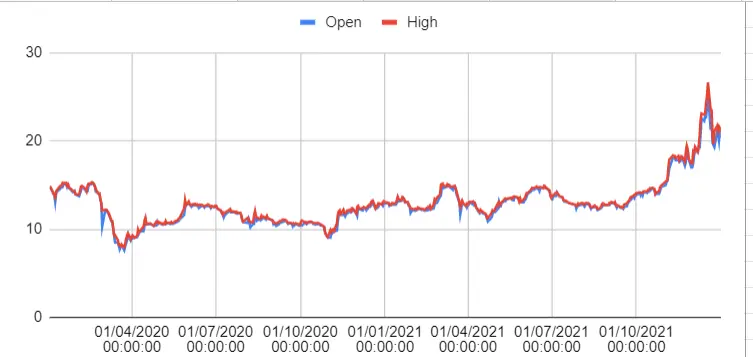
We've added our chart to our worksheet. We can format the chart as we want. You can find detailed information about this here ”How to make a graph in Google Sheets?”


