How to find your company's NorthStar KPI?

Is this article for you?
Take the 9-question test before reading this book. If you check at least 7 of them, this book is crafted just for you.
- I want to communicate with hard data. No more murky subjective talks.
- I believe that I will see a big uplift in net profit with small improvements in day to day work.
- I want my remote team to collaborate efficiently. I want to keep my team together by increasing profit.
- I want to feel connected with my whole team and sleep better at night as a manager.
- Everyone optimize their own goal in my company. But, we should work towards a common goal.
- My company is big, complex and virtual. I should see the company as a whole to increase outcome.
- I want to implement the OKR methodology. I don't know where to start.
- I believe that numbers create teamwork that solves current and future problems.
- When I encounter a problem, I want to be able to run the root cause analysis instantly.
Main elements of the KPI Tree
I will start to explain the concept with its parts. I prepared the whole book on these pieces and what they represent.

Task
It represents all the effort pieces to run your company.

Operational KPI
This KPI interacts directly with your daily tasks. If day to day work is the fuel of your company, these KPIs are the steering wheel.

Formula
All KPIs are linked to each other by simple mathematical formulas. This gave us the complete KPI tree to run a root-cause analysis.

Main KPI
These metrics are hardly affected by daily work. It is suitable for long-term trend analysis and management boards.

The NorthStar Metric
It is the single most important metric describing the purpose of the organization. It must accurately reflect the company's success.
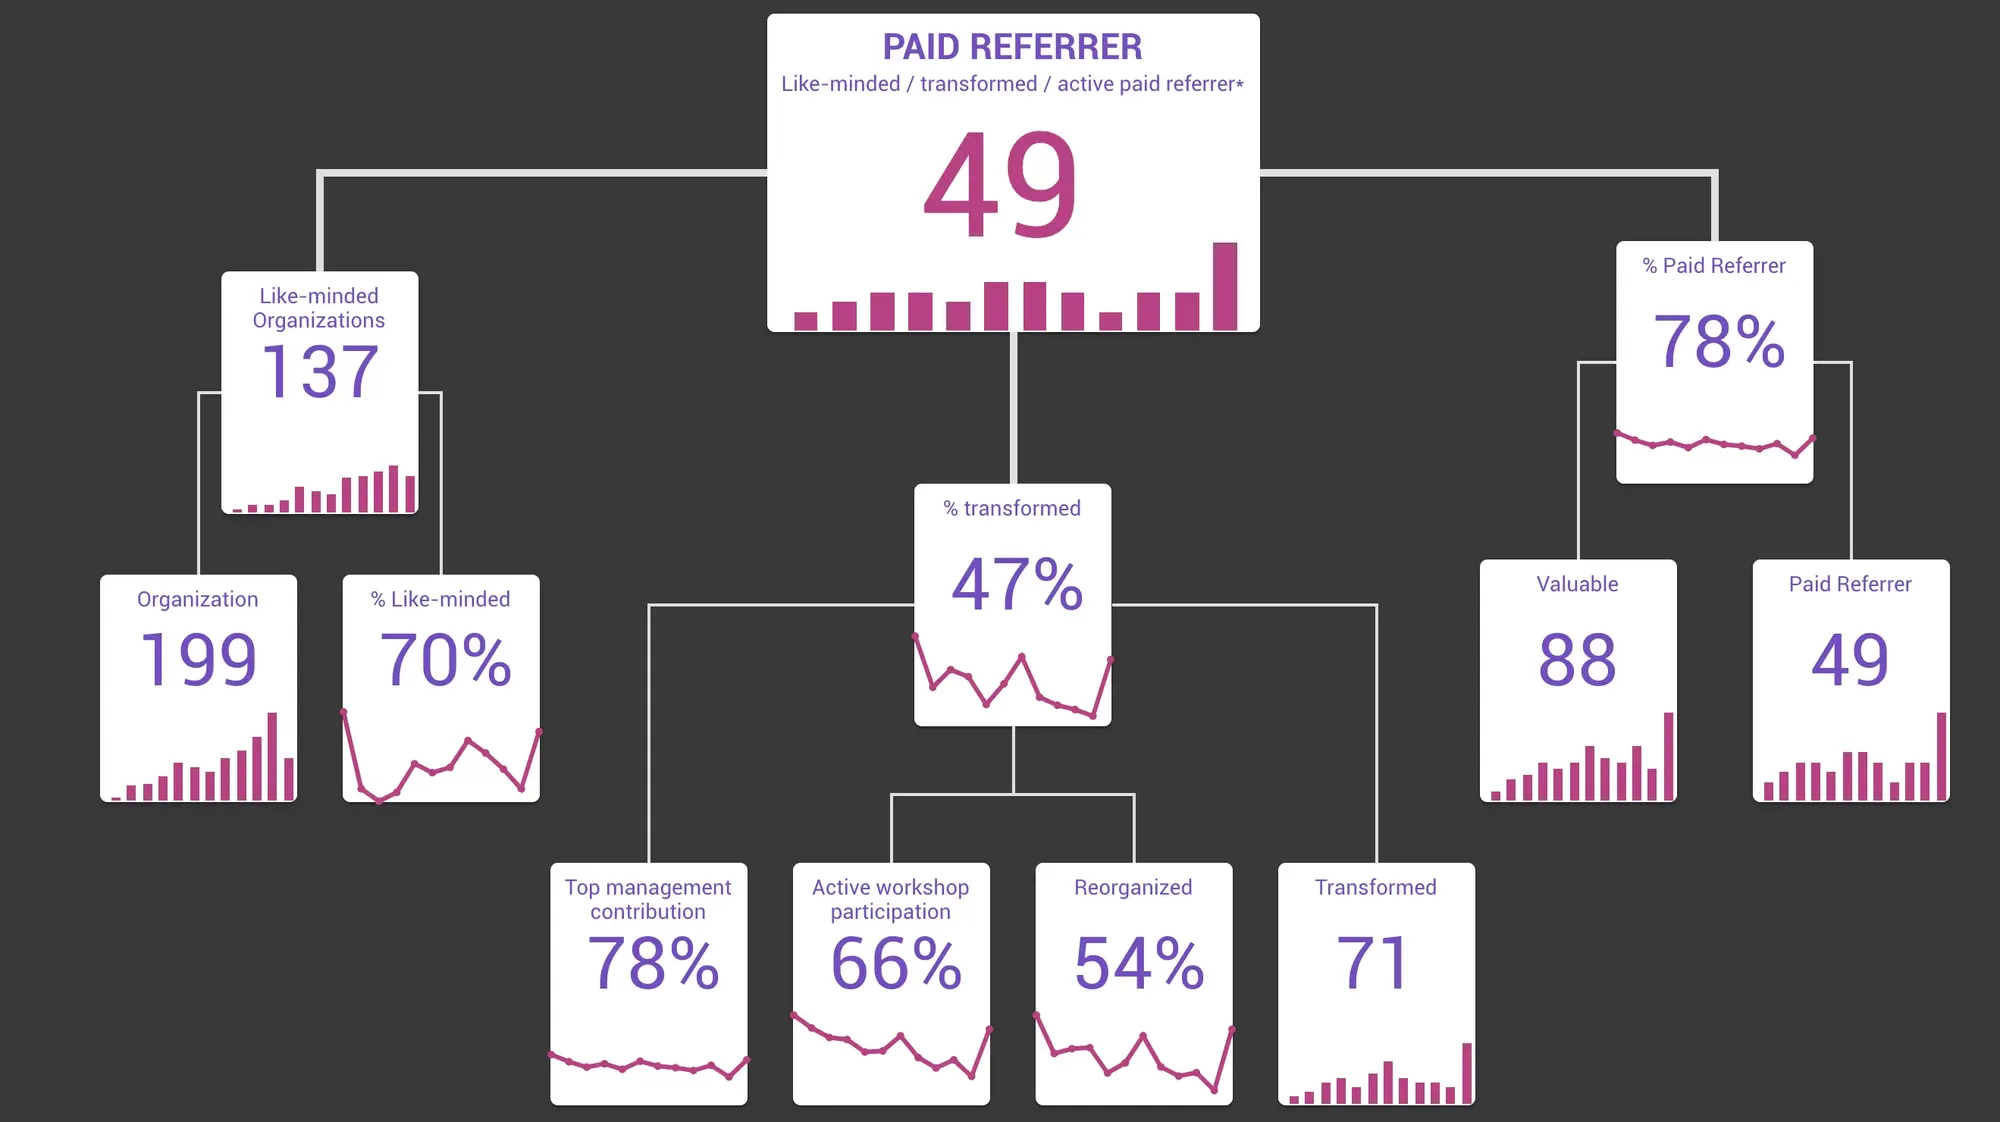
What is NorthStar Driver Tree?
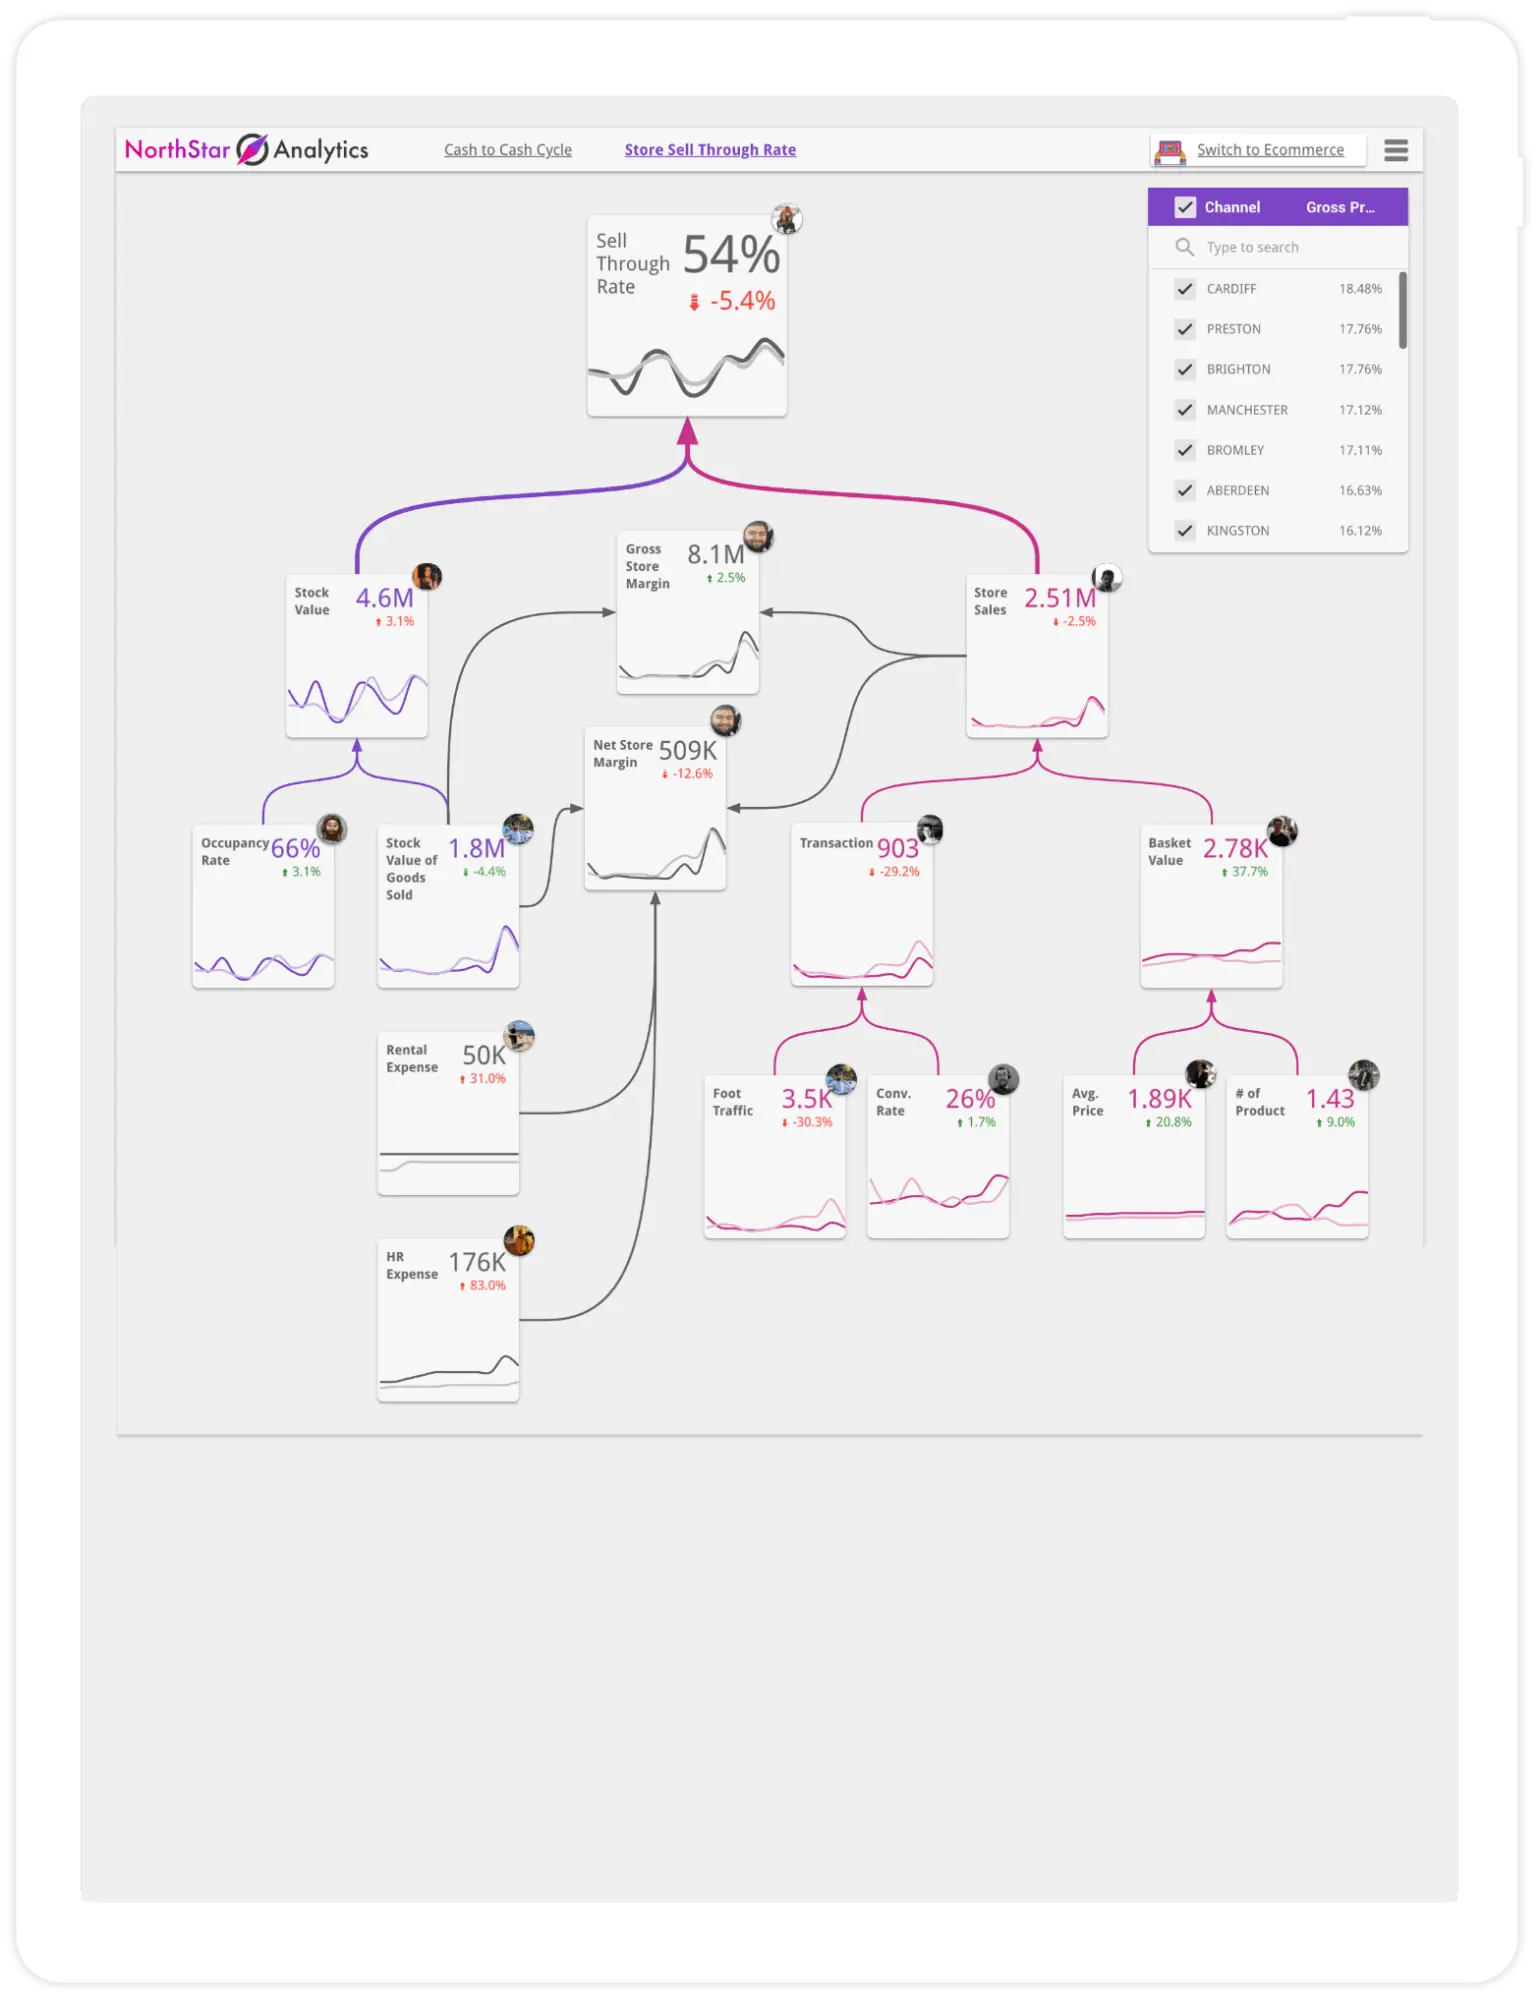
Let's put the pieces from the previous page together on this page. Below you see an example NorthStar Driver tree.

Checklist for NorthStar KPI
How do you know that the KPI you found is a good NorthStar metric? Although these items are mostly used for SAAS companies, e-commerce companies should reflect some of them.
It shows the value
The value is what the company produces for its customers. It must demonstrate the strength of the bond between the customer's problem and the firm's solution.
It shows the future
It should reflect the future version of the company's performance, not the past static values.
It reflects mission
NorthStar is a measurable version of the company's long-term goals and vision.
It is responsive
It should be directly influenced by the actions within the company rather than the general market trends.
It is simple and descriptive
It should be simple enough for everyone in the company to understand.
Discrete Perspectives
Have you ever felt that you cannot communicate smoothly after having a meeting with another team within the same company? In most e-commerce companies, employees speak 3 major different languages; merchandising, finance and user experience. We will bring together all perspectives and create a common language with this e-book.

Why do we need a NorthStar KPI?
You need colleagues on your side to achieve business transformation. Below are the 3 most important benefits.
Everyone works towards a value proposition

Everyone works towards a common goal

Everyone can understand the common language

Business Model Canvas
Business Model Canvas is strategic management and lean startup template for developing new or documenting existing business models. It was initially proposed in 2005 by Alexander Osterwalder.
I use this canvas to fully understand the companies. The difference between a good workshop and a perfect workshop is to understand the company in the best way, not just throw the KPIs to the canvas.

Team Assessment
The team is not just made up of people in the company. Reach the responsible people, collect purposes and current success metrics.
- Internal Teams: Marketing, e-commerce, purchasing, development etc.
- Outsources: Freelancers, partners, Upwork etc.
- Agencies: Digital marketing, design, content, data analytics, CRO etc.
- Tools: Ad tech, Analytics, personalization, project management etc.

Data Audit Checklist
Find out the data maturity level of the company, audit all the data sources and write it responsible down with this 9-item checklist.
- What data analytics tools do you use? (Google Analytics, Mixpanel, Woopra, Heap etc.)
- How do you extract the data from CRM? What data attributes are there? How long?
- What marketing platforms do you use? (Google/Facebook Ads, retargeting etc.)
- What are the most used reports and dashboards in the company? What are their goals?
- Which meetings are held regularly? What presentations are prepared for these meetings?
- Learn about the company's data maturity by speaking of current and the planned KPIs.
- Is there a data-trust problem in the company? Are there regular checks-ups? Who is responsible?
- How are tasks prioritized? Are there any data-driven prioritization method?
- If we were to manage the company with only 3 metrics, what would these metrics be?
Planning the Workshop

Manage the expectation
One of the best ways to manage expectations is to make sure you communicate with all stakeholders on a frequent basis. You may start to even over-communicate in the preparation phase of workshop. You have to be comfortable that the expectations are realistic and achievable.

Who sould attend?
Those who are not on the management board and have influence on the teams should participate. People in different teams and management styles will strengthen the outcome. Everyone who comes should know the company mission.

Session planning
The number of sessions varies according to the number of teams participating. One value drivers session for each team, plus a NorthStar KPI session for the managers. Each session should last between 1-3 hours and the agenda should be clear.
Run a successful workshop
For successful workshop, you need 3 things; clear agenda, right people and clear minds.

Describe the methodology
Simply answer the questions below:
- What is the NorthStar Driver Workshop?
- Why are you running this workshop?
- Why did you invite each one?
- What will be the potantial outcomes?

Perform an example workshop
If you make a mini dummy workshop for 15 minutes before the real workshop, everyone will understand the process and the rules more clearly. Check out northstaranalytics.co.uk to more KPI examples.

Share your research
You have researched the company's data sources, responsible people, meetings, reports, dashboards, presentations and future plans related to data and KPIs. Share what you know.
SESSION 1: Value Drivers
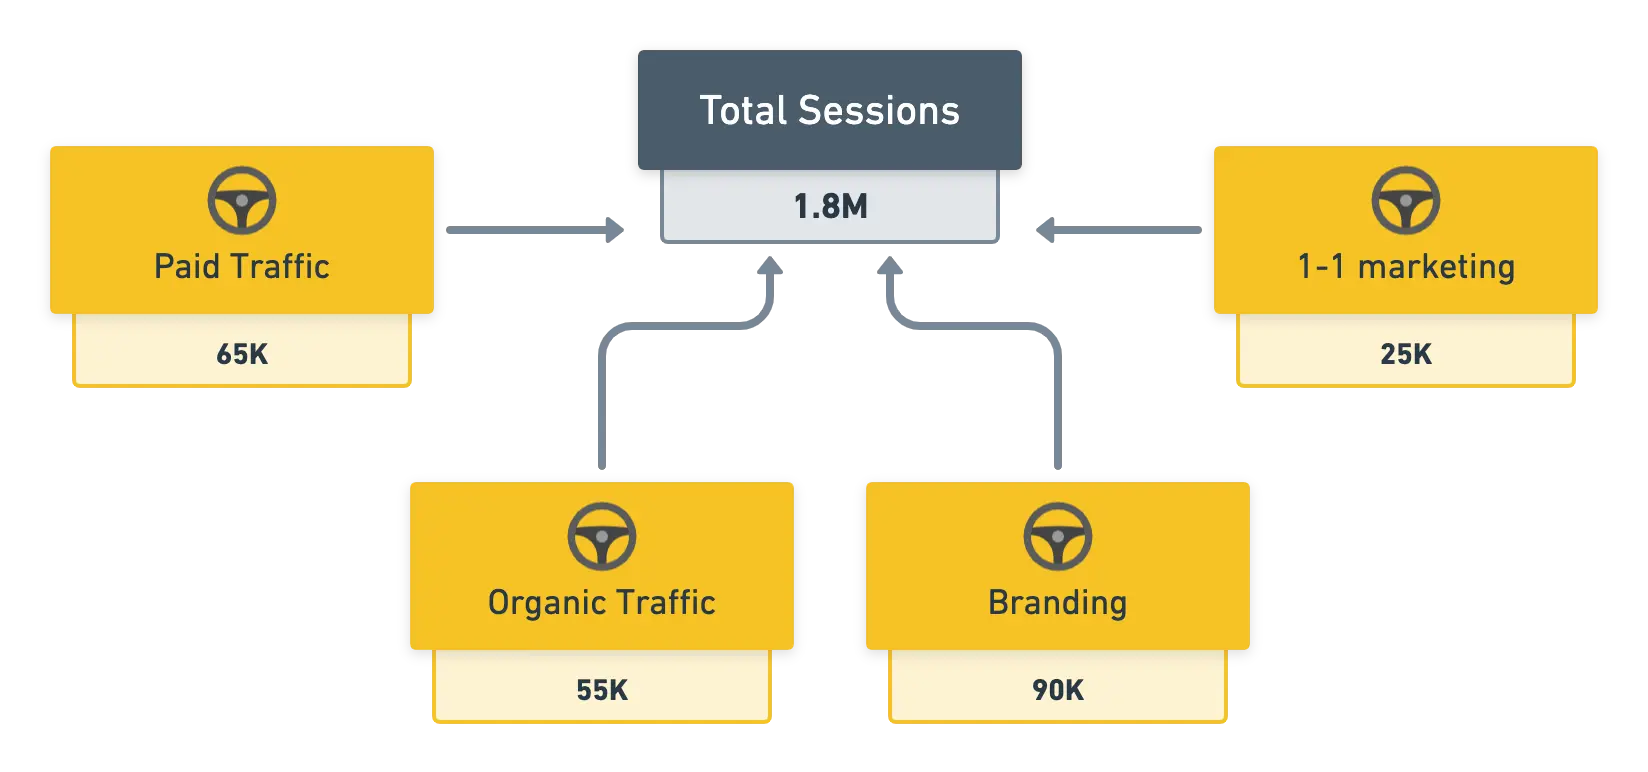
The value driver workshop should be run for each team. Drill down the 4 examples below. Examples are for the e-commerce businesses.
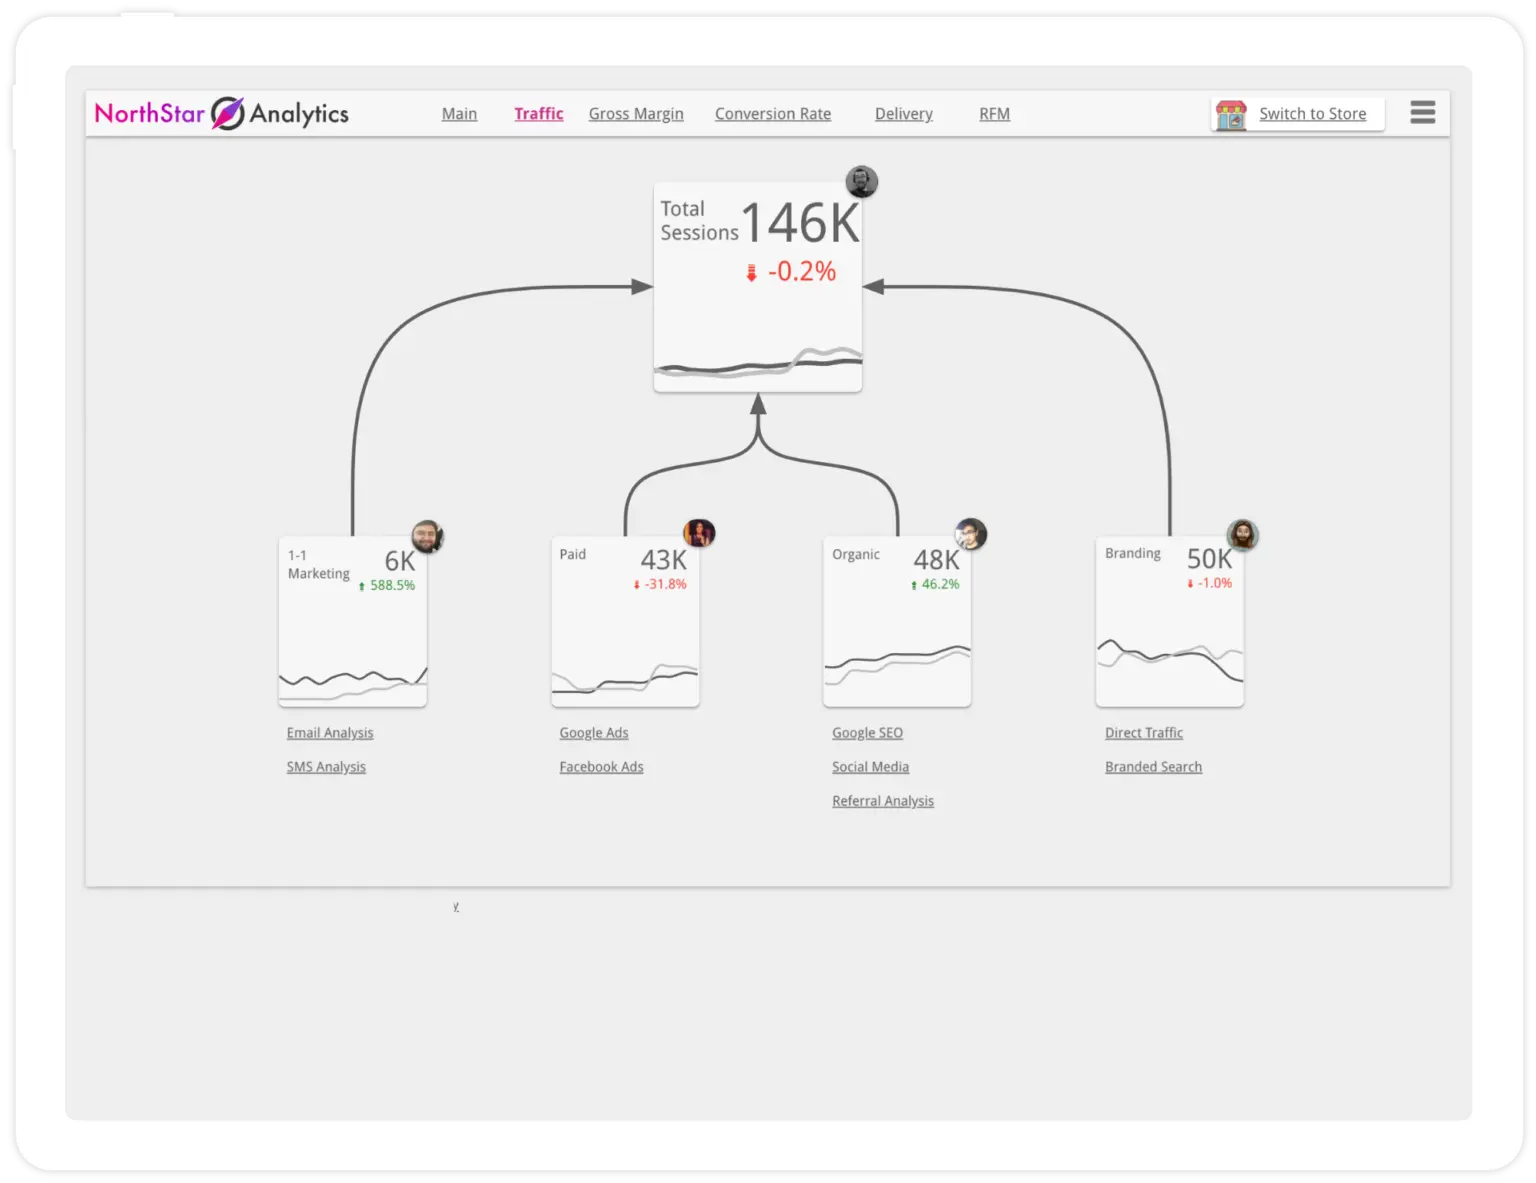
Analyse the acquisition channels
Main driver: Total Sessions
Objective: Increase traffic
Participants:
- SEO agency
- Marketing team
- Branding team
- Contractor CRM analysts
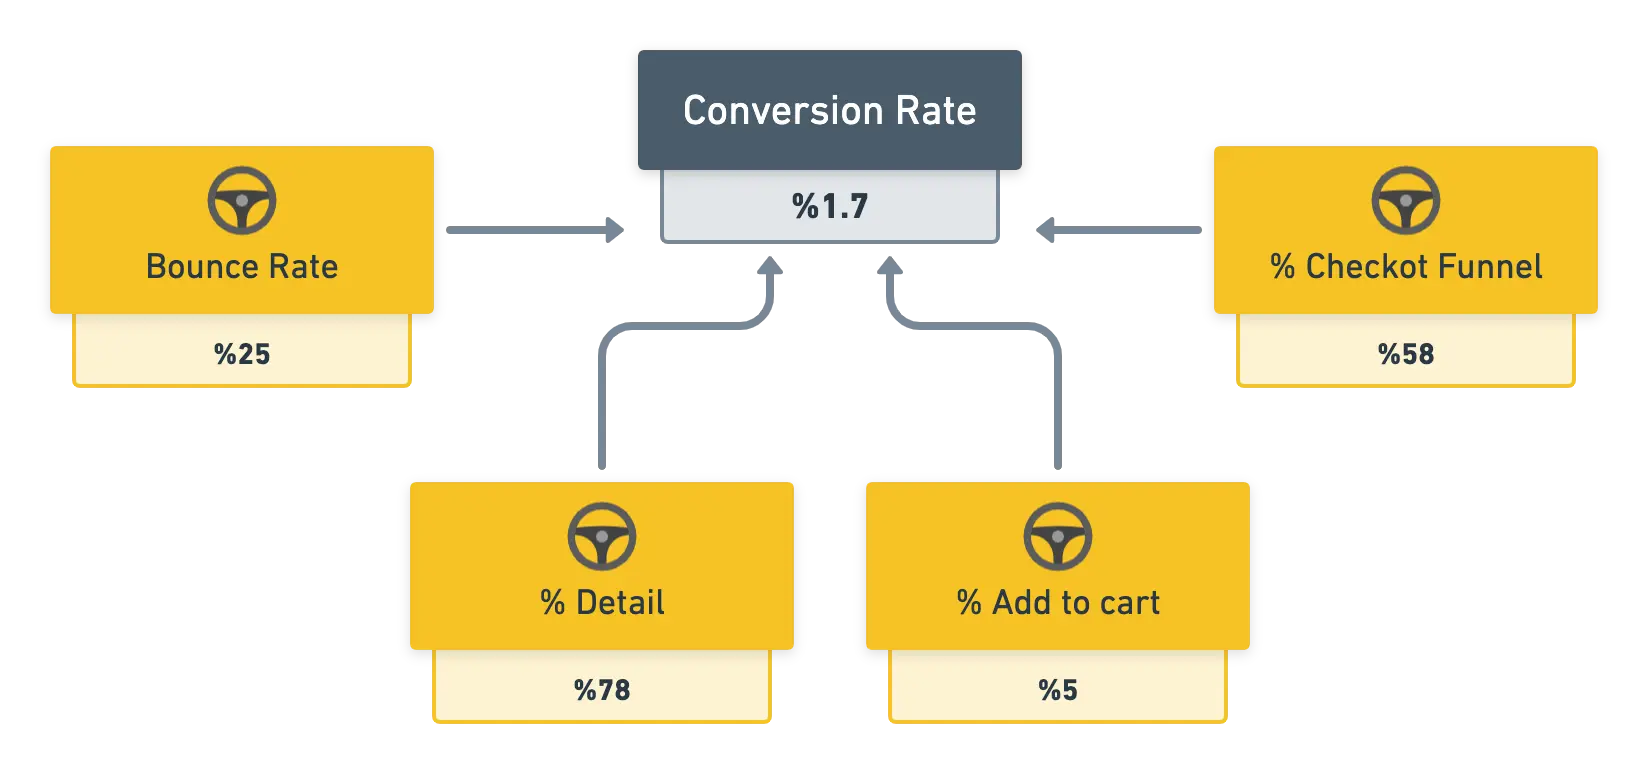
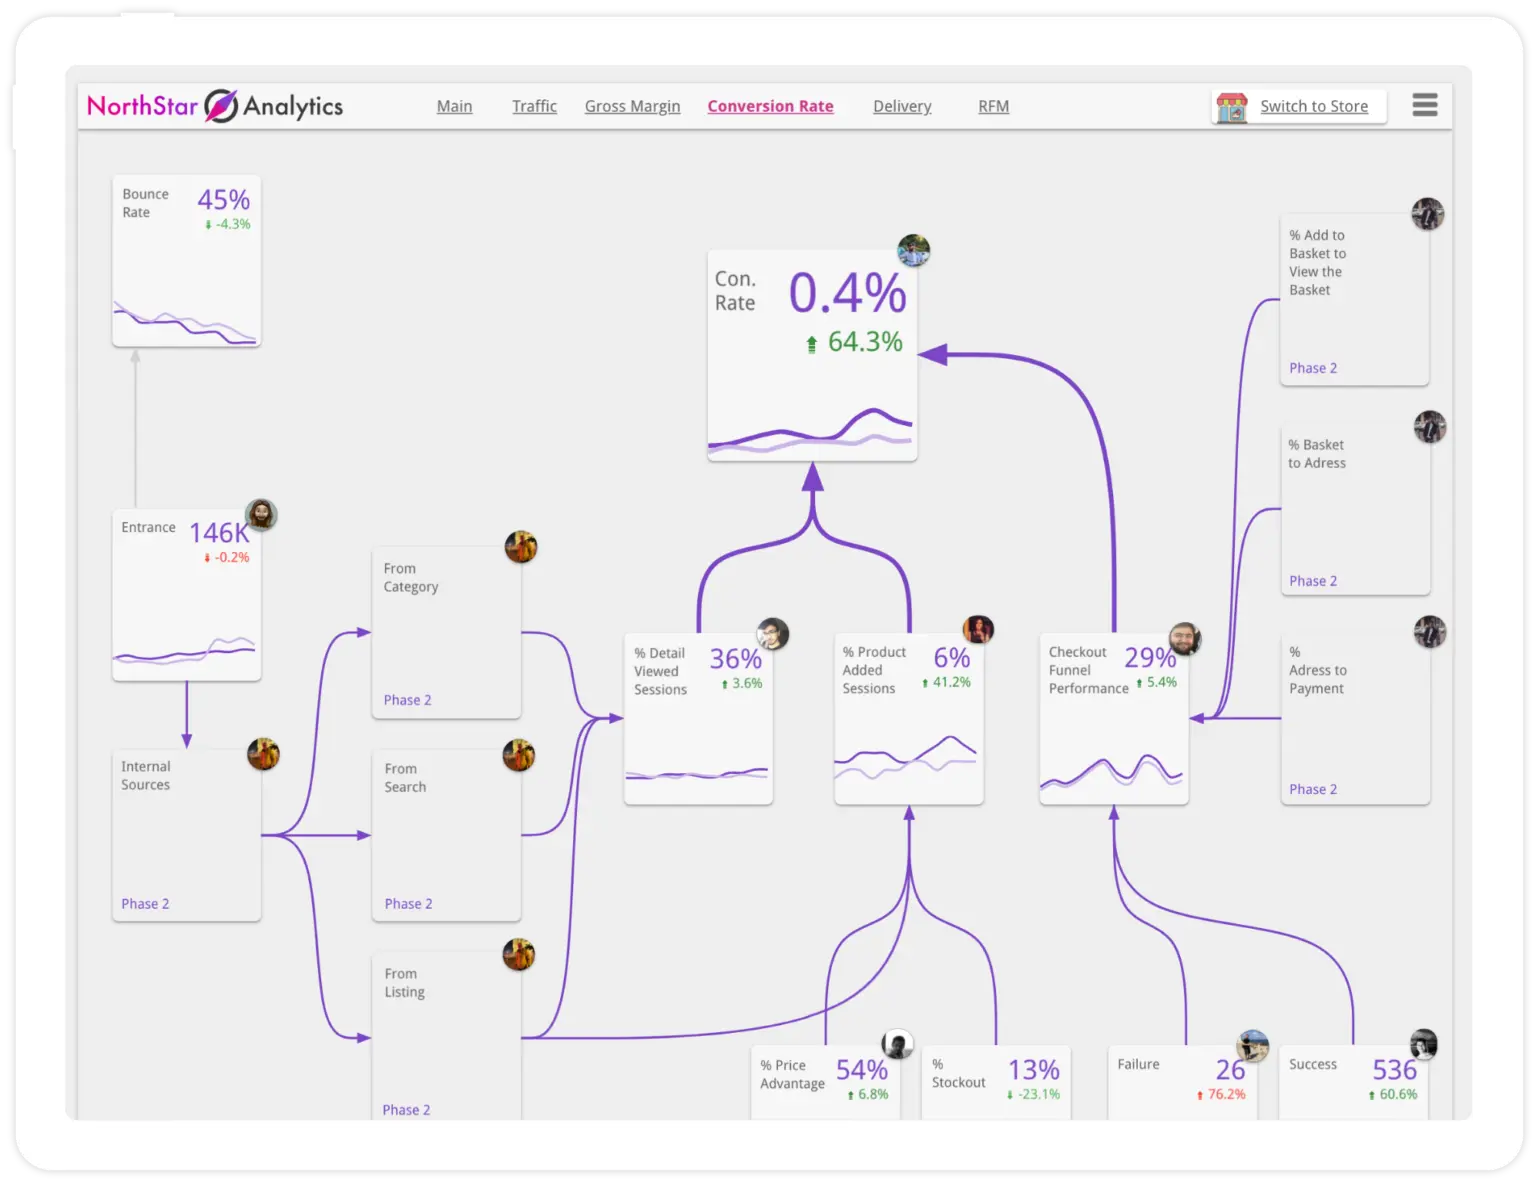
Map the whole conversion funnel
Main driver: Conversion rate
Objective: Conversion rate optimization
Participants:
- CRO agency
- Product management
- Design team
- Development
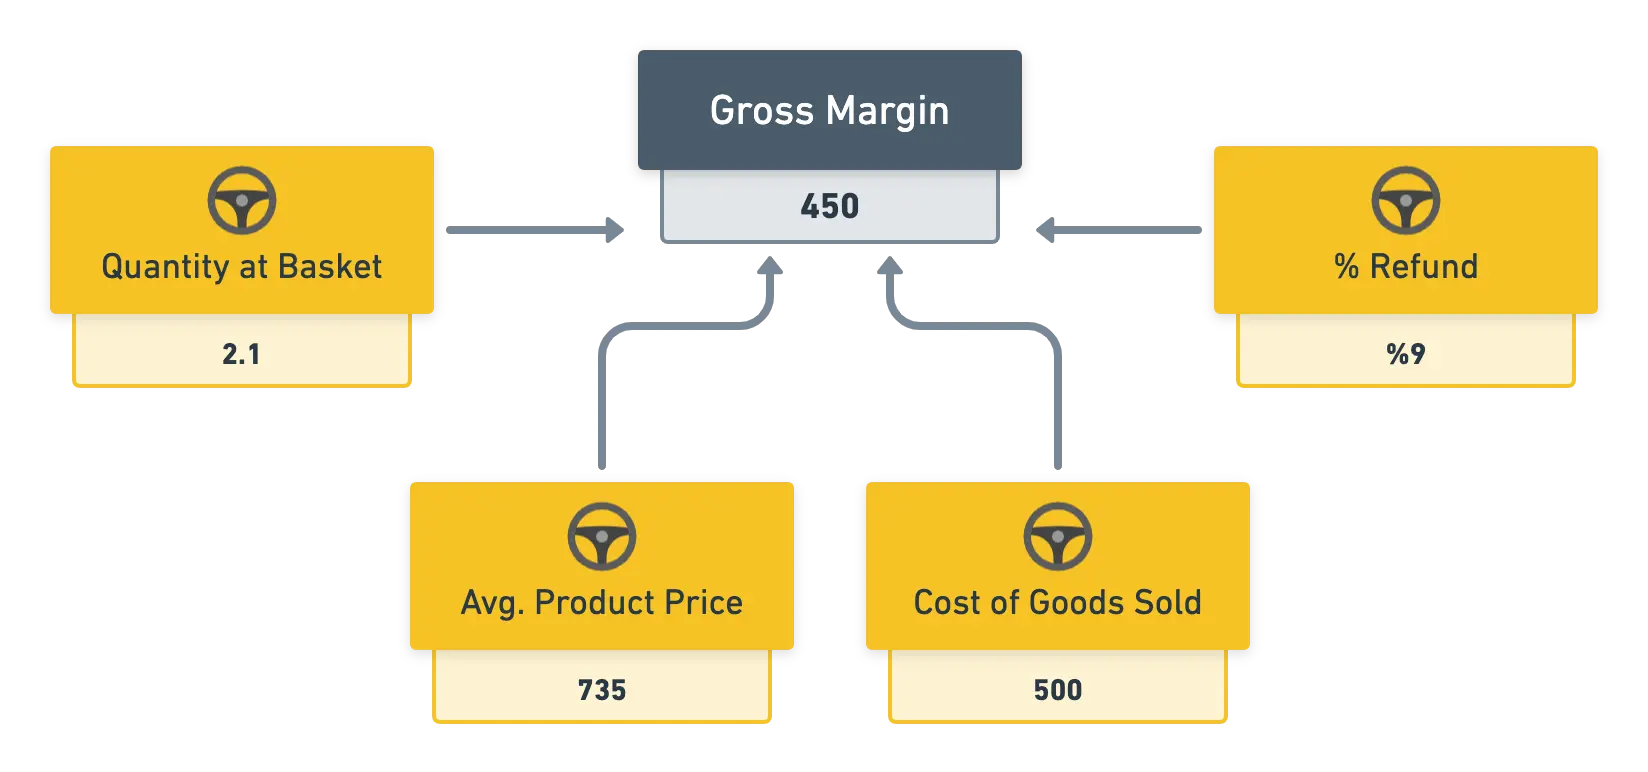
Focus on the merchandising
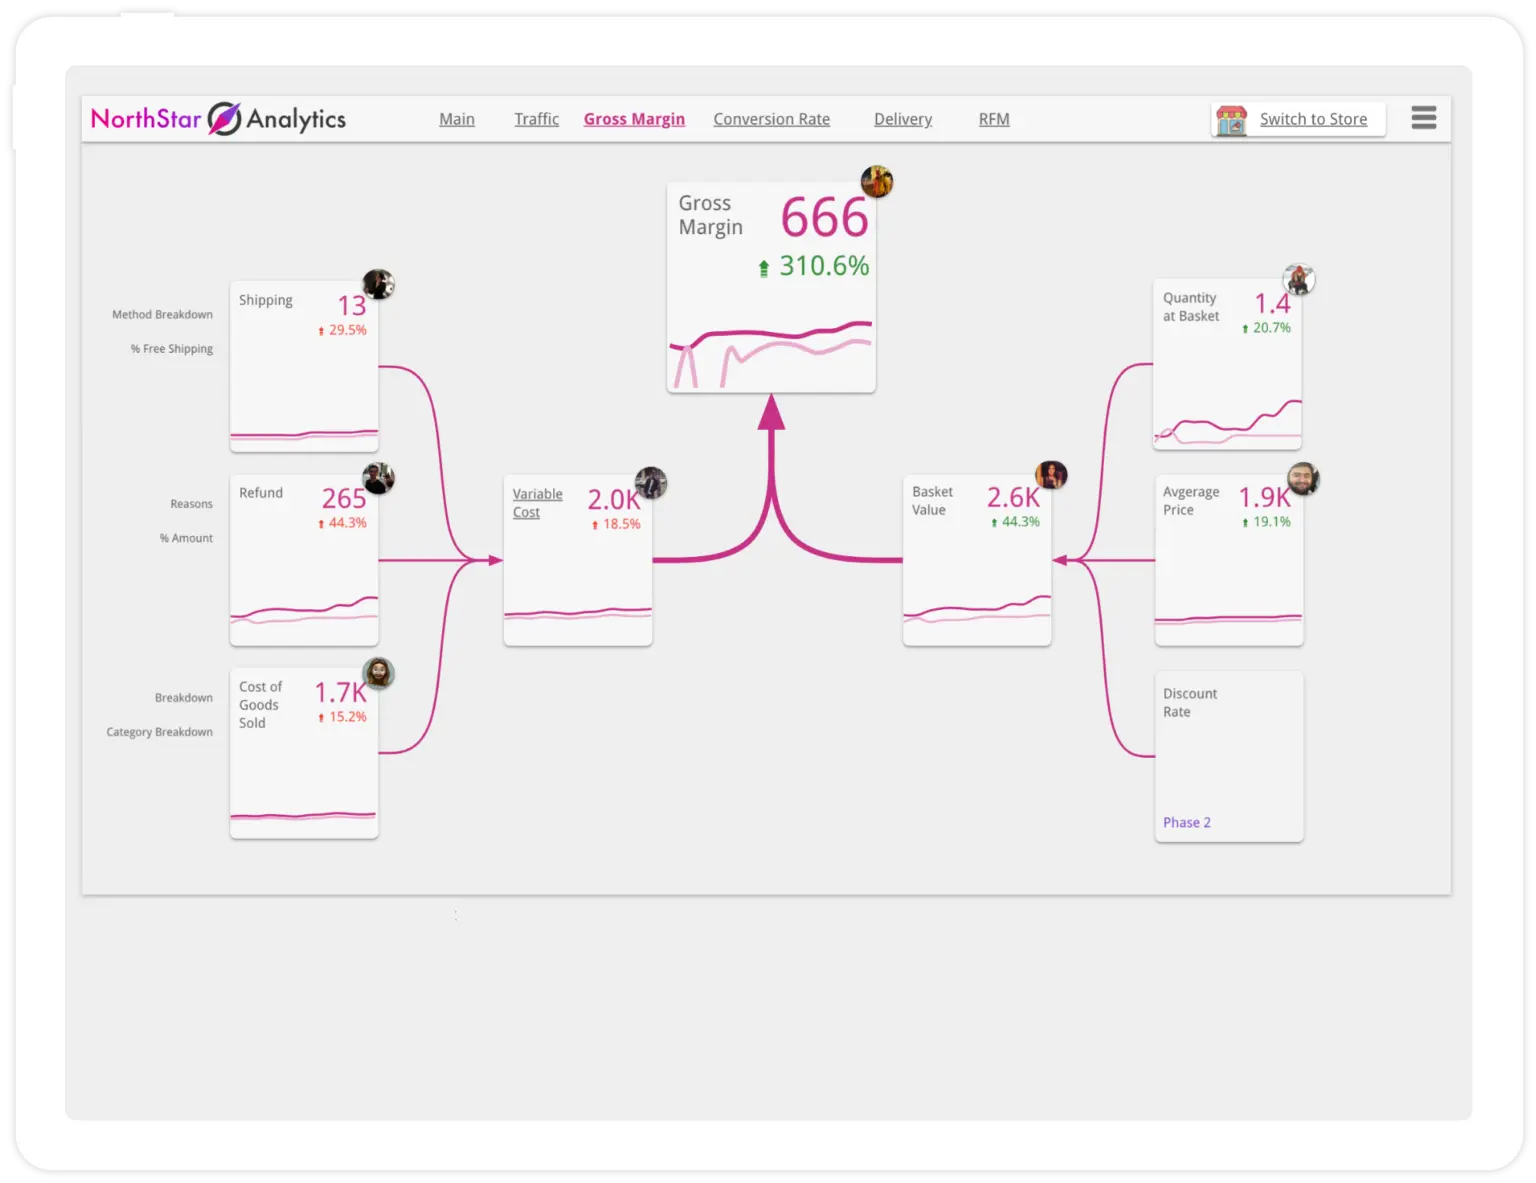
Main driver: Gross margin
Objective: Increase basket value, Reduce variable costs
Participants:
- CRO agency
- Category management
- Up/cross-sell teams
- Product manager
SESSION 2: NorthStar Metric
You run all the workshops with the teams. It's time to join the outputs. One person from each team is enough for this session.
Connect the main drivers
Team leaders should bring their main drivers/KPIs to the table and create a higher level main driver together. You will reach gross profit by multiplying traffic, conversion rate and gross margin.
How to measure satisfaction?
We have created trees from a business and financial perspective so far. It's time to add a top-level driver by looking through the customer's eyes. You can choose any of the accepted drivers such as NPS (net promoter score) or CSAT (customer satisfaction score).
Reach your NorthStar
When you form the right NorthStar KPI, everyone at the meeting should be relieved. This KPI will drive your company towards better, satisfying and profitable way. Your company will be more agile and all the teams will collaborate more effectively.
SESSION 3: Simlification
All teams brought the all KPIs to their table. Now is the time to highlight the most important ones for the company. The chart below shows how to prioritize KPIs in the most basic way:
Accessible: Is this KPI currently measured? Or can it be easily?
Important: Is this KPI directly effective in any decision making mechanism in the company?

Keep it: Take it to the dashboard If it is important and accessible.
Vanity metrics: This is most likely an easily measurable but insignificant metric. You will have complicated dashboards, distracted attention and ineffective management.
To the roadmap: The absence of these metrics is strange sounds coming from the car engine. By adding these metrics, you can run the engine at full capacity.
Leave it behind: It is neither important nor measured. Just ignore it.
Link to the real business
Your company is big, complex, fluid and virtual. Now, you started to understand this structure with these workshops. There are 2 methods to link the workshop outcomes with your business.
Generate new ideas
Check out the NorthStar metric and KPI tree you just created and generate new projects from scratch. Do not limit yourself to budget and time. Sort the ideas, starting with the useful one. These ideas will improve your horizons and force you to look through the larger lens.
Link to current tasks
We will not come up with any new ideas in this study. Create a large task list from your e-commerce business backlog and prioritize according to the NorthStar metric and KPI tree. Compare the new prioritization with the current one. It will light a bulb above your head.

KPI Glossary
Your company now has a KPI list. Make this list accessible to all members with this glossary for the democratic decision making.
KPI Name / Description
The name and clear explanation of the metric should make it easy for people to remember the KPI.
KPI Value
KPI's calculation method, formula and data source can be found in this section. The minimum and maximum values of the KPI will help us identify future anomalies.
Responsible
Who is responsible for measuring, data accuracy, setting and achieving the objectives for the KPI?
Running Cost
The costs for the integration, maintenance and update frequency of this metric should be placed in this section.
Actions
What actions should be taken when the KPI increases or decreases?
Ready for the OKR?
OKR methodology connect company, team, and your personal goals to measurable results while having all your team members and managers work together towards unified direction.
Objectives
Objectives are memorable qualitative descriptions of what you want to achieve. Objectives should be short, inspirational and engaging. An Objective should motivate and challenge the team.
- Improve customer satisfaction
- Increasing profitability
- Increase recurring revenues
- Improve employee engagement
Key results
Key Results are a set of metrics that measure your progress towards the Objective. For each Objective, you should have a set of 2 to 5 Key Results. More than that and no one will remember them.
- Conduct 50 phone interviews
- Increase margin to 54%
- Increase annual renewals to 75%
- Employee score of at least 4.7 points

Dashboard Examples
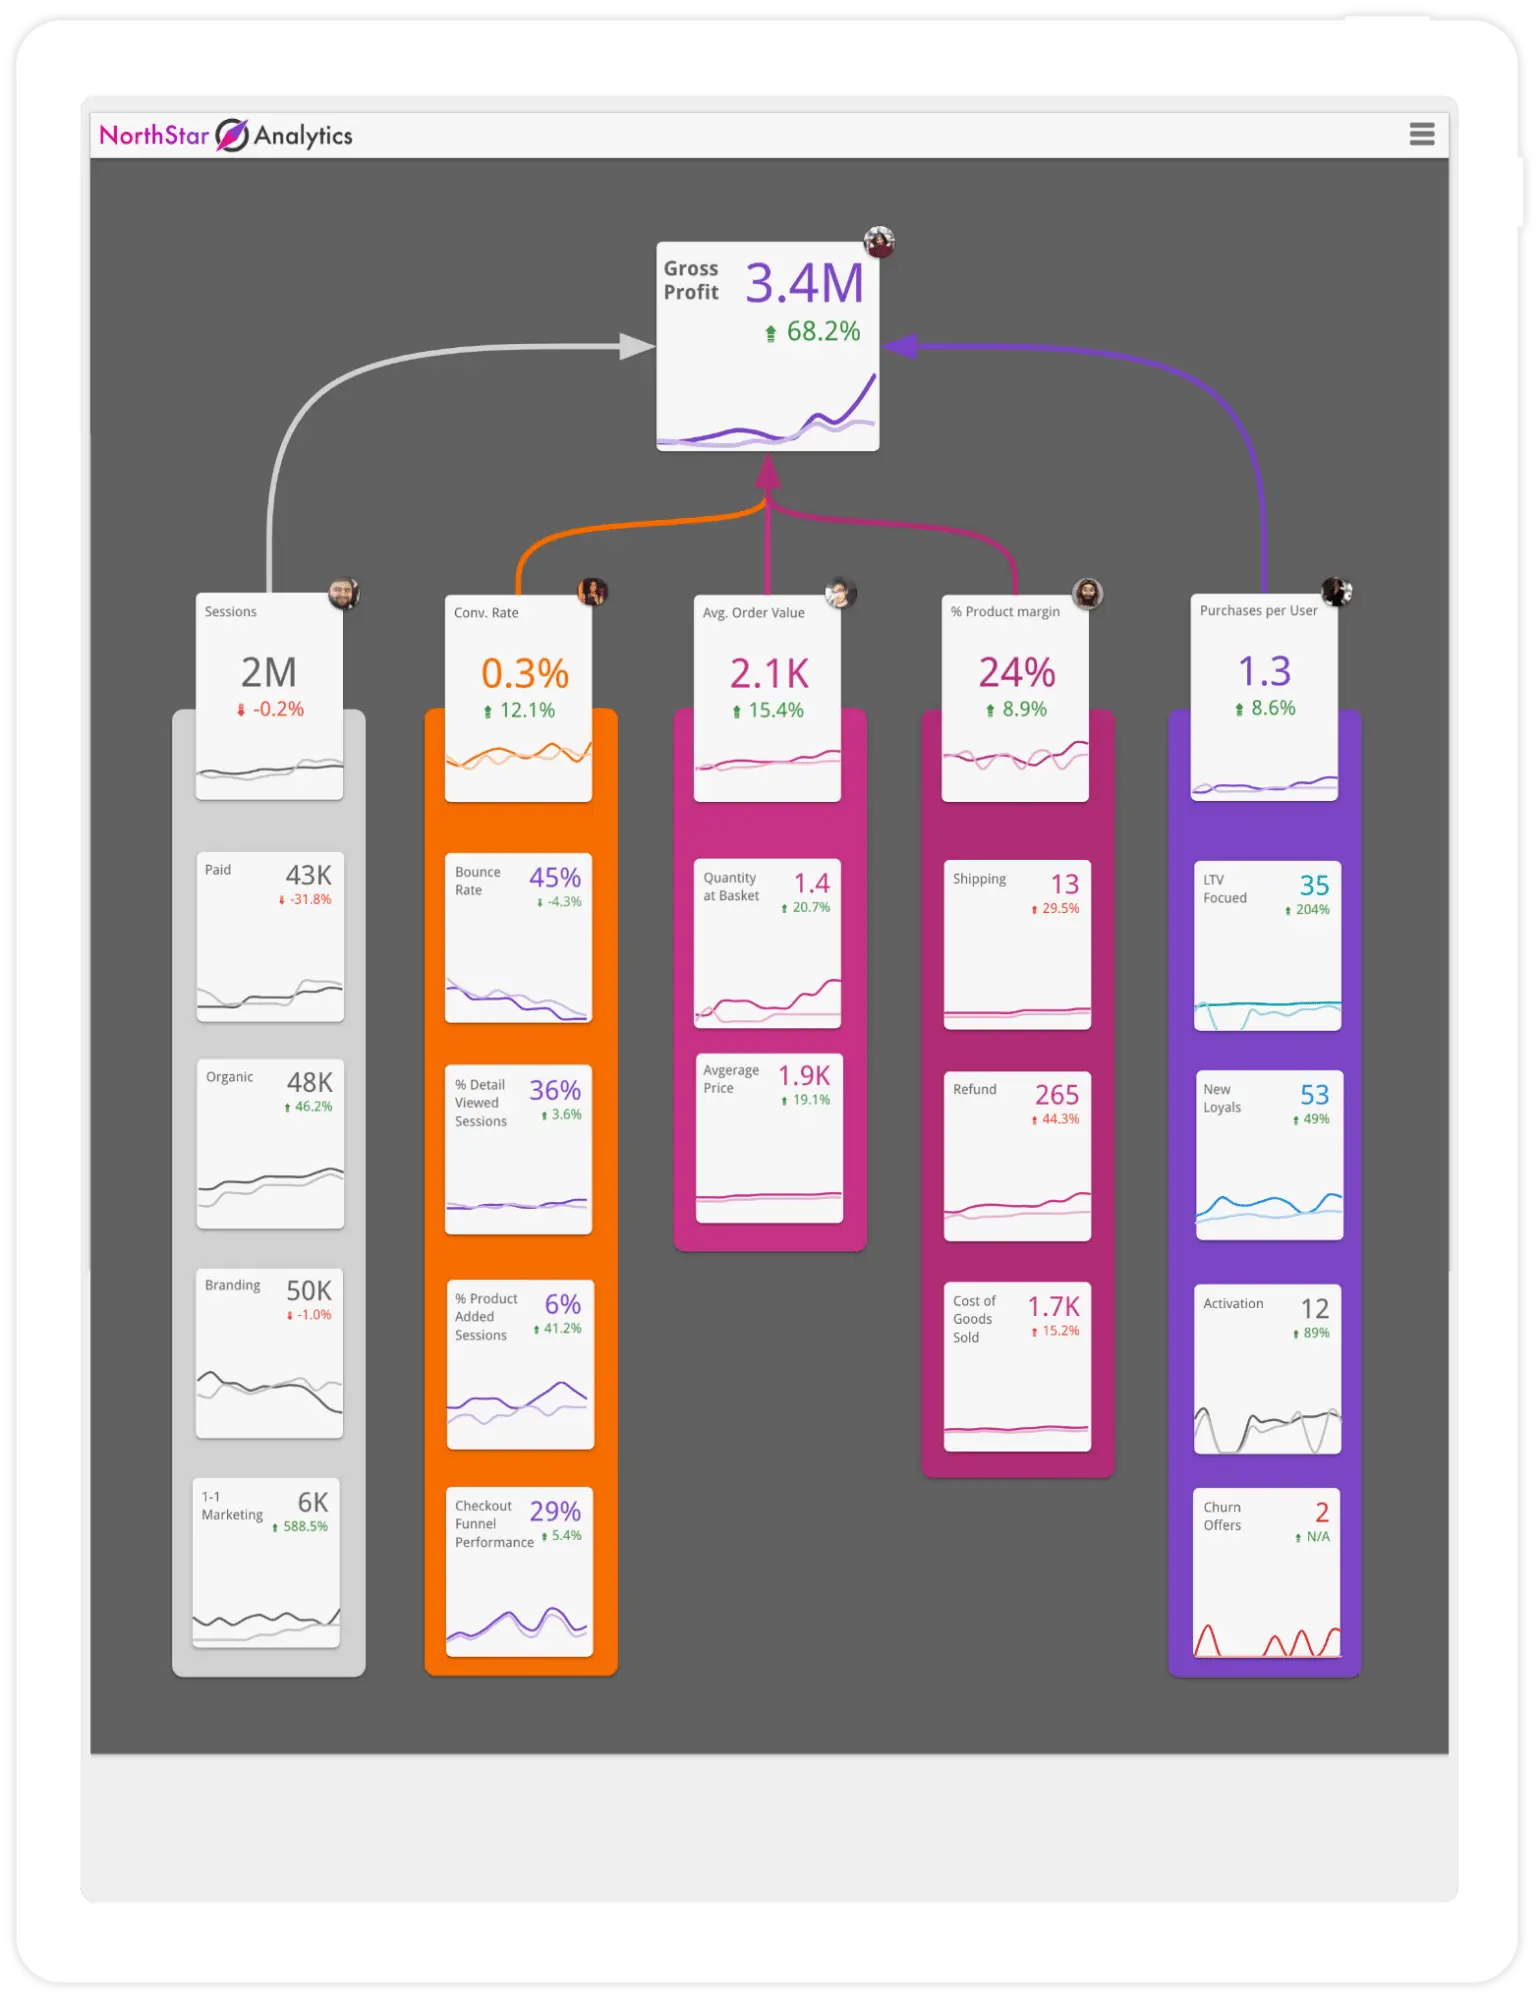
Executive Dashboard
E-commerce Dashboards
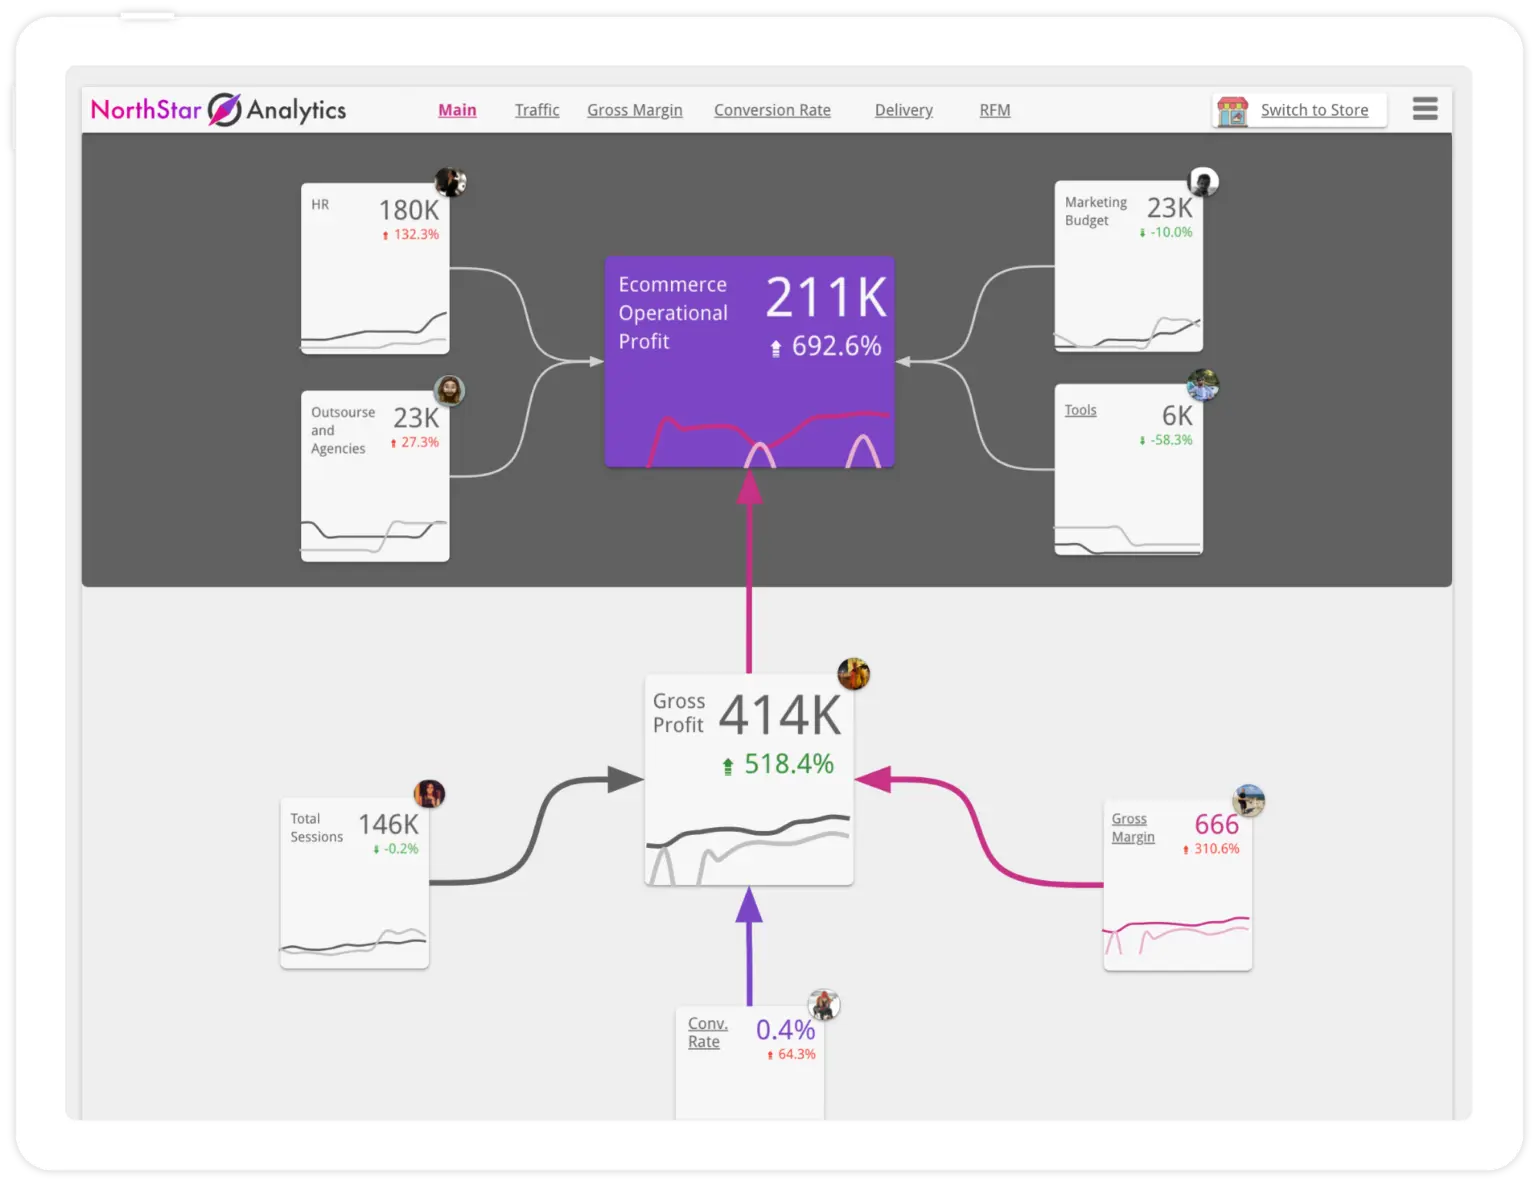
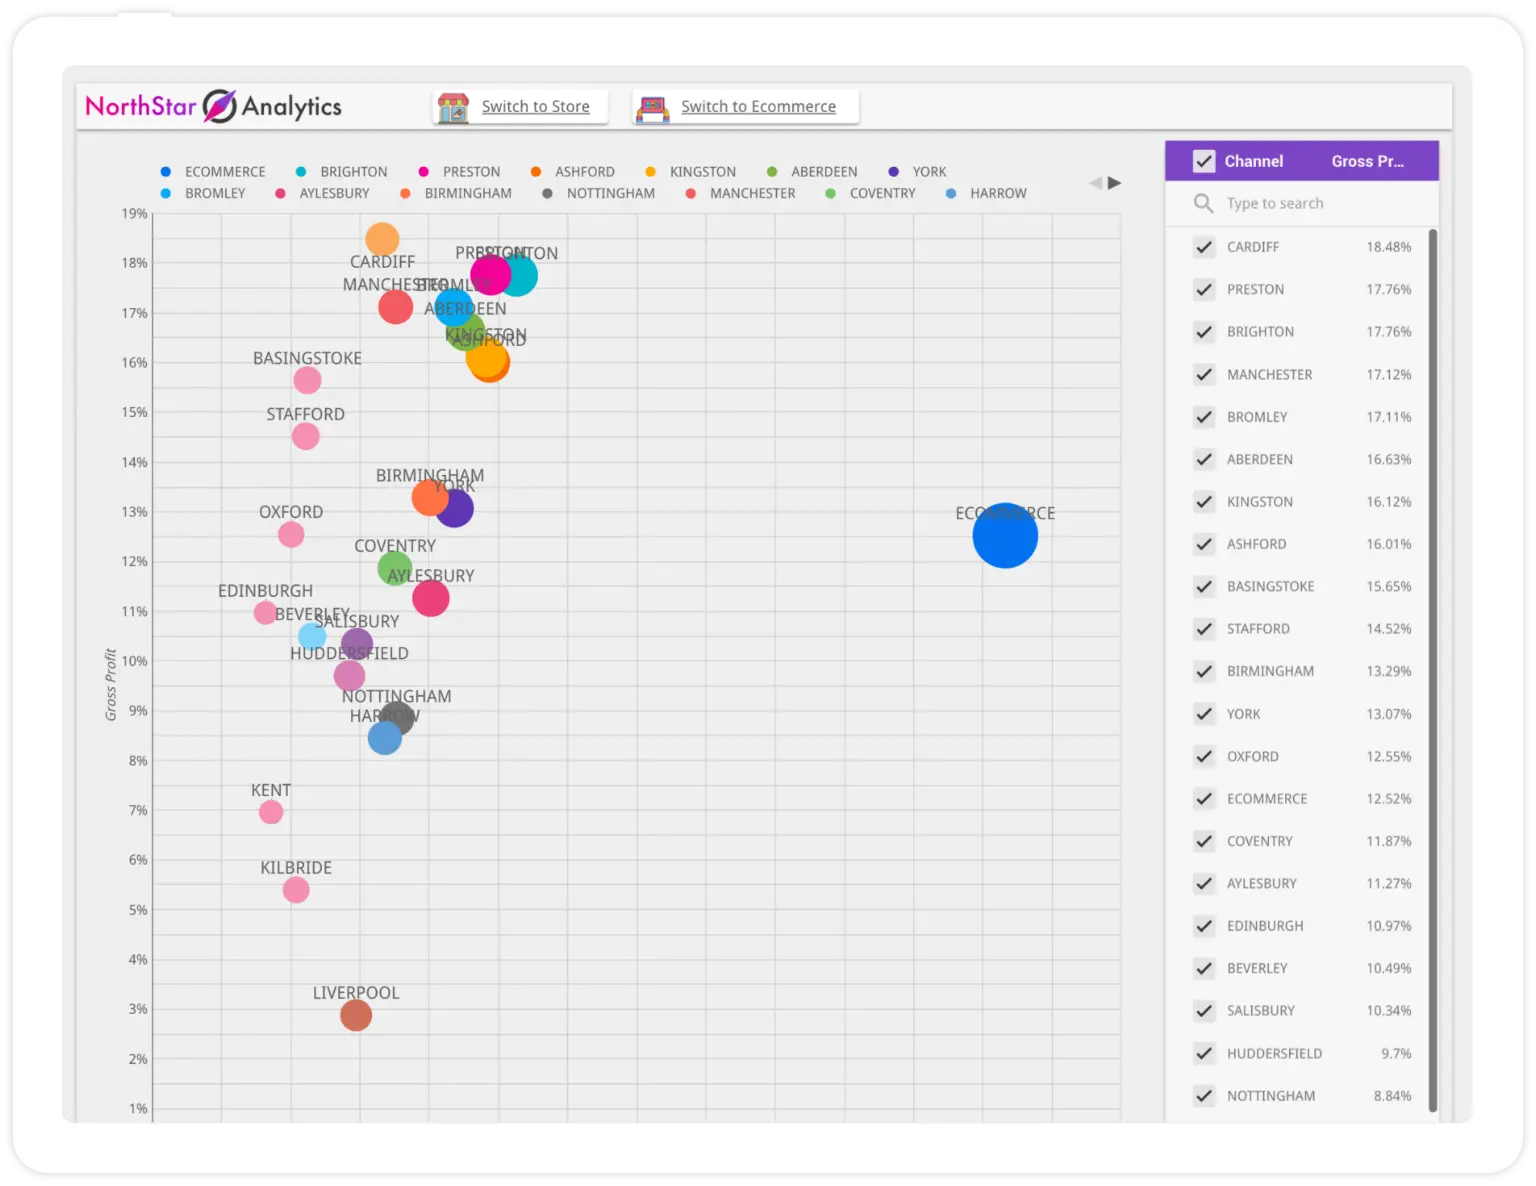
E-commerce Gross & Net Profit
Acquisition Channels
Gross Margin
Conversion Rate
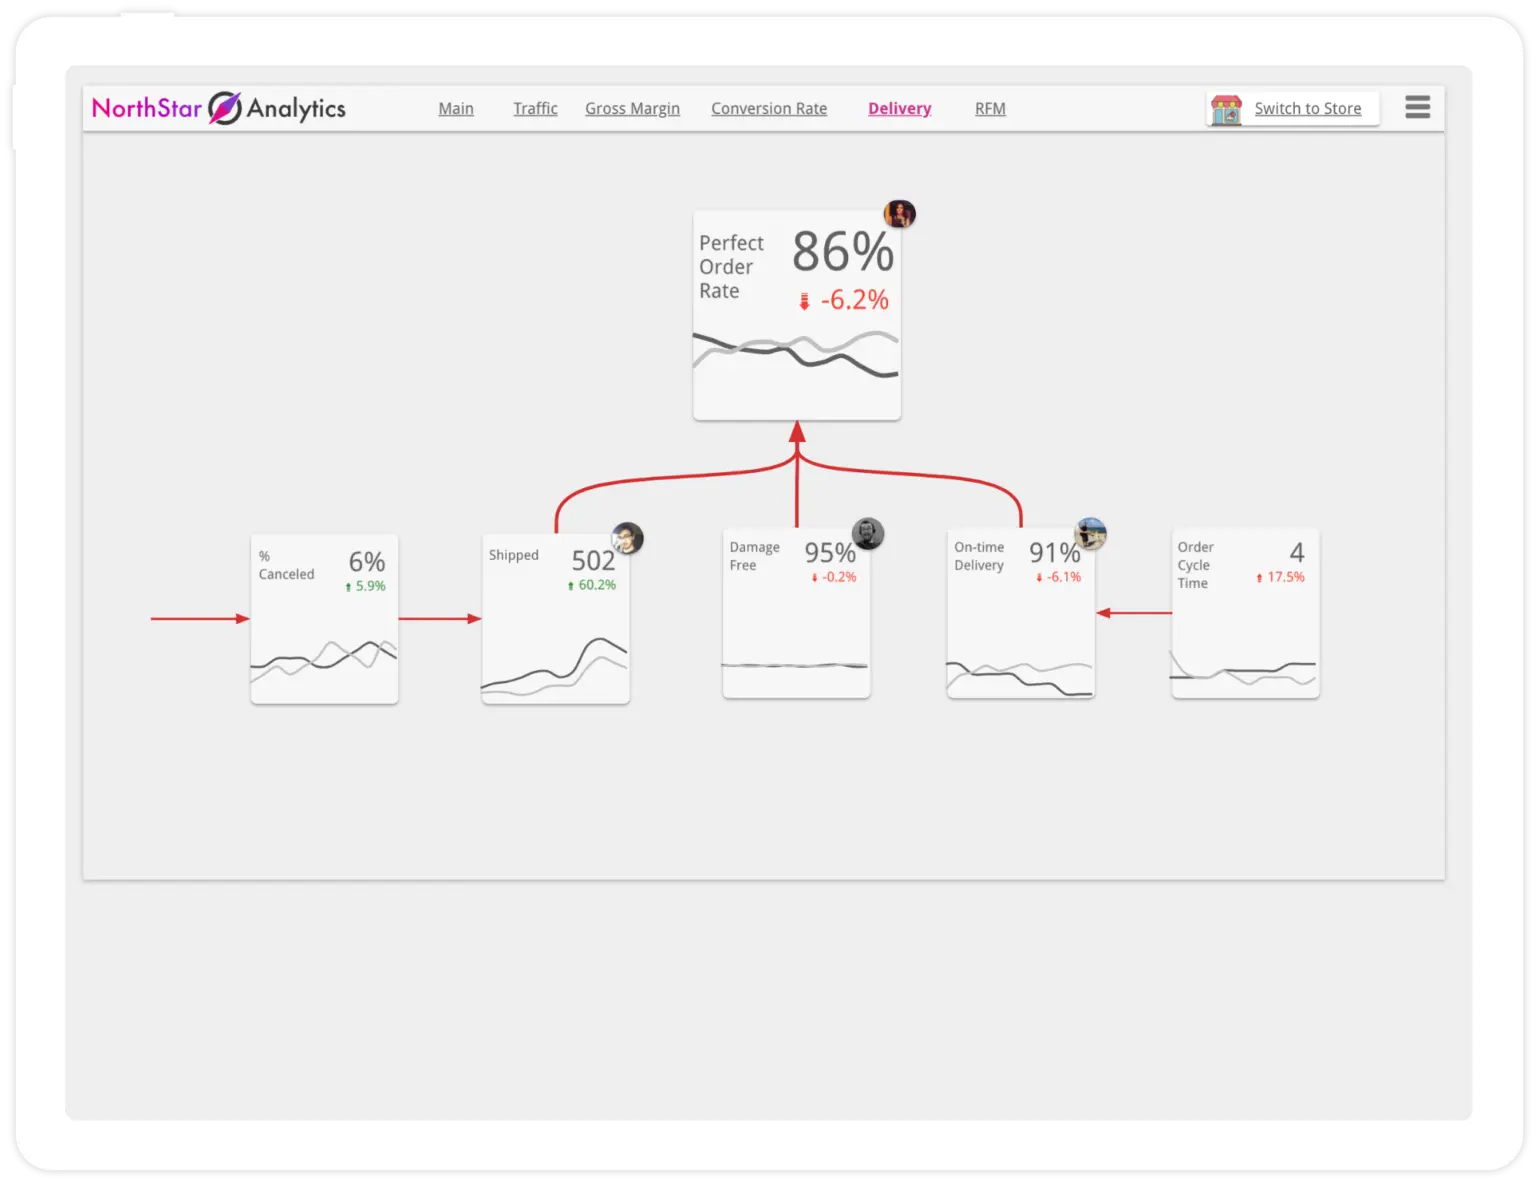
Delivery
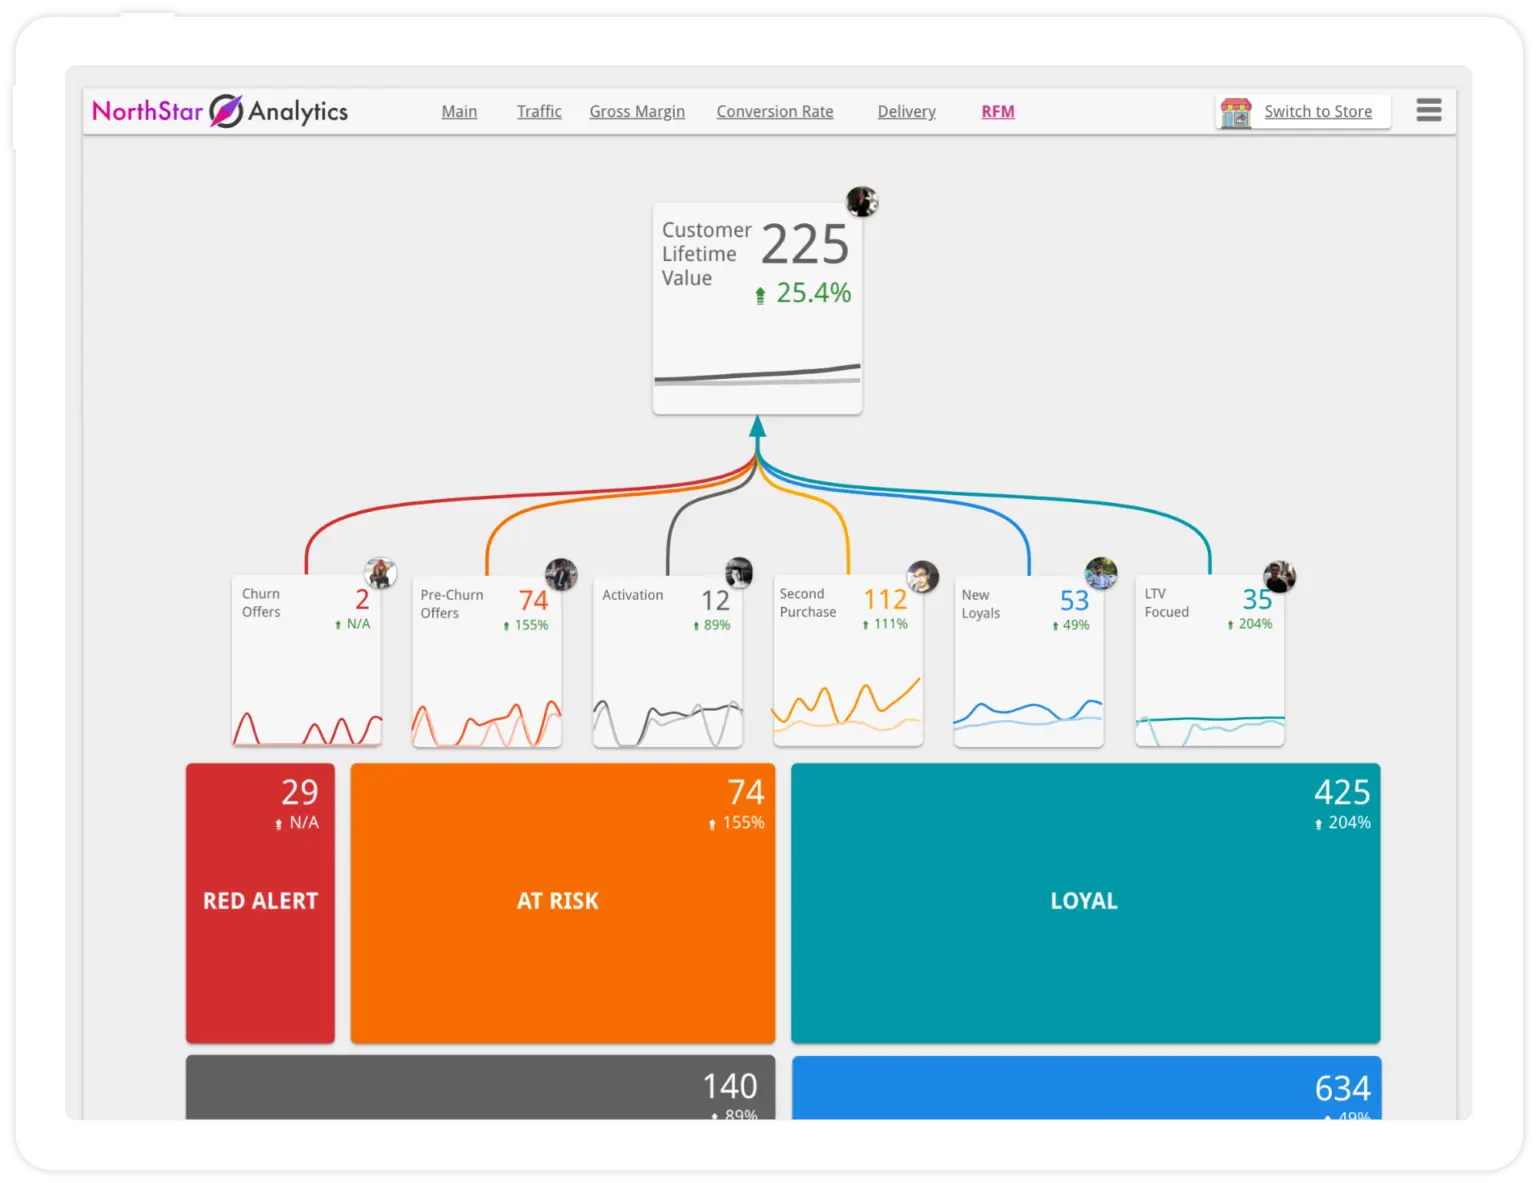
RFM Analysis
Omnichannel Dashboards
Store Overview
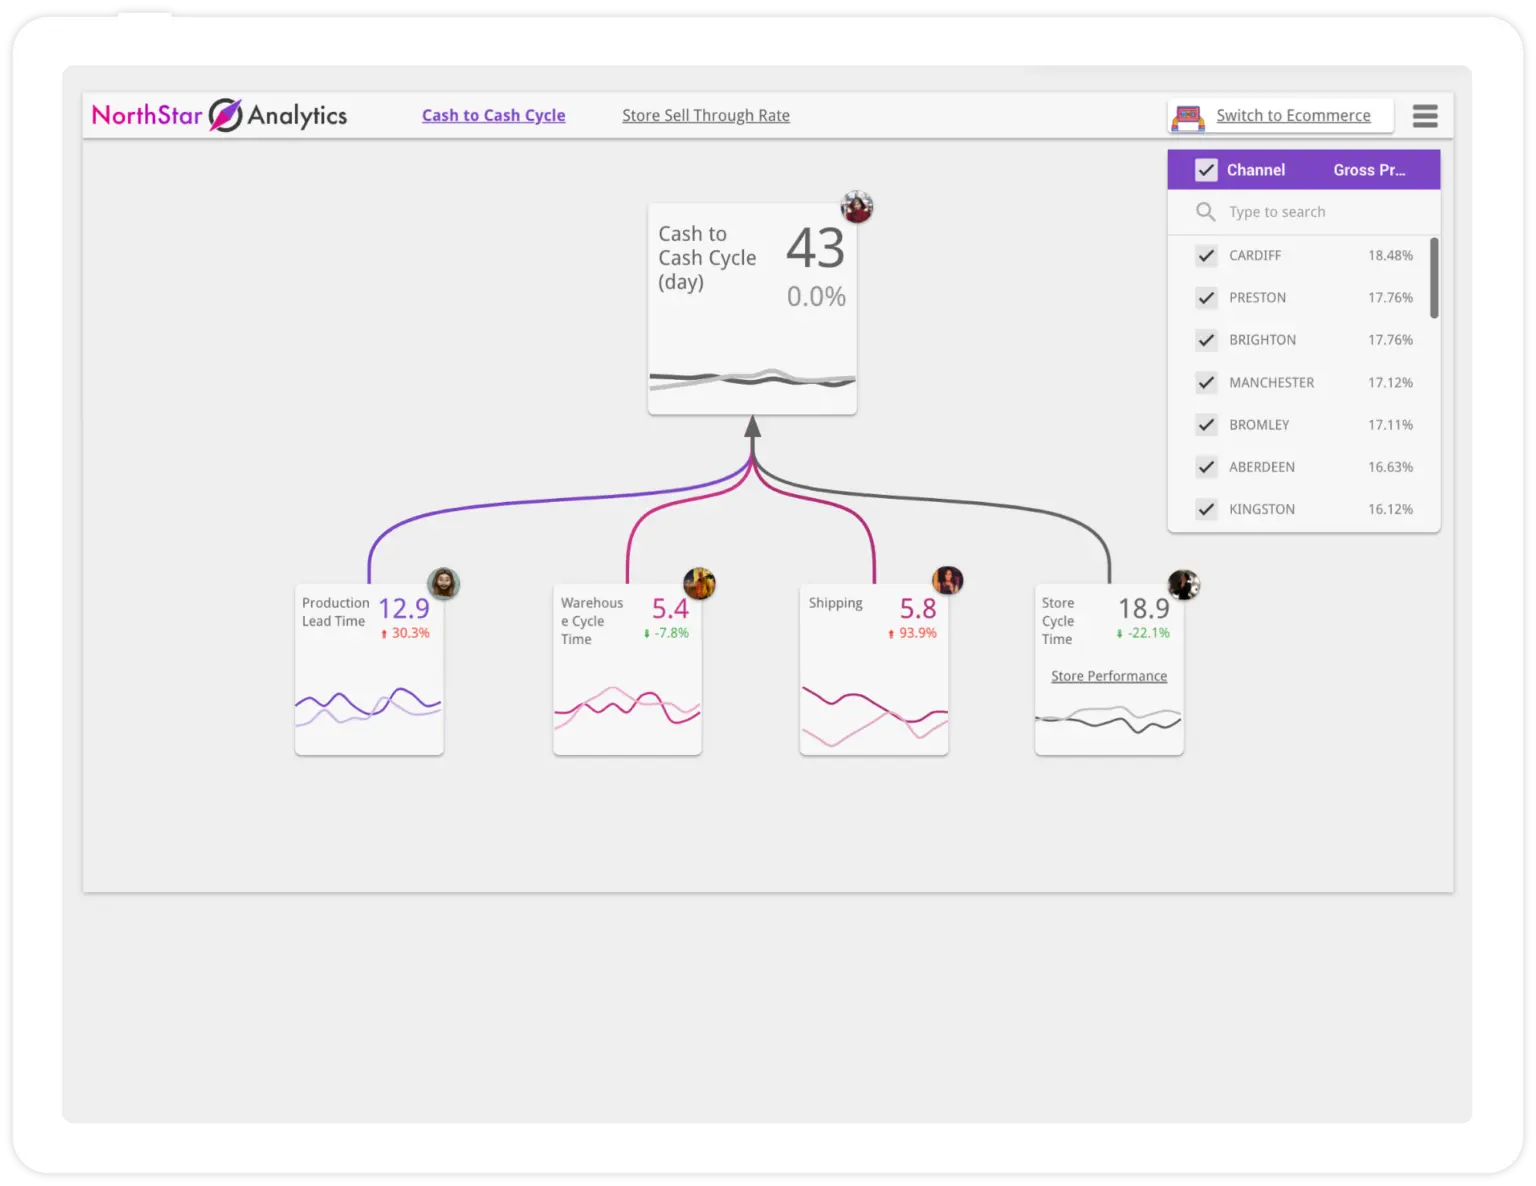
Cash to Cash Cycle
Store Analytics
