How to conditional formatting in Power BI?
One of the formatting kinds is conditional formatting. Any fields you provide in the Values box of the Visualizations pane of PowerBI can conditional formatting applied to them.
You can provide icons, URLs, cell background colors, and font colors based on cell values using conditional formatting for tables, including gradient colors.
1) Open the Conditional formatting card in the Format pane.
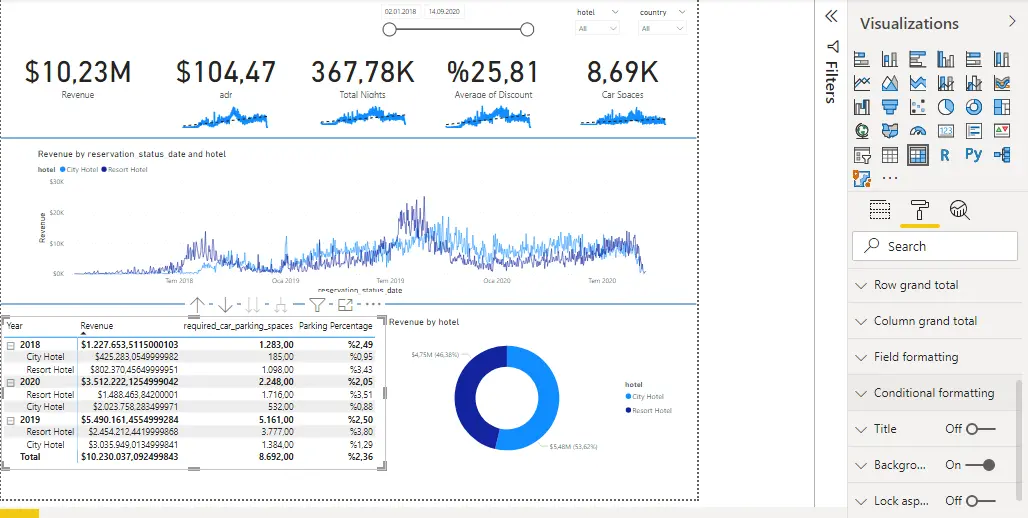
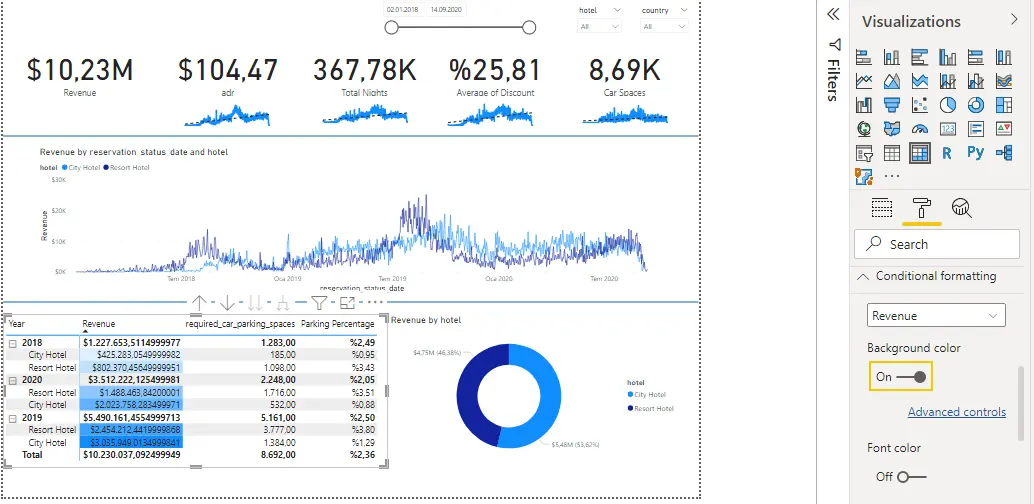
2) Choose the area you want to format, then turn on the Background color slider. Using the data in the column as a base, Power BI adds a gradient. To modify the default colors, choose Advanced controls.
You can also set up an optional Intermediate value if you choose the Allocated option.
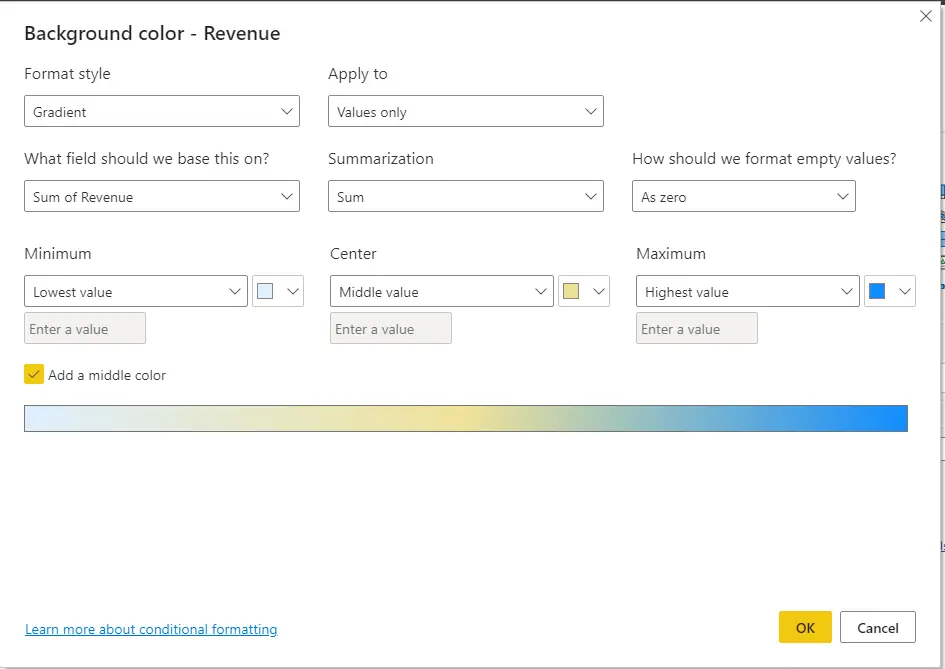
Let's now add extra formatting to the figures for the Average Unit Price. Choose Allocated, then add a couple colors before selecting OK.
3) Create a new field in the table that has both positive and negative values. I Selected Profit.
4) Slide the data bars slider to the On position to add conditional formatting to the data bar.
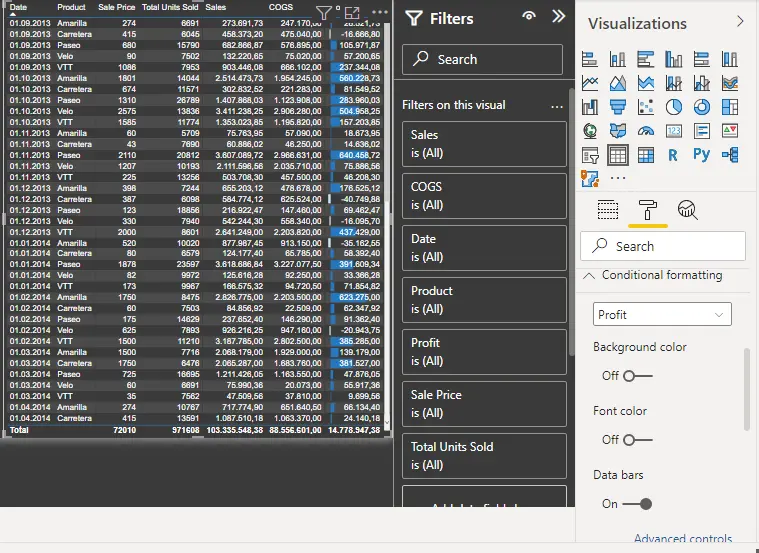
5) To alter the data bars, use the Advanced controls option. Set the Positive bar and Negative bar colors, choose Show bar alone, and make any other modifications you like in the popup that appears.
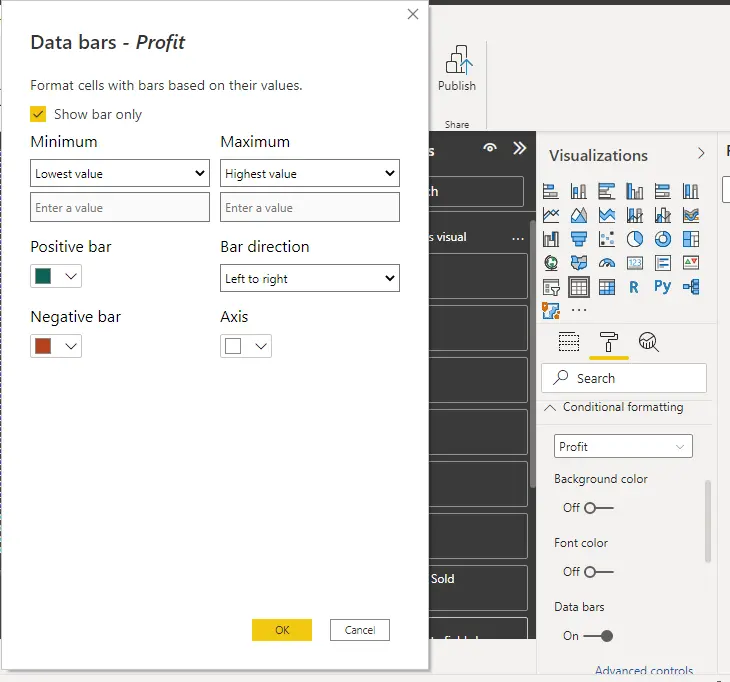
6) Select OK
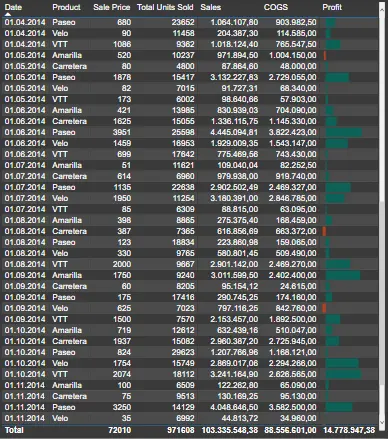
Data bars in the table take the role of numerical values, making it simpler to scan.
7) Conditional symbols can be used to add visual hints to your chart. I choosed the "Total Units Sold" option from the drop-down list on the conditional formatting card. Set the slider for the icons to "On." You can change the icons by choosing Advanced controls.