How to create and manage relationships in Power BI Desktop?

When you import multiple tables, you will most likely use data from all of them when analyzing them. Relationships between these tables are required to calculate results correctly and display accurate data in your reports. Power BI Desktop makes it simple to establish these connections.
You won't have to do anything in most circumstances because the auto-detection will handle everything for you. On the other hand, there are times when you need to forge your relationships or make changes to existing ones. It is critical to understand relationships in Power BI Desktop and how they are created and edited.
Auto-Detection During Installation
Power BI Desktop will try to find and create these relationships when you query two or more tables concurrently. Cardinality, Cross filter direction and Enable this relationship are set as relationship options by default.
Power BI Desktop looks for possible relationships in the column names of the tables you're querying. These relationships are created automatically between tables that have the same column names.
If Power BI Desktop is unsure whether there is a match, it will not create the relationship. On the other hand, you can use the Manage relationships tab to create or edit relationships manually.
Creating Relation with Auto-Detection
On the Modeling tab, select Manage Relations>Autodetect.
Manual Relationship Creation
- On the Modeling tab, select Manage New Relationships..
- Choose a table in the Create Relationship dialog's first table drop-down list. Select the column to be used in the relationship.
- Select the other table in the relationship from the second table drop-down list. After you've selected the other column, click OK.
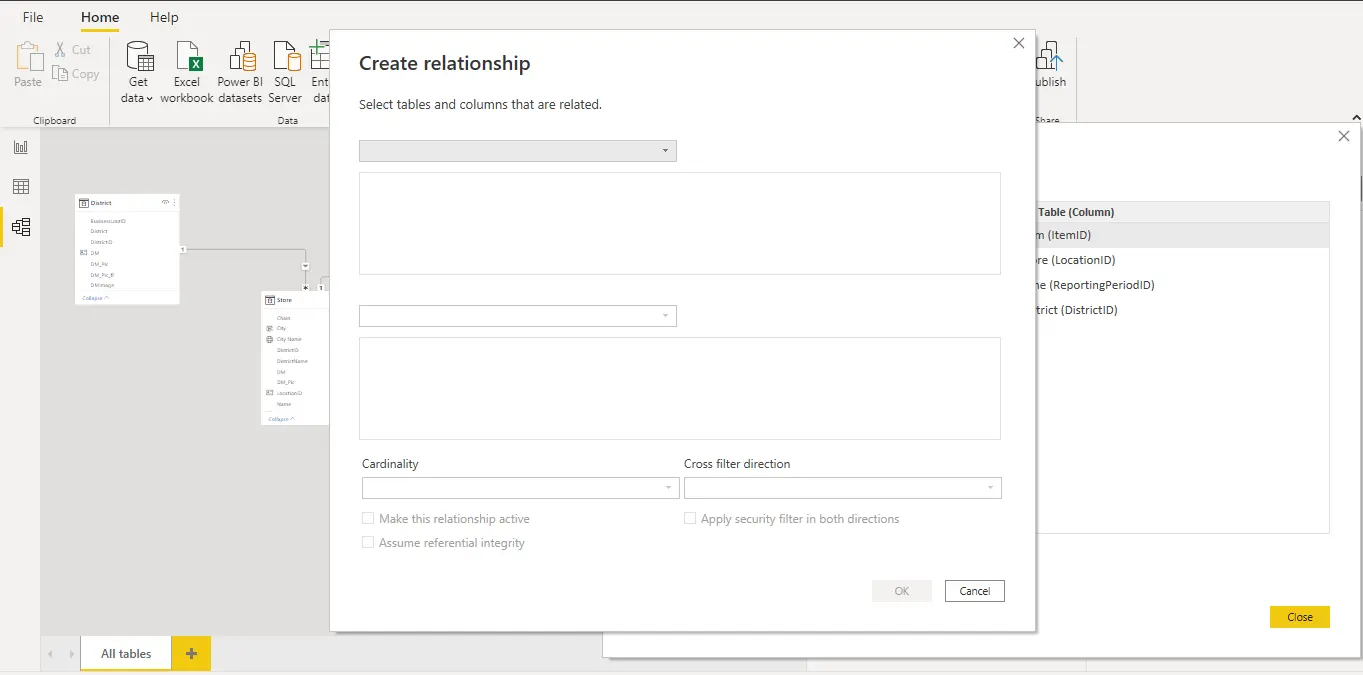
For your new relationship, Power BI Desktop automatically sets the Cardinality, Cross filter direction, and Enables this relationship settings. However, if necessary, these options can be modified.
Editing a Relationship
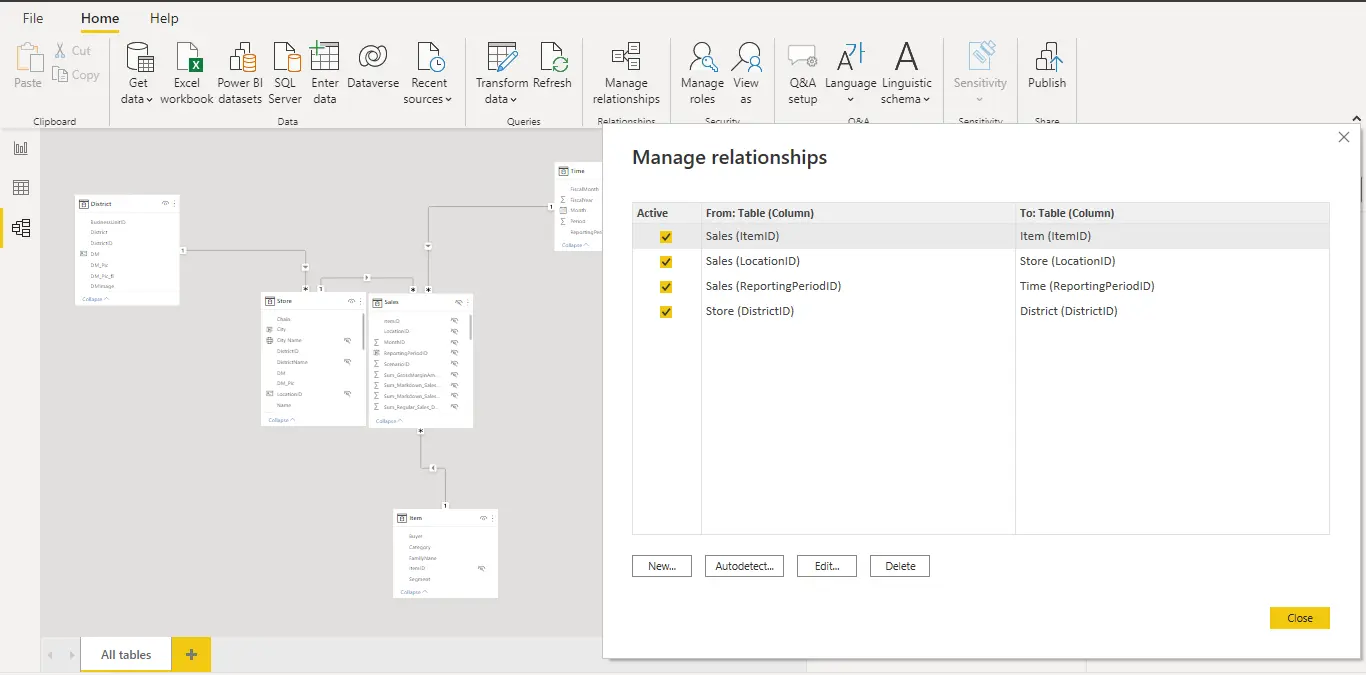
- On the Modelling tab, select Manage relationships.
- Select the relationship in the Manage relationships dialog, then click Edit.
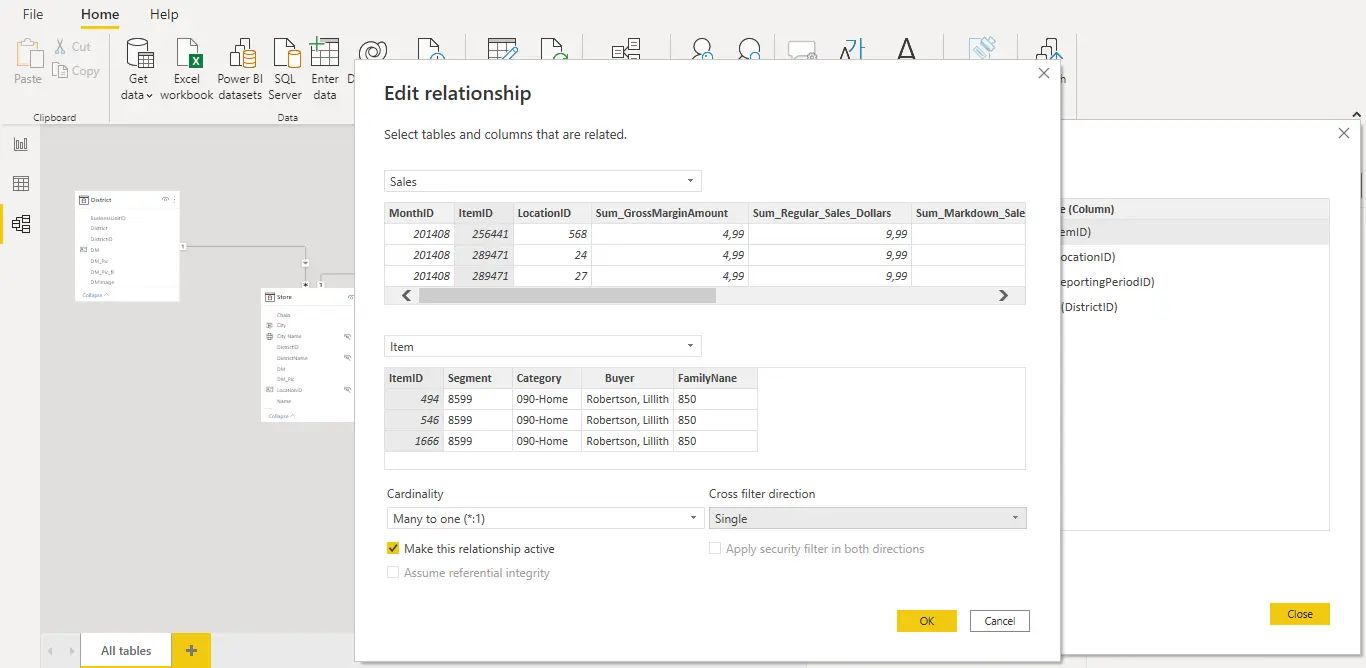
Cardinality
The cardinality option can take one of the following values:
Many-to-one (*:1): Many-to-one relationships are the most prevalent and default relationship type. It means that there can be multiple instances of a value in the given table's column, but only one instance of a value in the other related table, also known as the lookup table.
One-to-one (1:1): There is only one sample of a particular value in a column in one table in a one-to-one relationship, and there is only one sample of a particular value in the other related table.
One-to-many(1:*): In a one-to-many relationship, a given value only appears once in the column of one table, while it could appear more than once in the associated table.
Many-to-many:(:): Many-to-many relationships between tables can be established using composite models, eliminating the need for unique values in tables.
Cross Filter Direction
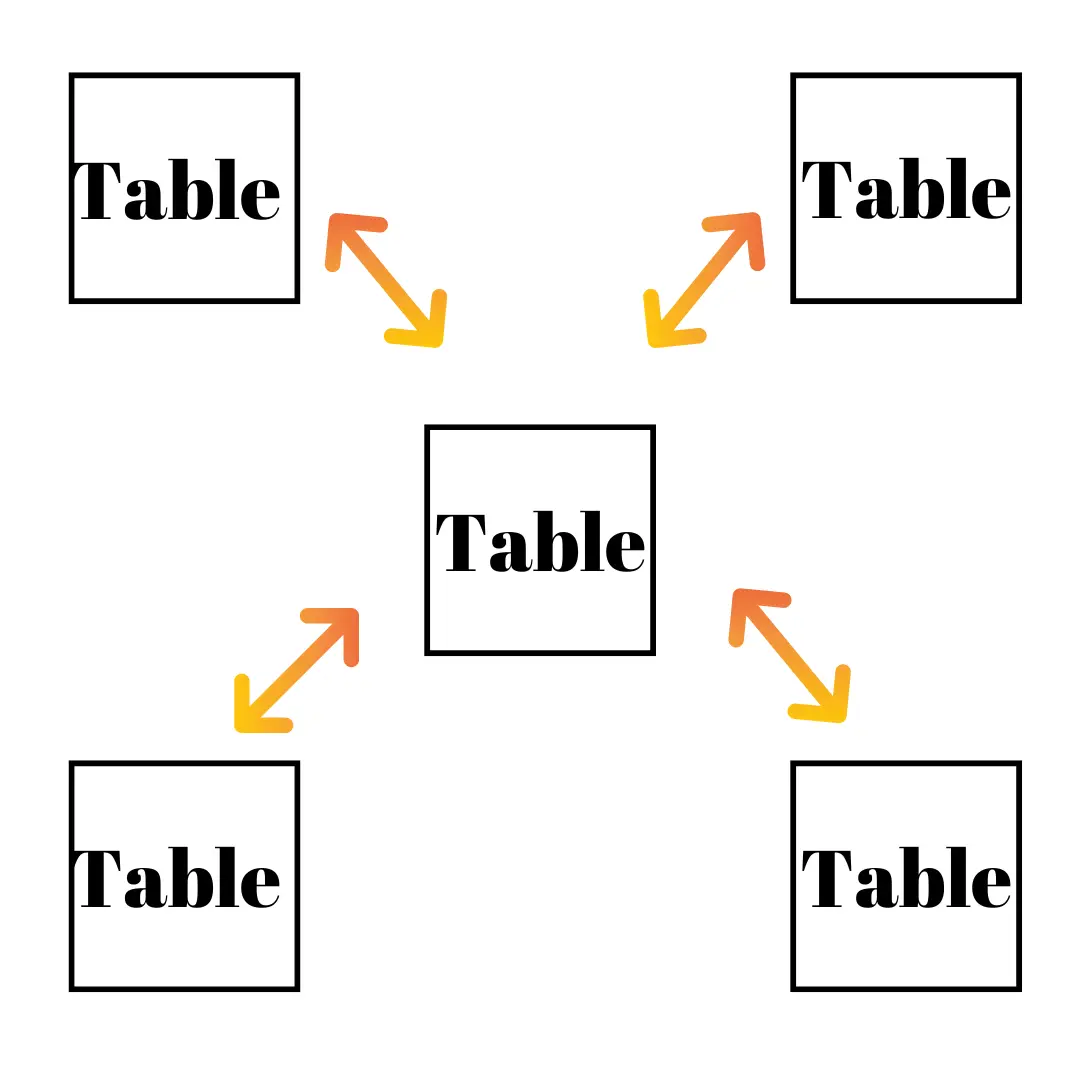
Both: It indicates that for filtering purposes, both tables are handled as a single table. With many lookup tables arranged around a single table, Both settings work effectively.
Cross-filtering in both directions works well for a table relationship pattern like the one shown below. This schema, also known as a star schema, looks like this:
With a more general pattern commonly found in databases, the cross-filtering aspect does not work properly. The diagram below is an example of this:
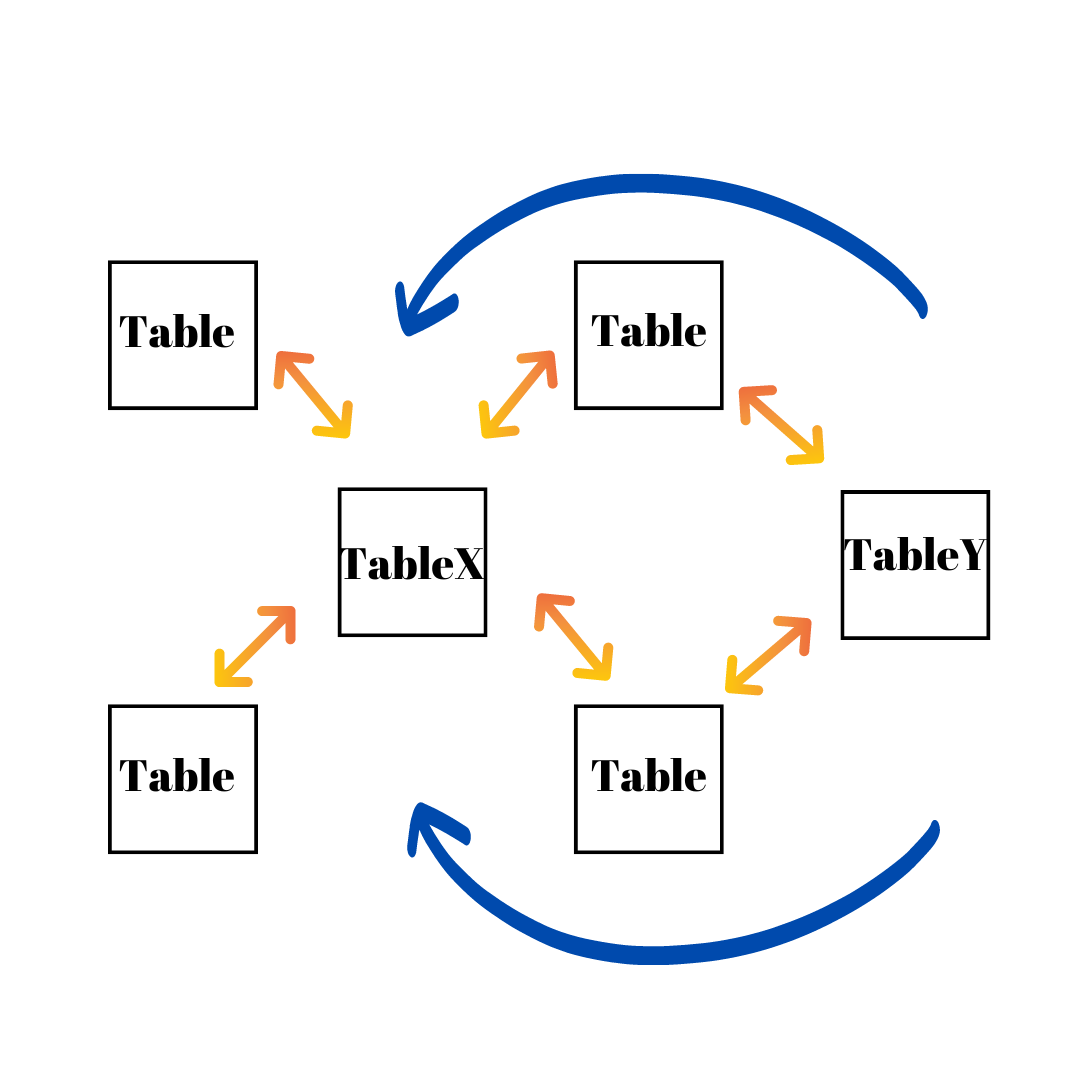
Cross filtering can produce an ambiguous set of relationships if you have a table pattern with loops like this. For example, if you sum a field in TableX and then filter by a field in TableY, it's unclear which way the filter will move (from the top table or the bottom table).
Consider TableX as a sales table with actual data and TableY as budget data as an example of such a pattern. The middle tables are lookup tables that contain information such as the partition or region that both tables are using.
One: It is the most commonly used default orientation and means that filtering selections in linked tables work in tables where values are aggregated.
Activate This Relationship
When there are several relationships between two tables, Power BI Desktop may automatically create visualizations that incorporate both tables thanks to the active relationship.


