How to create an R or Python visual with Power BI?
Power BI has features that allow you to add your own visuals in addition to various visualizations.
You can use R or Python to programmatically visualize your data in Power BI Desktop if you are a programmer.
Power BI Desktop has ready-to-use visualization options for both R and Python, which you can access from the Visualizations pane. These images are generated using a very identical process. A customized R or Python image from Microsoft AppSource is also available for import.
Note: You must utilize a personal gateway if you've chosen to use a R or Python visual and wish to update the data in the Power BI service.
How to create R visual?
Installing R on your local computer is necessary before you can create a R visual so that Power BI Desktop can execute R scripts. R can be downloaded and installed from a variety of sources, including the CRAN Repository and the Microsoft R Application Network.
After you download and install R, Power BI will enable it automatically, but you must verify it is enabled in the correct location.
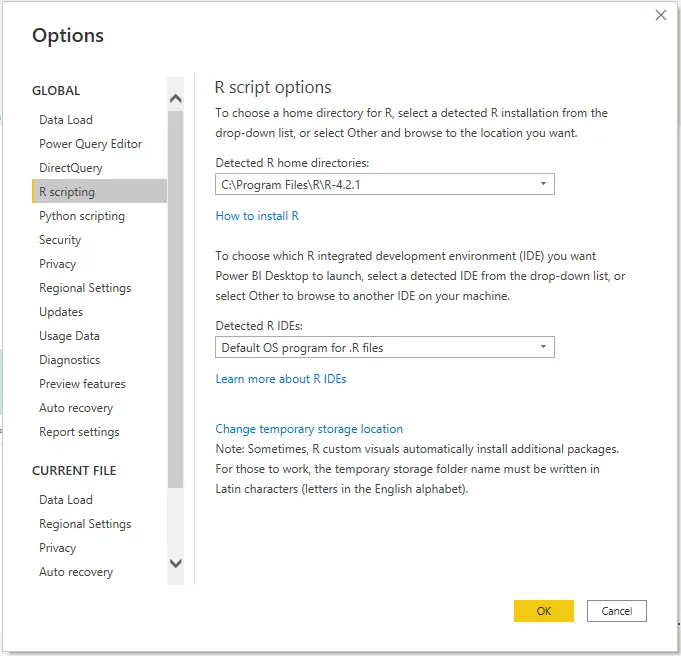
- In Power BI Desktop, go to File> Options and settings > Options and select R scripting in the General options list.
- Make sure that the local R installation that Power BI Desktop should use is correctly reflected in the drop-down menu for Detected R home directories.
In the image below, the local install path of R is specified as C:\Program Files\R Open\R-4.2.1\.
After verifying your R installation, you can create the R image.
- In the Visualizations pane, pick the R image icon, and in the pop-up window that displays, choose Enable.
- The R script editor will then appear at the bottom of the report canvas, underneath a placeholder R picture.
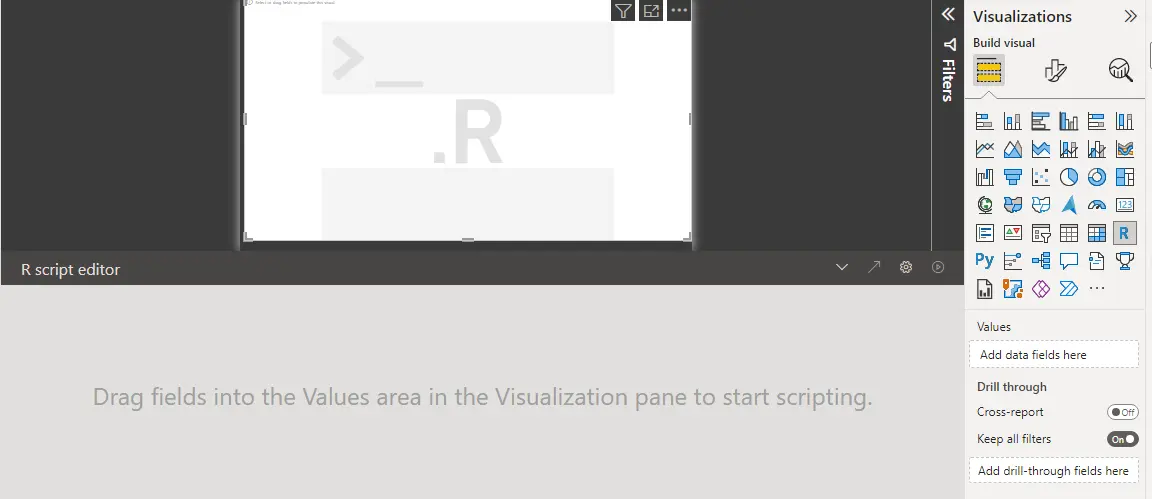
- Choose the fields you want to use in your script after that in the Field panel. These are displayed in the Values section of the Visualizations pane. You will use the data in these fields to create a drawing.
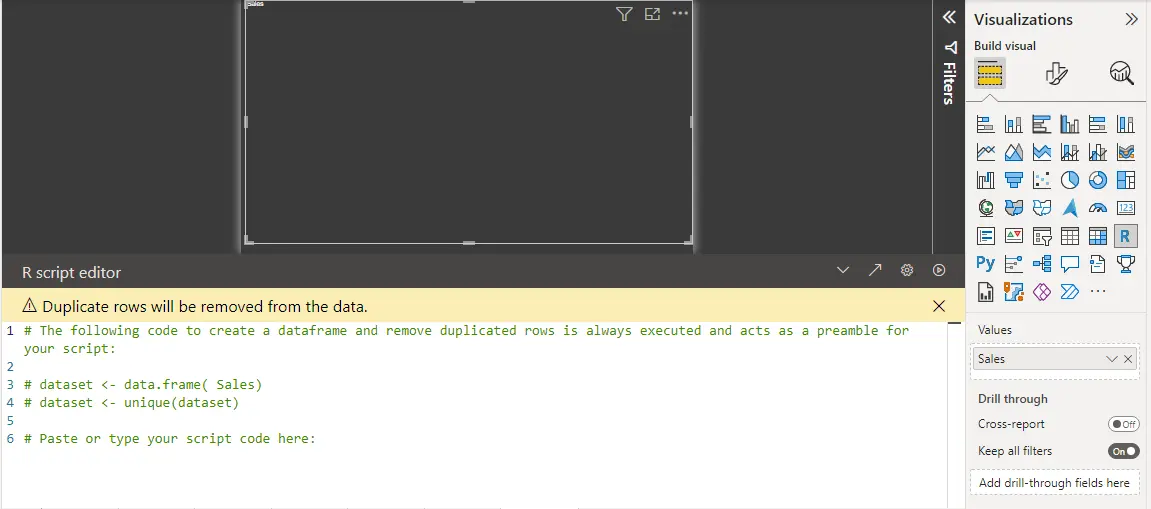
The accompanying code in the R script editor is automatically added and removed as fields are selected and removed.
The R script editor generates the following binding code based on your selections:
- The fields you added were used to construct a dataset data frame by the editor.
- Summarization is the standard aggregate.
- Fields are clustered, and duplicate rows are only shown once, just like in table visuals.
Once the fields have been chosen, you are prepared to create a R script that boots the R default service.
- Choose Run from the R script editor's title bar once the script is finished.
- Power BI Desktop defines the drawing and displays it on the canvas.
How to create Python visual?
You may start making a Python visual in Power BI Desktop right away by choosing the Python picture icon in the Visualizations pane. There are no prerequisites for doing so.
A placeholder Python picture and the Python script editor will display on the report canvas when you choose Enable in the popup that pops up.
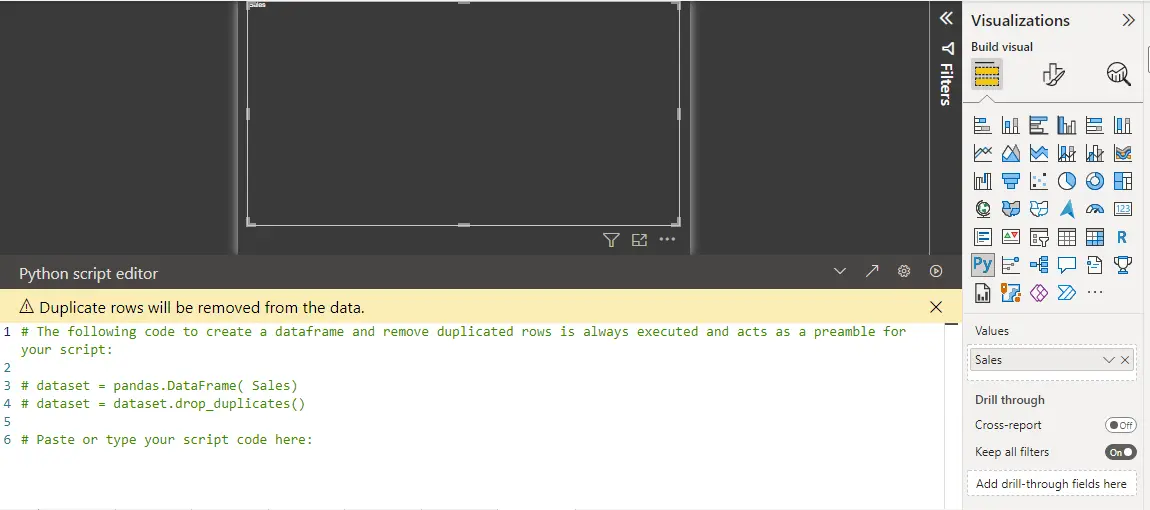
The identical process you used to make the R visual may also be used to create the Python visual.
by, Briefly stated, you choose the fields, type the Python script, and then choose Run from the Python script editor's title bar.
How to import an R or Python visual?
To import an AppSource image into R or Python:
- In the Visualizations pane, select the Get more images icon.
- Find the R or Python picture you wish to import in the window that pops up, select it, and then click Add.


