How to anaylze the performance of data models in Power BI?

You may discover that your report performs fine in test and development environments but has performance concerns when it is sent to production for widespread use.
Poor performance implies that it takes longer to load report pages and update visuals for report users. This subpar performance degrades the user experience.
A data analyst works with data 90% of the time, and 90% of poor performance is due to a faulty data model, faulty Data Analysis Expressions (DAX) language, or a combination of the two.
As your business expands, so does its data and the data model. By improving your data model early on, you can mitigate the negative impact of this growth on your data model's performance.
Performance optimization entails changing the data model's present configuration to improve performance.
A smaller data model consumes less memory and speeds up image rendering, calculations, and data refresh in reports.
Therefore, the size of the data model must be decreased while maximizing the use of the data in the model to increase performance. Some actions to take are as follows:
- Make certain that the proper data types are used.
- Removing obsolete columns and rows.
- Preventing duplicate values.
- Using measures instead of numeric columns.
- Cardinalities are being reduced.
- Examining model metadata.
- As much information as possible should be summarized.
Examine the performance of measures, relations, and visualizations
Poor report performance is likely if your data model contains multiple tables, complex relationships, complex calculations, multiple images, and redundant data. Users get a bad user experience when a report performs poorly.
To improve performance, you must first pinpoint the underlying issue, i.e., the elements of your report and data model causing performance issues. Then, you may take action to fix these problems and enhance performance.
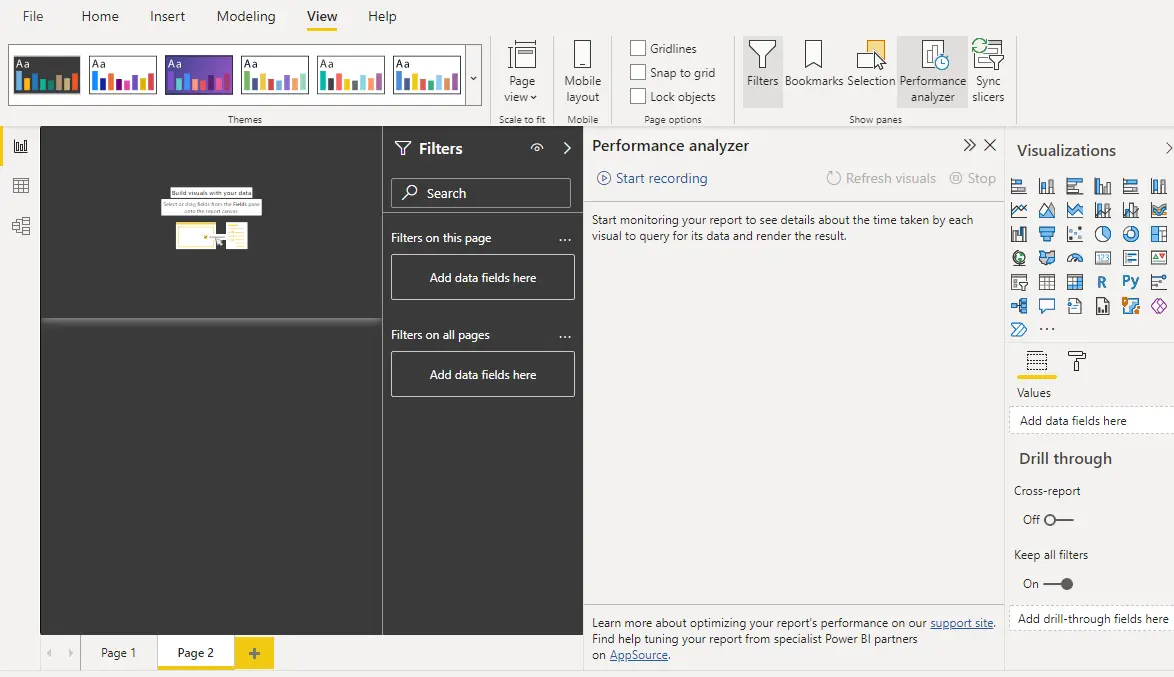
Analyzing performance
You may learn how each of your report items performs when users interact with them by using Power BI Desktop's Performance analytics tool. For instance, you can specify how long it takes for a certain image to reload following a user activity.
To ensure the most accurate results in your analysis, begin with a clean image cache and a clean data engine cache before running the performance analysis.
- Image cache - After you upload an image, you cannot clear the image cache without closing and reopening Power BI Desktop.
- Data engine cache - The findings of your analysis can be inaccurate since results are cached when a query is done. Before running the image again, you must clear the data cache.
After clearing the caches and opening the Power BI Desktop file on a blank page, navigate to the View tab and select the Performance analysis option.
To begin the analysis, select start recording, pick the report page you want to examine, and then interact with the report elements you want to evaluate.
While you are working, the Performance analysis pane will show the outcomes of your interactions. When you're finished, press the Stop button.
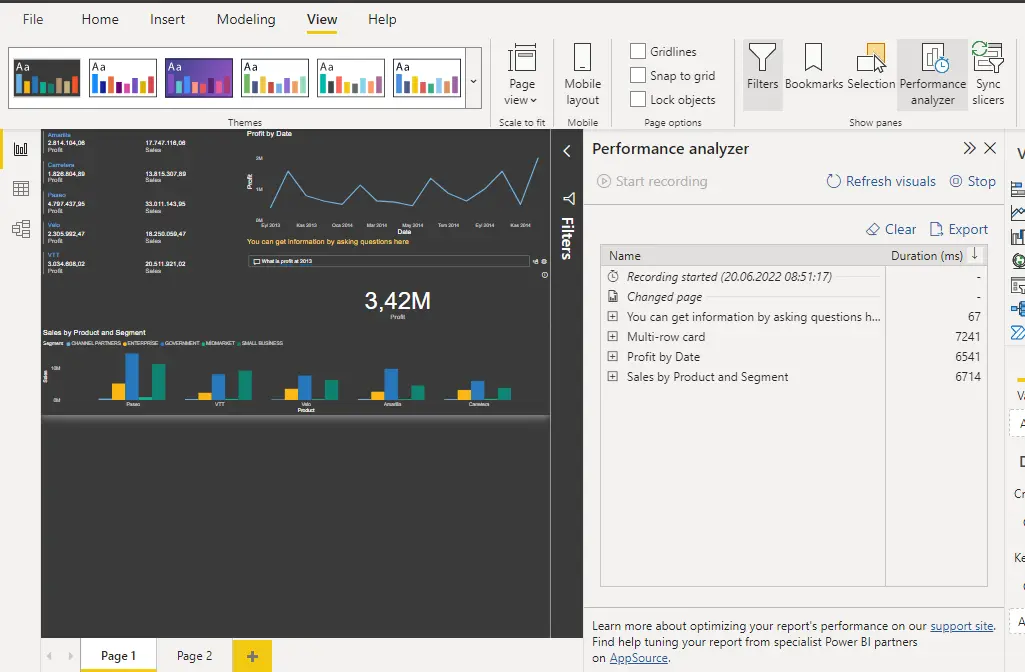
You can examine the outcomes of your performance test in the performance analysis pane. You can filter test results.
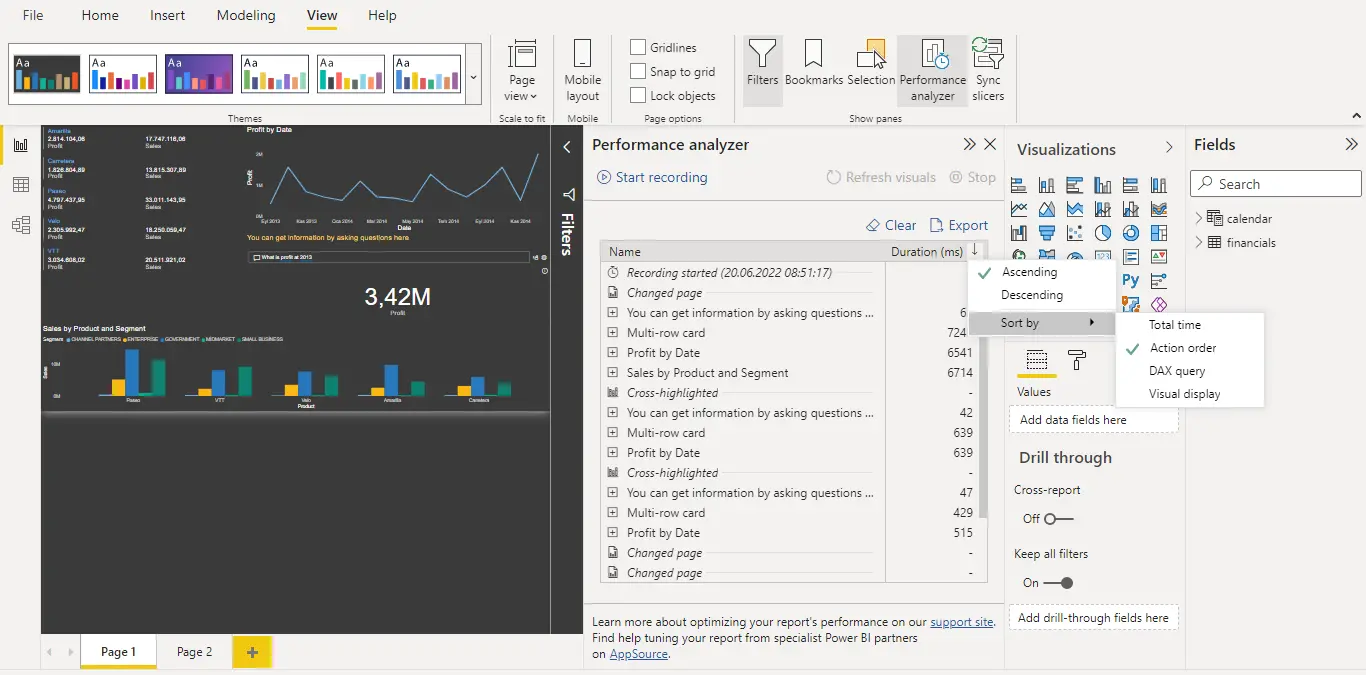
The time taken to accomplish each of the following categories of tasks is displayed in the log information for each image:
- DAX query - the time it takes for Analysis Services to process the query and return the results after it is submitted by the visual.
- Image rendering - The amount of time it takes for an image to appear on the screen, including time spent receiving web images or geocoding.
- Other - Length of time required for an image to prepare queries, wait for other images to finish, or carry out other background processing operations. If this category has a long duration, the only way to shorten it is to improve DAX queries for other images or reduce the number of images in the report.
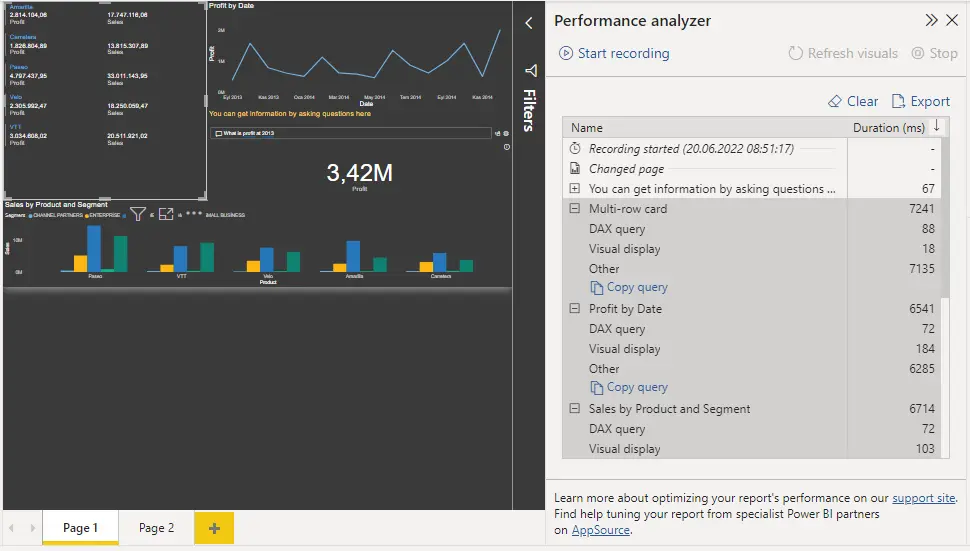
The analytics test results assist you in understanding the operation of your data model and identifying areas for improvement. To find long-term items, compare the length of each item in the report. You must concentrate on these items and investigate why they take so long to load on the report page.
You can use DAX Studio, a free open source tool provided by another service, to further analyze your queries.
You should visit this page to improve the performance of your data model.


