How to filter in Power BI?
Data that you don't want to focus on is removed using filters. Highlighting is typically not a filtering technique.
Typically, highlighting doesn't get rid of extraneous information from images. It emphasizes relevant information in its place. Although faded, the remaining info is still discernible.
Filters can be applied in the Filters pane, or slicers can be chosen directly on the report page. The Report Designer's additional filters are displayed in the Filters pane along with fields in each graphic.
The Filters pane allows you to construct four common filter types.
- Image filter: pertains to a solitary image on the report page. Picture-level filters are displayed when you choose an image on the report canvas. You can still choose and filter an image even if you are unable to alter the report.
- Page filter: relates to each and every image on the report page.
- Report filter: Apply to every report page.
- Detailing filter: You may create a target report page that focuses on a particular entity using the Power BI service and Power BI Desktop drill-down. Users can drill down on the targeted page from other report pages by right-clicking a data point for that item.
Basic and Advanced Filtering
Report readers have the option to switch from Basic filtering to Advanced filtering by default.
Basic filters show a list of all values in the field. By using the page, picture, and report filters in the Reading or Editing view, you may locate and choose the value you're looking for.
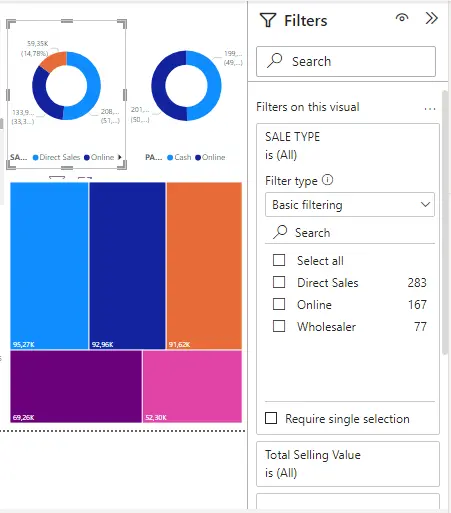
When a filter has the word All next to it, it is unfiltered and shows all field values.
Advanced filters allow you to use more complex filters. For example, you can search for values that contain or don't include, start with, or don't use a particular value.
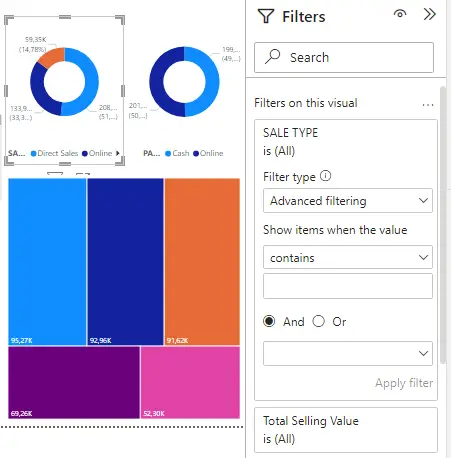
When you create a report, you can turn off the toggle and not allow report readers to change the filter types. You can also turn off the search in the filter pane.
What are the filter modes in Power BI Service?
When working with Power BI service reports, there are two modes: Reading view and Editing view. The filtering features available to you depend on what mode you are in.
- When you are in Reading view, you can interact with any filters that are currently present in the report and save your selections. You cannot add new filters.
- In the edit view, you can add all kinds of filters. Even if report readers open the report through the mobile app, the filters are stored along with the report when you save it. The filters you added can be changed by users who see the report in the Reading mode, but they are unable to add new filters.
What are the filters in the reading view?
If you select a visual in the Power BI service Reading view, the Filters pane looks like this:
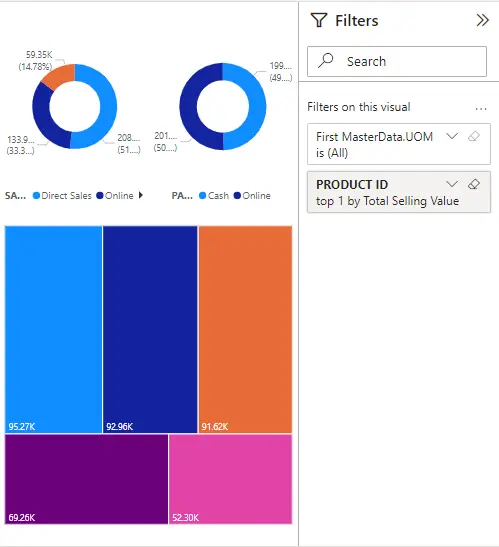
Each image has filters for all areas in the image. You can add more reports when you create a report. In this Filters pane, the image has three filters.
In Reading view, you explore data by modifying existing filters.
You are filtering only the report view. When you exit the report, your changes are saved with your report view, even if you open the report in the mobile app. To undo your filtering and return to the default values set by the report author, select Reset to default from the top menu bar.
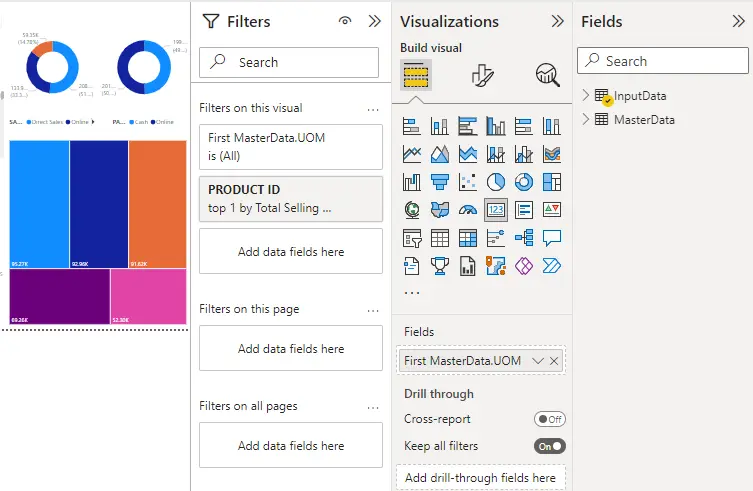
What are the filters in the edit view?
When you open the report in Power BI Desktop, you will see that Filters is just one of several editing panes. If you open a report in the Power BI service Edit view, you'll see the same panes.
How to work with filters in edit view?
- You can add filters in Power BI Desktop and Power BI service Edit view.
- After adding filters, you have many formatting options for them. For example, you can hide, lock, or reorder filters, or format them to match the rest of the report.
- You can also change the way images interact with Cross highlighting and cross-filtering.
What are cross-filtering and cross highlighting?
You can explore relationships between images in your report without using a filter or slicer. Select a value or axis label in a visual to cross-filter or cross-highlight related values in other visuals on the page. They don't all behave the same.
- Cross highlight When a value is selected in a visual, related data in visuals such as columns and bar charts are highlighted. Cross-highlighting does not remove irrelevant data from these images. Unrelated data is still visible but dimmed.
- Cross-filtering Selecting a value in a visual mostly acts as a filter on other visuals such as line charts, scatter charts, and maps. Only relevant data remains visible in these images. Unrelated data is not visible as you see it with the filter.


