What is Power BI Desktop?

Data analysis, analytics visualization, and distribution of visual results are all possible with Microsoft Power BI, a business intelligence tool.
More information regarding Power BI may be found at What is Power BI.
It is a free Microsoft Power BI application that you can install on your local computer and use to connect, transform, visualize and share your data.
Power BI Desktop allows you to connect and combine multiple data sources in a data model. This data model enables you to create and distribute images and reports within your organization.
Most business intelligence users create reports in Power BI Desktop before sharing them with others through the Power BI service.
How does the functioning of Power BI Desktop work?
Using Power BI Desktop, you can:
- Connecting to data, including multiple data sources.
- Shaping data with queries that create informative data models.
- Generating reports and infographics using data models.
- Share your reports so others can benefit, base, and share from them. The software's desktop version is called Power BI Desktop. Prix files can be shared just like any other file form, in addition to being able to do so by submitting them to the Power BI service.
Microsoft's query engine, data modelling, and visualization tools are all included in Power BI Desktop. Users can create and easily share queries, datalinks, models, and report collections. Modelling, creating, sharing, and expanding new data insights are made simpler by the union of Power BI Desktop and Power BI service.
How do we set up and use Power BI Desktop?
Click the Free Download button on the Power BI Desktop download page to get it. You can also select the "See download and language options" link for download options.
The Power BI service also offers the Power BI Desktop app. Click the Download icon on the top menu bar, followed by Power BI Desktop.

The Welcome screen appears the first time you launch Power BI Desktop.
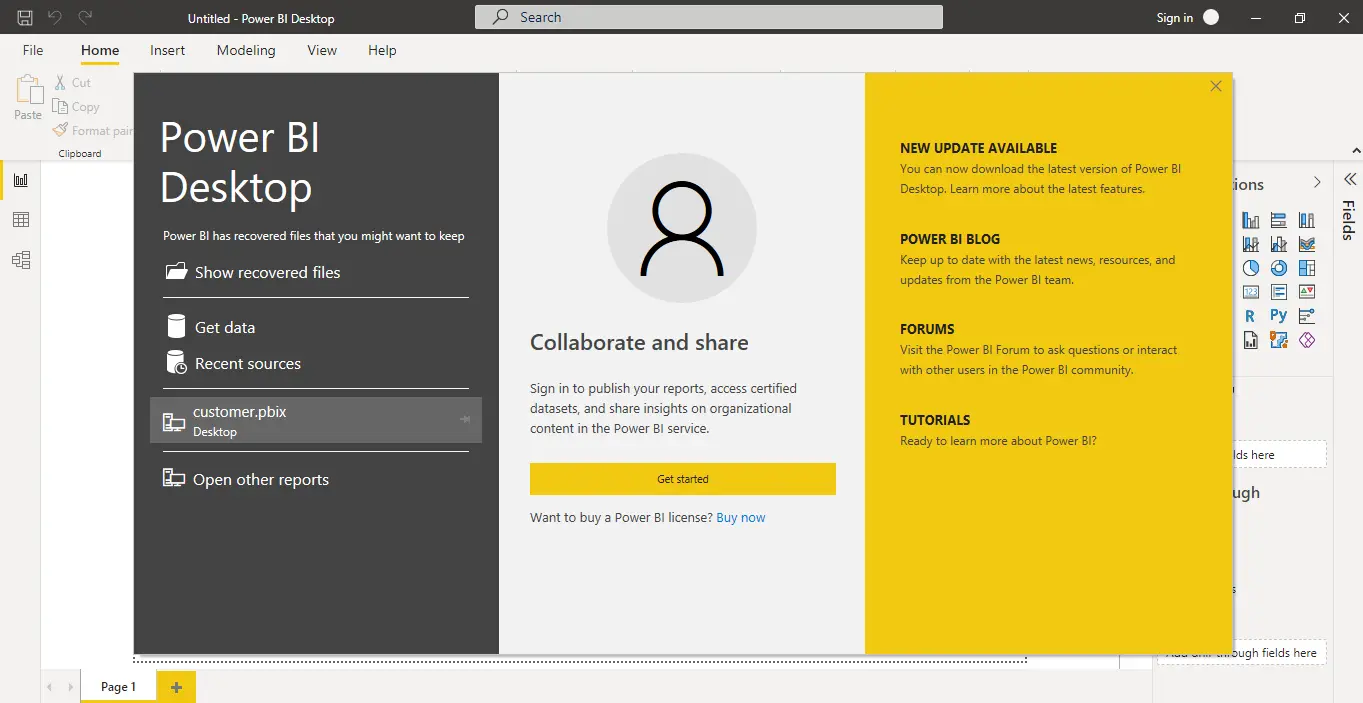
You can access data, check-up on current sources, examine recent reports, view other reports, or choose other links from the Welcome screen.
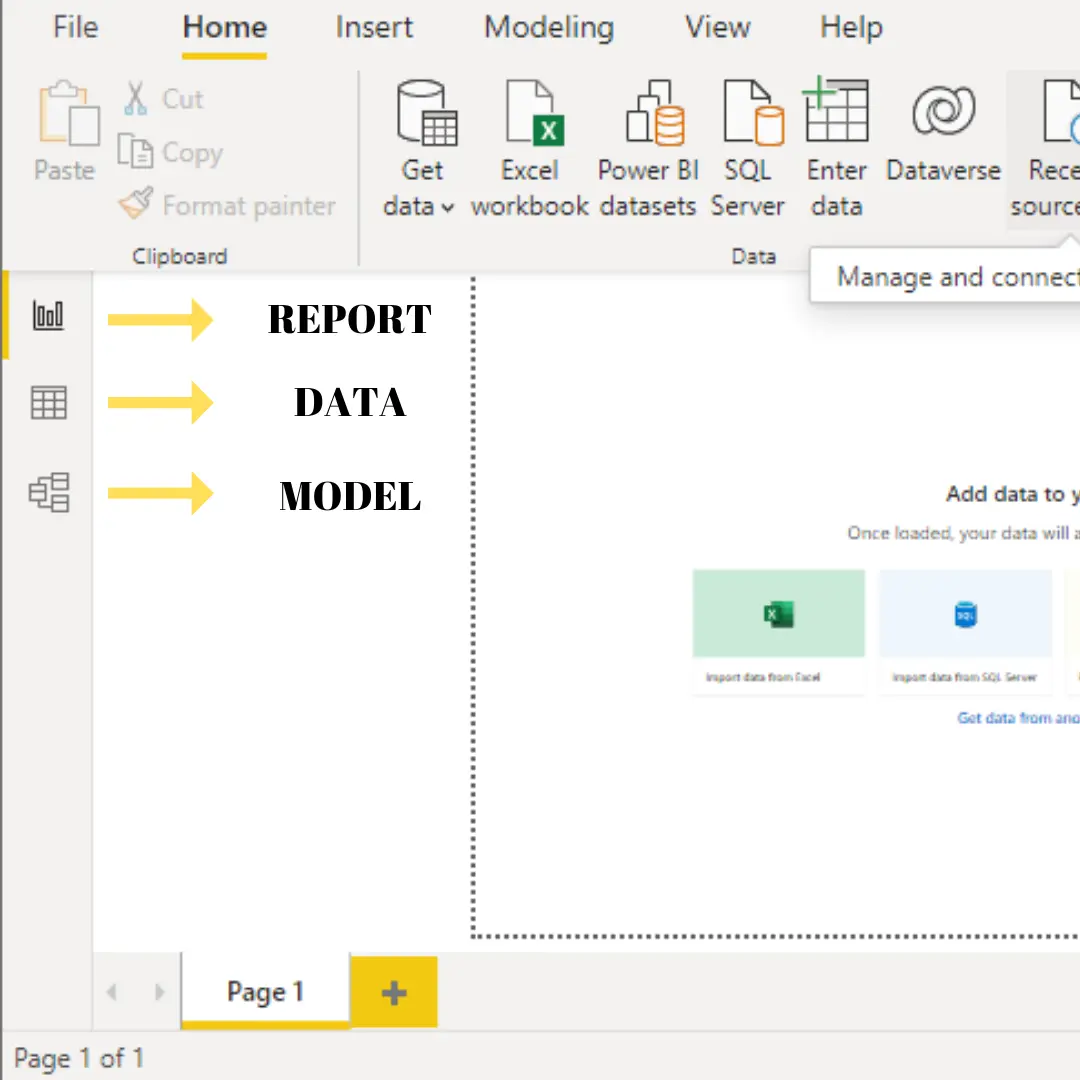
From the left side of the canvas, Power BI Desktop offers three views. In chronological order, here is a list of the views:
- Report: This is where you will spend the majority of your time creating reports and visuals.
- Data: You may see the tables, metrics, and other data in this view that make up your report's data model. You can also change the data to make it more helpful for the report model.
- Model: You may check and manage the relationships between the tables in your data model in this view.
The report view is the default, and you can switch between them by clicking on any of the icons.
The following image depicts three views, as shown on the canvas's left side:
Power Query Editor
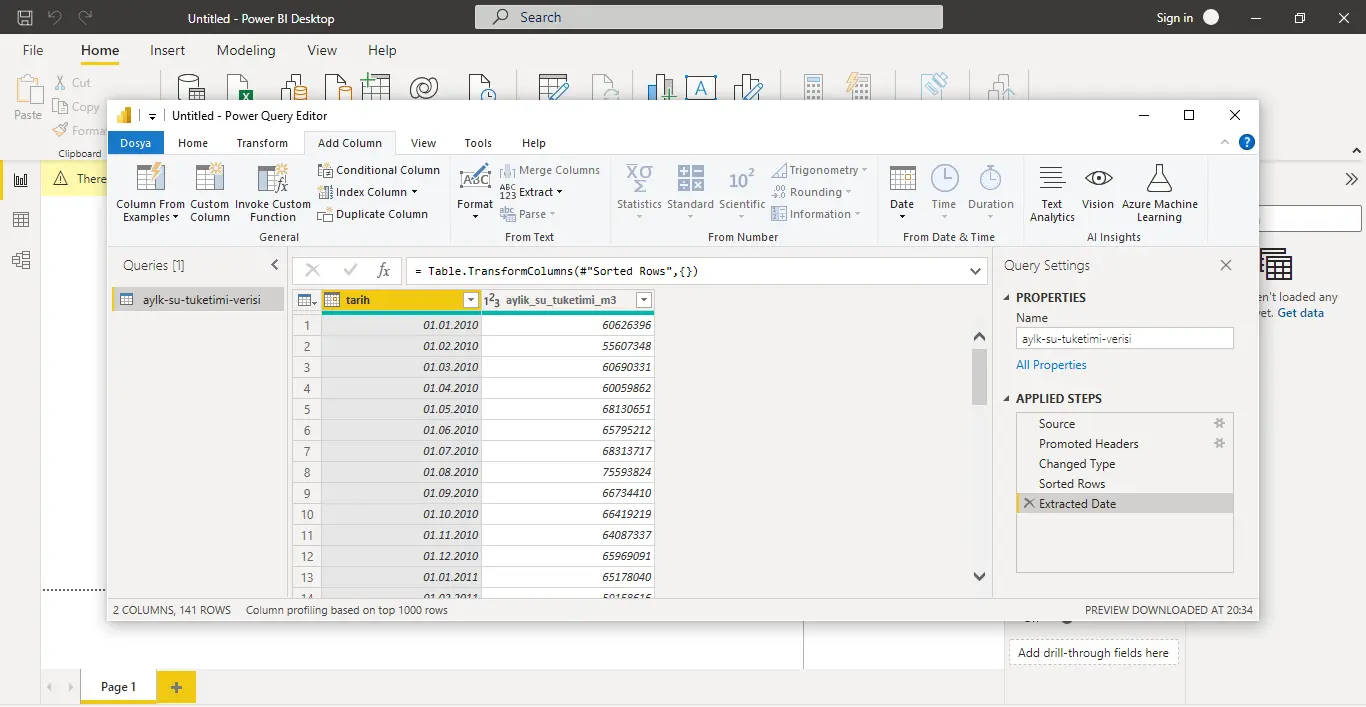
The Power Query Editor view, which opens in a separate window, is also available in Power BI Desktop. You can create queries and transform data in the Power Query Editor, then load the collapsed data model into Power BI Desktop to generate reports.
In Power Query, any modification you make is stored in the applied steps. These procedures are used every time this query links to the data source so the data is always transformed as you want.
To start the Power Query Editor:
- In the Queries section on the Home, select Transform data.
How Connect to data?
To begin using Power BI Desktop, connecting to data is the first step. You may connect to a wide range of data sources with Power BI Desktop.
- On the Login tab, select Get Data>Other.
- A large number of categories are shown in the Get Data screen, which Power BI Desktop can connect to.
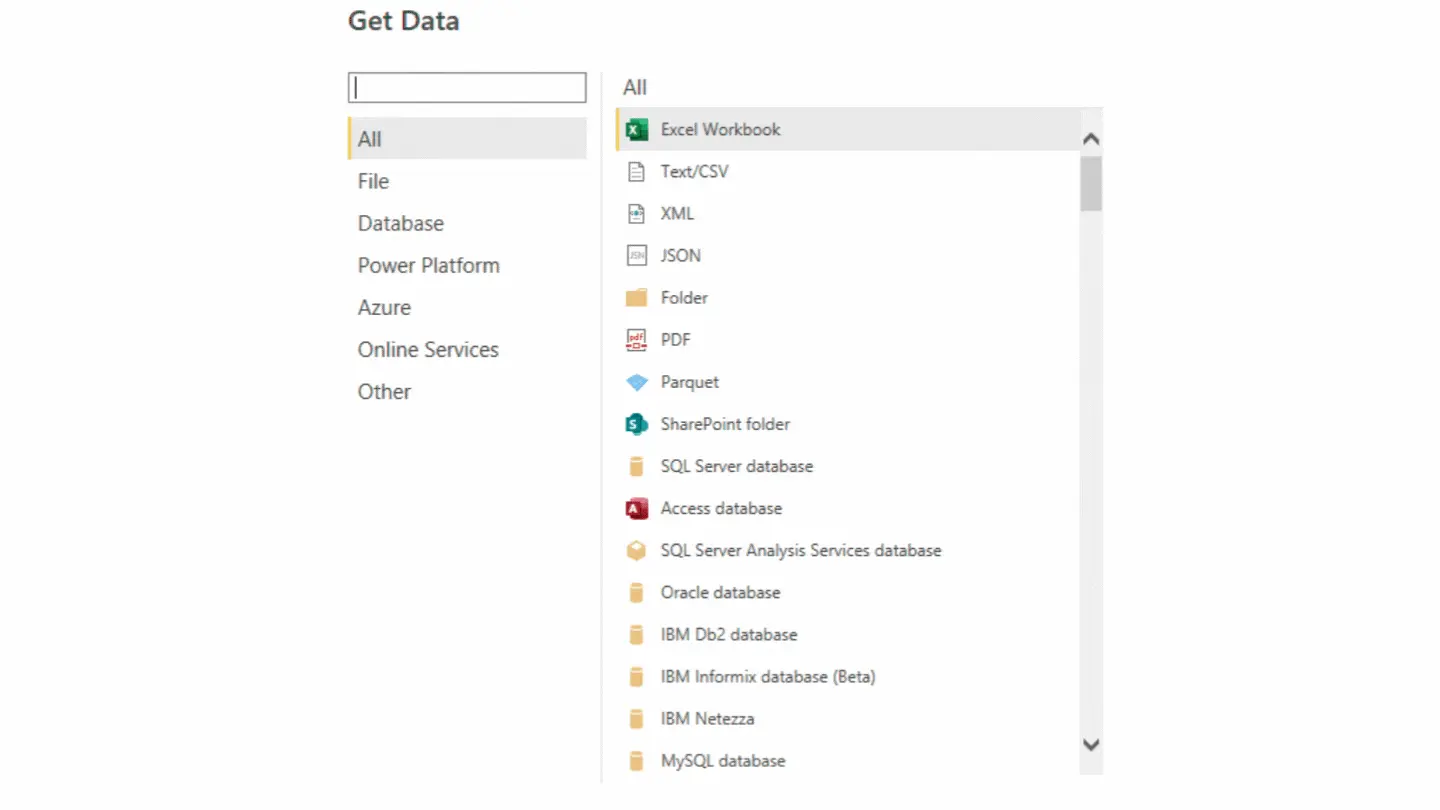
After selecting the data type you will connect to, the next screen will show up. You import the data by clicking the Get data button.
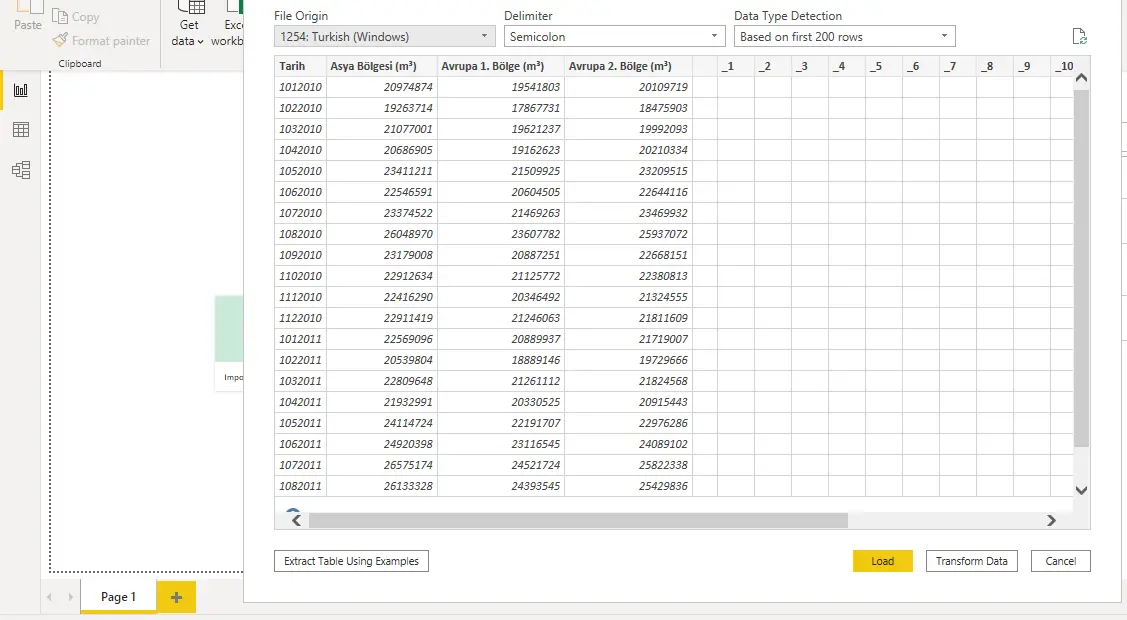
The Power Query Editor launches with a sample view of the table when you choose Data transformation.
How do we visualize our data in Power BI Desktop?
After obtaining a data model, you can create images by dragging or selecting the fields onto the report canvas.
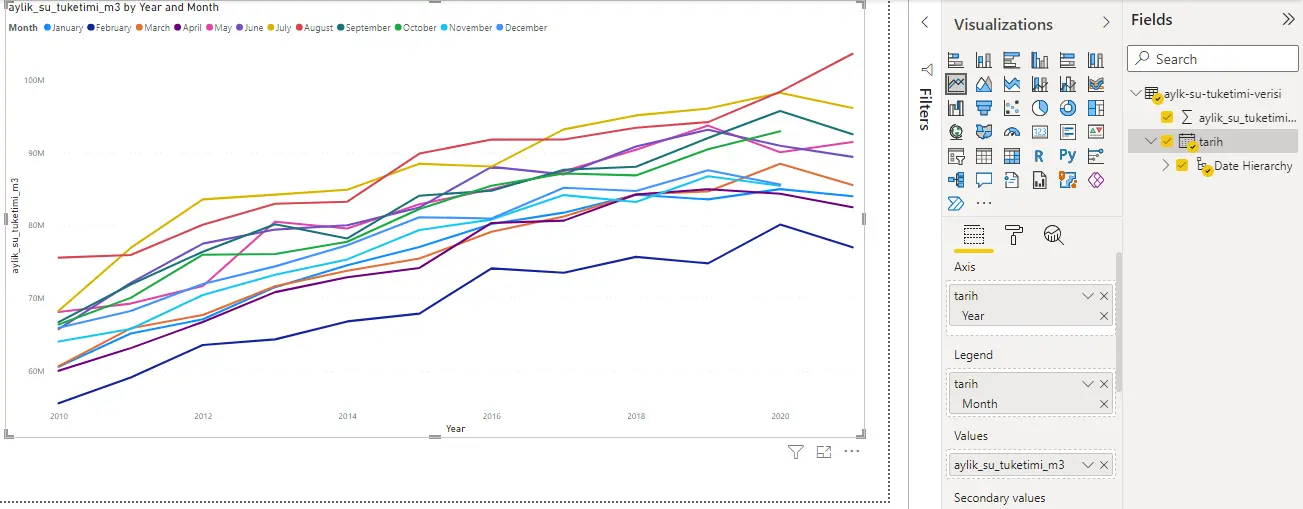
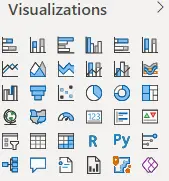
A visual is a graphical description of the data in your model. Power BI Desktop offers a variety of visual types for you to pick from.
How to create a report in Power BI Desktop?
In the Power BI Desktop Report view, visualizations and reports may be created. There are six key areas in the Report view:
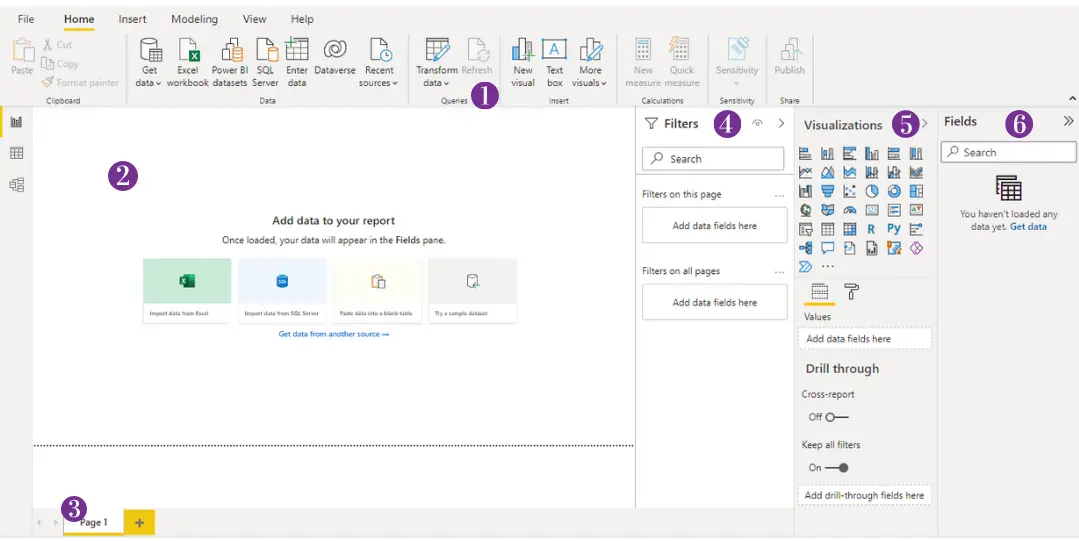
- The top section displays frequently used tasks interested reports and visualizations.
- The middle canvas area where visualizations are created and edited
- The report page can be added or chosen using the Pages tab at the bottom.
- You could filter data visualizations in the Filters window.
- The Visualizations pane is where you can add, modify or customize visualizations and apply annotation.
- The Fields pane displays the fields that are part of your query. These fields can be moved to the canvas, the Filters pane, or the Visualizations pane for use in generating or editing visualizations.
The Filters, Visualizations, and Fields panes can be expanded or collapsed by clicking the arrows at the top of the panes.
The Visualizations pane displays information about the visualization and allows you to change it.
- Icons indicate the type of visualization created. By choosing a different icon, you can alter the type of visualization that is now chosen. Alternatively, you can create a new visualization by choosing an icon that has no visualization chosen as of yet.
- The Fields option of the Visualization pane allows you to drag data fields display and other field boxes in the pane.
- Formatting and other controls can be applied to visualizations using the format option.
Depending on the type of visualization and the data you have, you can choose from the options in the Fields and Format sections.
On various report pages, you can display different visualizations. Select the + icon next to the current pages in the pages bar, or click Add>New Page on the Home tab, to add a new page.
Using the Insert group on the Home tab, you may add text fields, photos, and buttons to the pages of your reports.
How do we share our Reports from in Power BI Desktop?
When a report is prepared for sharing, you can upload it to the Power BI service and make it accessible to anybody in your company who has a license for the service.
You can also save your Power BI report and share it as a file with anyone you want.
For the Power BI Desktop report to be published:
- On the Home ribbon, select Publish.
- It's possible that Power BI will ask you to log in or choose a destination. You must choose where you wish to share the report while using the Power BI service.
To open Power BI in a browser, go to https://app.powerbi.com. By choosing to Get data in the bottom left corner of your Power BI home page, you can begin the installation process for your Power BI Desktop report.
You should check out other posts like What is Power BI Components?
Following this topic, you should have a look at Modeling in Power BI Desktop.


