Power BI Architecture

Understanding how a technology's architecture works are one of the foundational elements of learning it.
Microsoft Power BI is a well-known business intelligence tool. In general, while reporting capabilities are prominent, Power BI is more than just reporting.
Power BI is a tool that integrates with Microsoft's other business intelligence tools, aiming to fully respond to the needs in the field of business intelligence, supporting the ingestion of various data sources, storing data, analyzing data with machine learning, and reporting the analysis result.
How does the Power BI Architecture work?
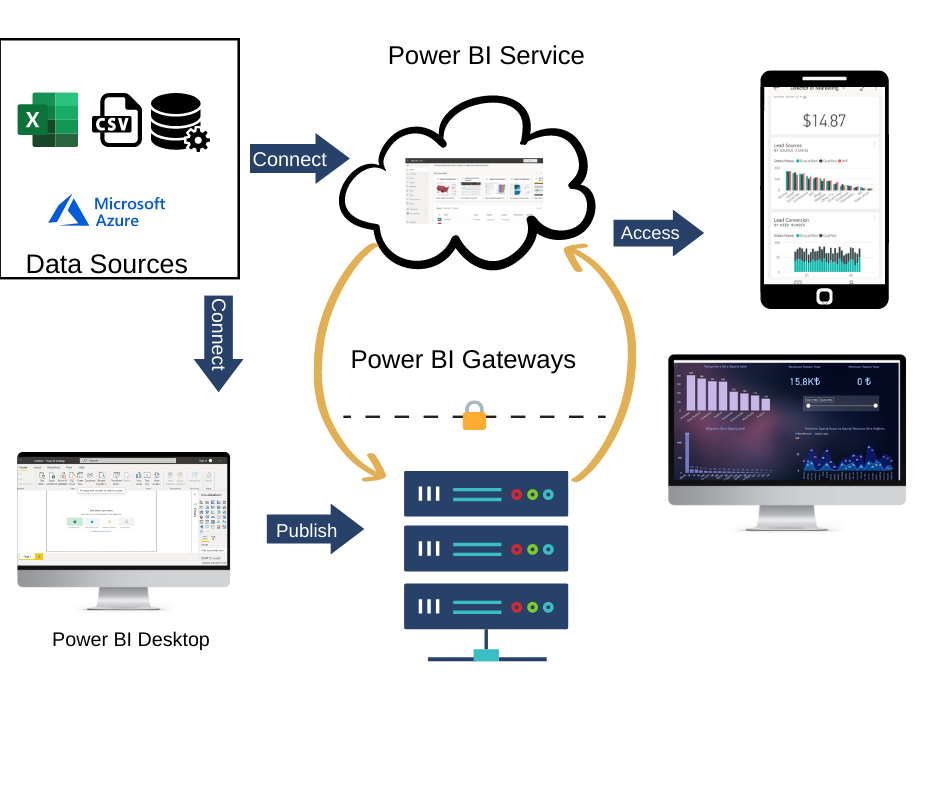
The user receives data from various sources. Then, with the Power Query component, which allows editing the data on the Power BI desktop, the data is cleaned and transformed, and made ready for use. A report is created using various visualizations provided by Power BI.
Power BI Service, Power BI's cloud-based public platform, or Power BI Report Server, the on-premises platform protected by firewall security, publishes the generated reports.
Dashboards can be created by pinning visualizations from published reports.
Collaborate with other users by sharing dashboards and reports via phone, tablet, and web browser.
Power BI Architecture

Power BI's architecture is built on an Azure platform service. You can connect a variety of data sources with Power BI. Based on the dataset, Power BI Desktop can generate reports and data visualizations.
The Power BI gateway is linked to on-premise data sources to provide continuous data for reporting and analytics. The cloud services used to publish Power BI reports and data visualizations are known as Power BI services. If you want to see your data from everywhere then, you can use Power BI mobile app.
Components
Data Sources
As you can see from the examples above, Power BI supports a wide range of data sources. Data can be imported from cloud-based online data sources or directly connected to live connections. There is a 1GB limit when importing data from on-premises or online services.
Power BI Desktop
This free platform allows you to connect to data sources, clean and transform data, model data, and report on it.
Power BI Gateway
Gateways aid in the extraction of data to Power BI platforms via secure channels for analysis and reporting in organizations where data is secure and monitored. It is typically used to connect to and access on-premise data.
Power BI Mobile
These apps are used to view views like reports and dashboards on mobile.
Embedded Power BI
Offers APIs for embedding images into custom applications.
Power BI Service
It is a web-based cloud platform for sharing Power BI Desktop reports, collaborating with other users, and creating dashboards.
Power BI Service Architecture
Microsoft's Azure cloud computing infrastructure and platform serve as the foundation for the Power BI service. Power BI's service architecture is divided into two groups: the Web Front-End cluster and the Backend cluster.
- The Web Front-End is in charge of the initial connection and authentication to the Power BI service.
- The Back-End is in charge of all subsequent user interactions.
Front End Cluster
The front end serves as a bridge between the clients and the back end. Front-end services are used to establish an initial connection and authenticate clients using Azure Active Directory. Azure Active Directory stores user identities.
Following authentication, Azure Traffic Manager routes user requests to the closest data centre, and the Azure Content Delivery Network (CDN) distributes Power BI content to users.

Back End Cluster
It is responsible user interactions with the Power BI service are handled. The Gateway Role connects user requests and the Power BI service. Users have no direct interaction with any other role except the Gateway Role. The Gateway Role is processed by Azure API Management.

The logic of Power BI Service
- Power BI saves data in two major repositories: Azure SQL Database and Azure Block Storage. Datasets can be saved to Azure Block Storage, and all system data and metadata are saved to the Azure SQL database.
- Accurate user requests and sending them to the Gateway Role. It handles requests and routes them to the appropriate components, such as Data Movement Role, Data Role, and Presentation Role.
- The presentation role manages all associated visualization queries such as reports and dashboards. sends requests to the Gateway Role to the Data Migration Role or the Data Role for all relevant datasets.
- The Azure Service Bus connects and retrieves data from the cloud and on-premises data sources. Submits a request to execute on-premises data source queries and retrieve data from the cloud service.
- Azure Service Fabric supports all Power BI Service components and microservices.
- Azure Cache helps report data stored in the memory of the Power BI system.
Due to large datasets, the use of data in other applications, or the development of custom machine learning, we may want to use more services than Power BI.

The diagram above depicts a reporting solution for large organizations. The data can be moved and transformed by the Azure data factory. We can then store the data in a variety of ways, depending on the nature of the data.
There are numerous options for running machine learning on data. Finally, we create data models from which we can generate reports. This combines the Power BI architecture with a complete reporting solution. Streaming data can also be accessed via Event hub and Stream analytics.


