What are the Power BI components and building blocks?

Power BI is a cloud-based business intelligence tool made up of various components and building blocks to uncover, analyze, and report data from a wide variety of data sources.
What is Building Block?
DataSets
A dataset is a grouping of data that may be imported or linked. Power BI lets you connect and import all types of data sources, as well as collect them all in one place. Datasets can also use data from data streams as a source.
- You can use it in one or more workspaces.
- It can be used in many different reports.
- Visualizations from that dataset can be viewed in many different dashboards.
Visualization
It is the visualization of data. Visualizations display the insights Power BI gains from the data. Visualizations make insights easier to interpret because your brain can understand a picture faster than grasping a spreadsheet of numbers. Because they're highly interactive, you can slice, filter, highlight, modify, and even drill into visualizations.
Reports
A Power BI report consists of one or more pages with visualizations such as pie, and waterfall. You can create reports from scratch in Power BI, and import them with dashboards that your colleagues have shared with you, or Power BI can create them when connecting to databases from Excel, Power BI Desktop, databases, and SaaS apps.
- A report takes place in a single workspace.
- A report can be associated with multiple dashboards within the workspace. Tiles pinned from that report may appear in more than one dashboard.
- You can create a report using data from a dataset. Power BI Desktop can combine multiple datasets into a single report and this report can be exported to Power BI.
Dashboards
The dashboard is interactive visual, text, and graphic tiles created by you in the Power BI service or by a colleague in the Power BI service and shared with you. contains a single screen.
Why are dashboards created? Some of the reasons are:
- You'll see all the necessary information on a single page to make a decision.
- You have the power of monitoring the most important trends in your business.
- You put everyone in your team in the same direction, viewing and using the same information.
 Zekeriya Mulbay
A dashboard
- associated with a single workspace
- can view visualizations from many different datasets
- can view visualizations from many different reports
- can view pinned visualizations from other tools like excel
for information about dashboard design, You can look at our dashboard design posts
Tiles
Each visual data stored in the dashboards is referred to as a Tile.
What are Power BI components?
Power BI Desktop
It is the free Power BI platform offered by Microsoft, where we take data from various sources, organize, analyze and report. It is a user-friendly, powerful, and constantly updated desktop software that gathers all these solutions that consist of a combination of Power Pivot, Power View, and Power Map under one roof.
Power Query
It is a business intelligence tool that allows you to take data from different sources and edit them.
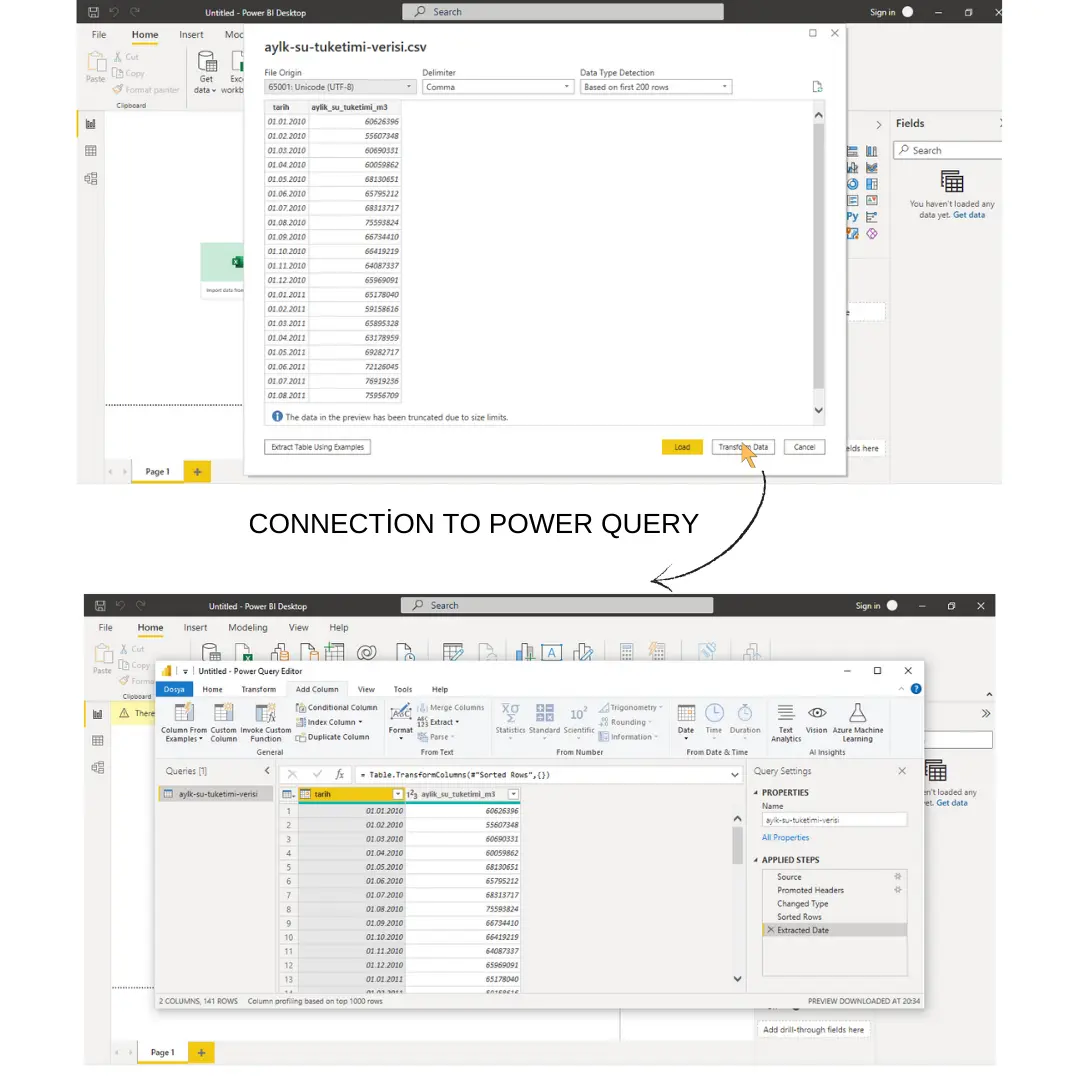
Its equivalent in Power BI Desktop is the Power Query Editor section which is the data connection technology of Power BI where some editing operations are performed on the data.
Power Pivot
It is a data modeling technique that allows you to create data models, establish relationships, and also perform calculations. Power Pivot allows you to work with large tables, create relationships, and run calculations.
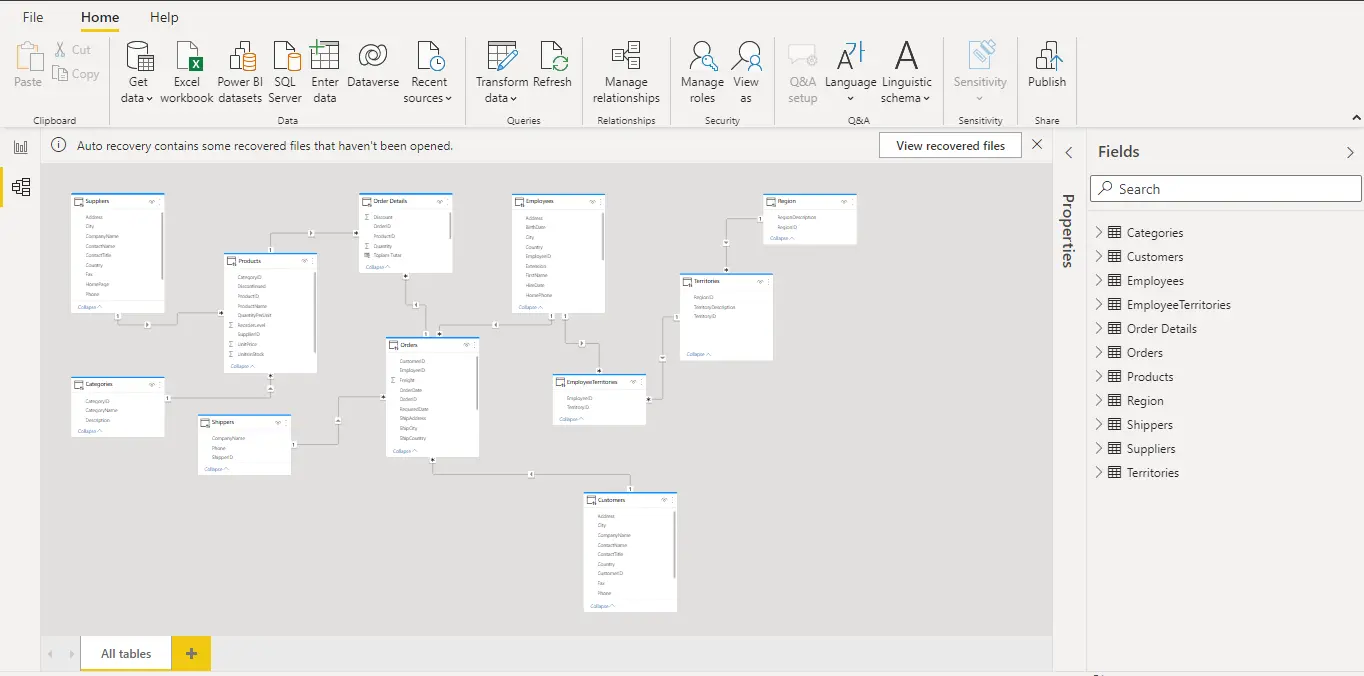
Power BI has a structure that includes all the features found in Power Pivot. You can create Measure and Column by making various calculations with DAX functions.
You can also establish relationships between your tables that make up the data and create new data models from the Power BI Relationships screen.
Power View
It is the data visualization component of Power BI. It serves to make received raw data interactive by connecting to a data source.
Power Map
It is a component created with Microsoft Bing Maps infrastructure and installed as an Excel add-in. It allows you to interactively visualize the country/region/province/county and coordinates data you entered into Excel on maps in 3D.
Thanks to this feature integrated into Power BI, it allows you to report some of your data on maps in a much more understandable and analyzable way.
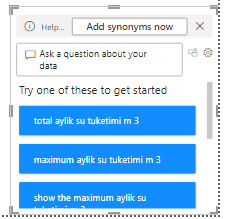
Power Q&A
We can say that it is an engine that answers questions in data language. In Power BI, very good reports can be generated thanks to Q&A.
Power BI Services
This is the section where the reports and analyses prepared in Power BI Desktop, that is, solutions in general, are published and presented to the user. It is complementary to every solution made in Power BI Desktop.