How to create a data model in Power BI?

In Microsoft Power BI, building a flawless data model is one of the most critical tasks a data analyst can accomplish. You can make it easier for people to comprehend your data if you do this correctly, which will make it easier for them and you to build useful Power BI reports.
Tables and the data sets to which they're related make up a data model. Tables are useful structures for organizing and normalizing data. In most cases, even a table is a data model.
If a data model contains more than one table, these tables must be linked. A relationship is a framework that connects two tables. We say two tables are related when they are linked.
The following are some of the advantages of a good data model:
- Data discovery is more rapid.
- Clusters are simpler to make.
- Reports are more precise.
- Report writing takes less time.
- Reports are more easily preserved in the future.
Power BI allows you to create relationships between tables from different data sources, which is useful for pulling data from Microsoft Excel and a relational database. After that, the relationship between these two tables is established, and they are treated as a single dataset.
The primary key and the foreign key define the relationships between tables. Columns that define each unique, non-null row of data are known as primary keys. For example, if you have a Customers table, you might have an index that identifies each unique customer. When different tables share common primary and foreign keys, their relationships form.
What is a star schema?
To simplify your data, you can create a star schema. Each table in your dataset is defined as a dimension or fact table in the star schema, as shown in the image below.
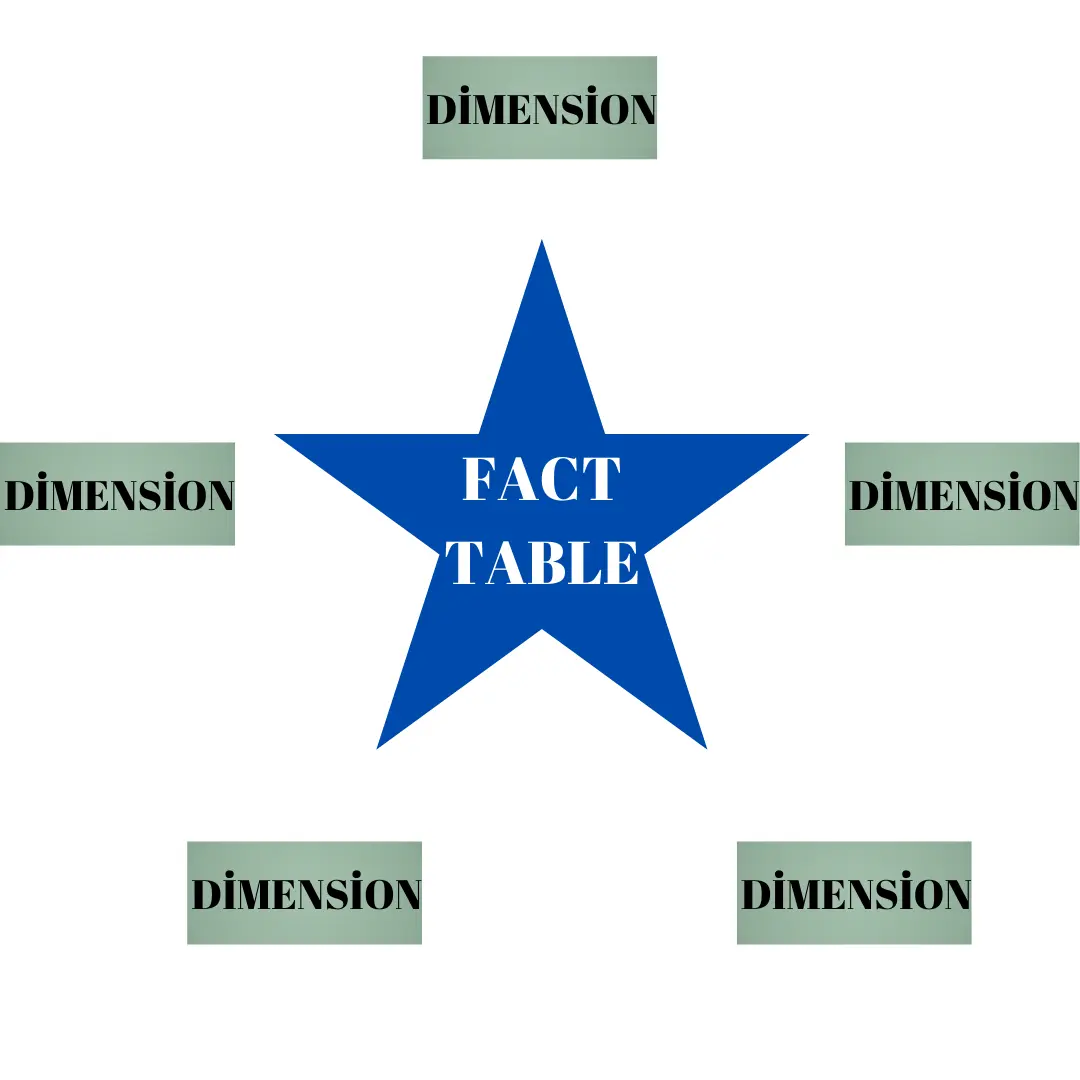
Fact tables: Values produced from data collected through observation or an event. Sales orders, product counts, prices, transaction dates and times, and quantities are all examples of data. Multiple duplicate values can exist in fact tables.
Tables frequently contain columns with numbers and dates. Numbers can be measurement units like sales figures or keys like customer IDs. Dates, such as the order or shipping date, represent recorded time.
Dimension tables: Contains information on the items, locations, employees, and order kinds found in fact tables. Key columns connect these tables to the fact table. Dimension tables are used in fact tables to filter and group data.
Dimension tables, on the other hand, contain unique values; for example, one row in the Products table for each product and one in the Customer table for each customer.
How to create a data model in Power BI?
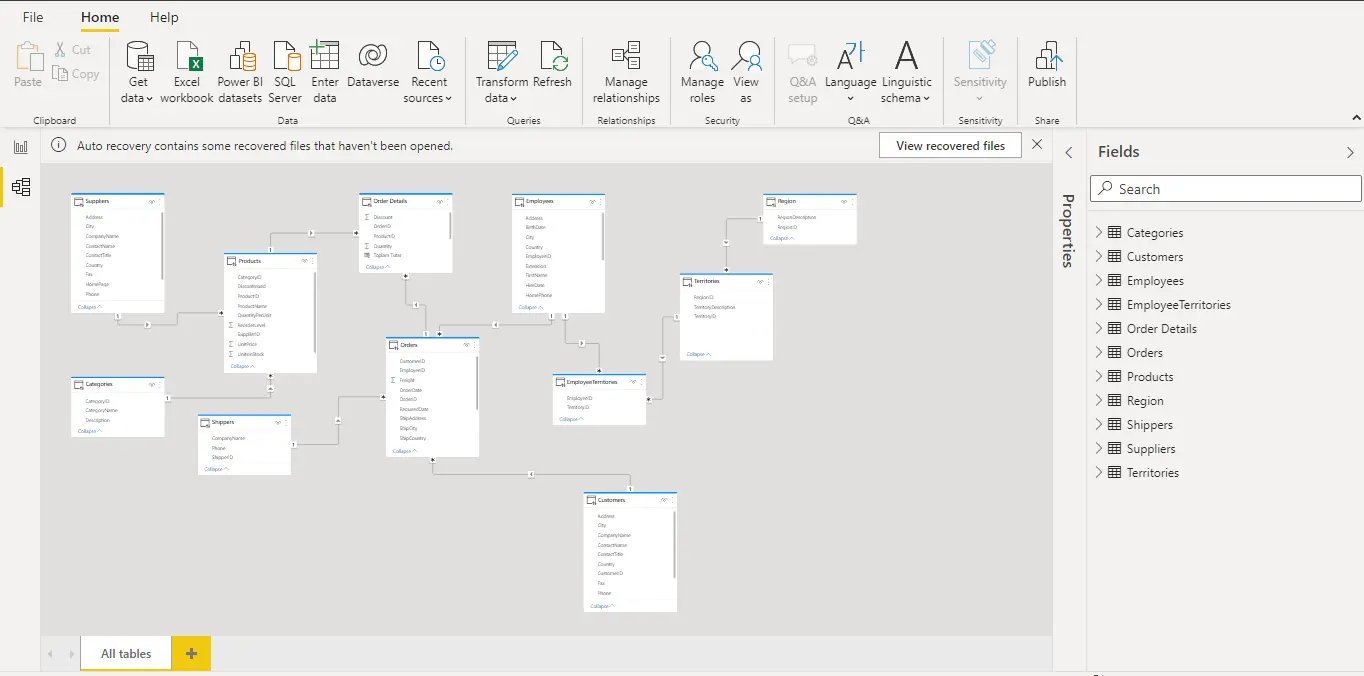
To model your data or alter your existing model, go to the Power BI modeling view and drag and drop your relations, or go to the relations part of the top ribbon and manage relationships.
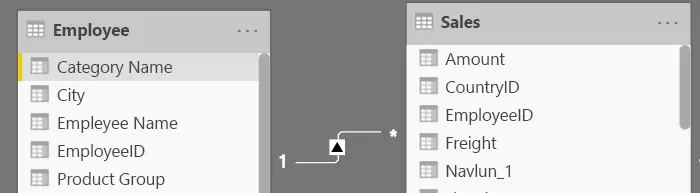
As shown in the data model below, relevant data is found in two tables: Employee and Sales. Because it contains sales order values that can be aggregated, the sales table is considered a fact table.
The employee table is a dimension table because it contains the specific employee name that filters the sales orders. The EmployeeID column is the common column between the two tables and the primary key in the Employee table; thus, you can create a relationship between the two tables based on this column.
See this page for more information on relationships.


