How to get created and managed aggregations in Power BI?

As you collect data, you summarize it and present it at a higher level. For instance, you might summarize all sales information and organize it by date, client, product, etc. Aggregation allows you to concentrate on key data and enhance query performance by reducing table sizes in the data model.

Your company might utilize aggregates in data models for the following reasons:
- When dealing with large amounts of data (big data), aggregations improve query performance and assist you in analyzing and deriving insights from that big data. Because collected data is cached, a resource partition required for detailed data is used.
- Aggregations can help you speed up the refresh process if you're experiencing a slow refresh. A smaller cache size reduces refresh time, allowing data to reach users more quickly. You refresh a smaller amount of data as opposed to millions of rows.
- Aggregations can assist you in reducing and maintaining the size of your data model if you have a large one.
- Suppose you expect your data model to grow in size in the future. In that case, you can use aggregations to future-proof it by minimizing the likelihood of performance and refresh concerns and general query issues.
How are aggregates created?
In Power BI, aggregates can be created manually in the data model or automatically for Premium subscribers by turning on the automatic aggregations tool in dataset Settings.
Aggregations tables can be generated in Power Query as import tables for the greatest performance, at the data source as a table or view, as a native query, or for the data source as a table or view. Following that, you define aggregations for aggregation columns with properties for summarization, detail tables, and detail columns using the Manage Aggregations window in Power BI Desktop.
Dimensional data sources, such as data marts and warehouses, can be utilized in conjunction with relationship-based aggregations. Big data sources built on Hadoop frequently base aggregations on GroupBy columns.
It would help if you first decided at what level you want to create aggregations. The next step after deciding on the level is to decide how you want the aggregations to be created. There are various ways to construct aggregates, each producing the same outcomes. For instance:
- If you have database access, you can create a table with the aggregation and import it into Power BI Desktop.
- If you have access to a database, you can create a view for the aggregation and then import it into Power BI Desktop.
- The Power Query Editor in Power BI Desktop can be used to create aggregations step by step.
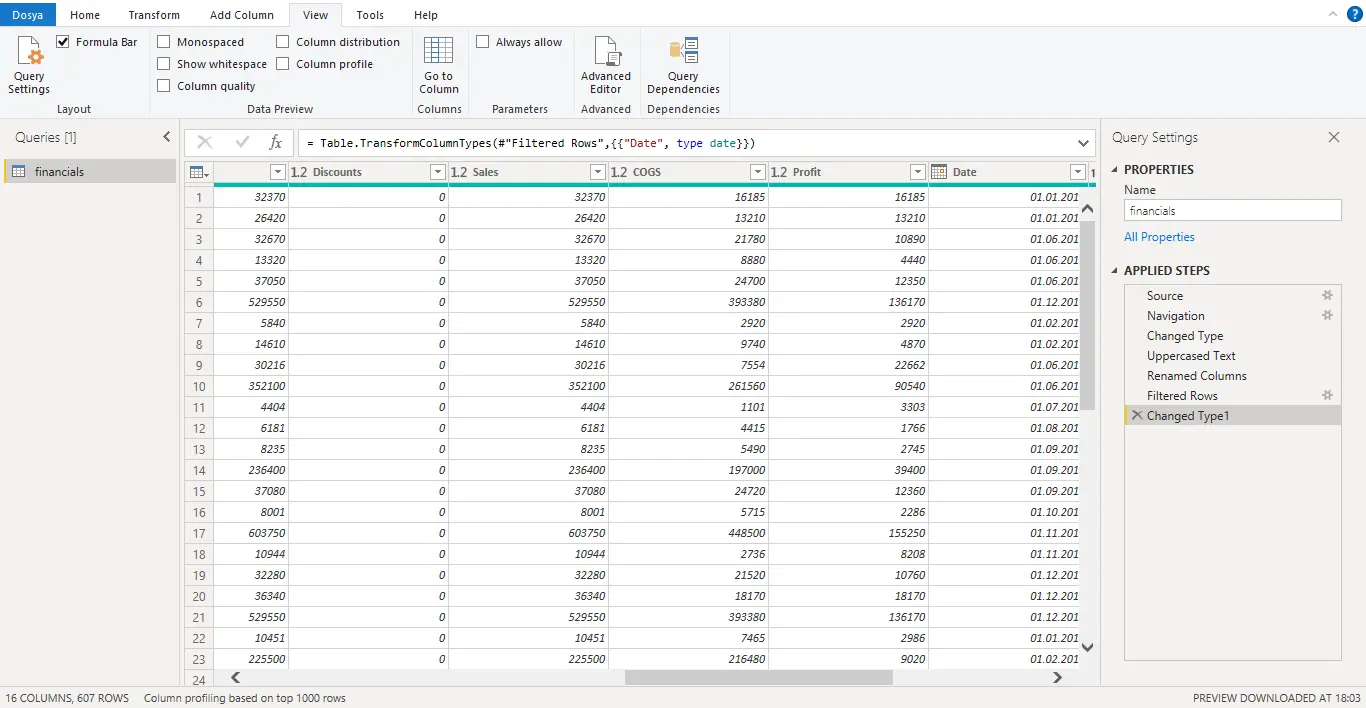
This query has 657 rows, as seen in the screenshot below, and when you examine it in the Power Query Editor, you discover that the data is not being collected.
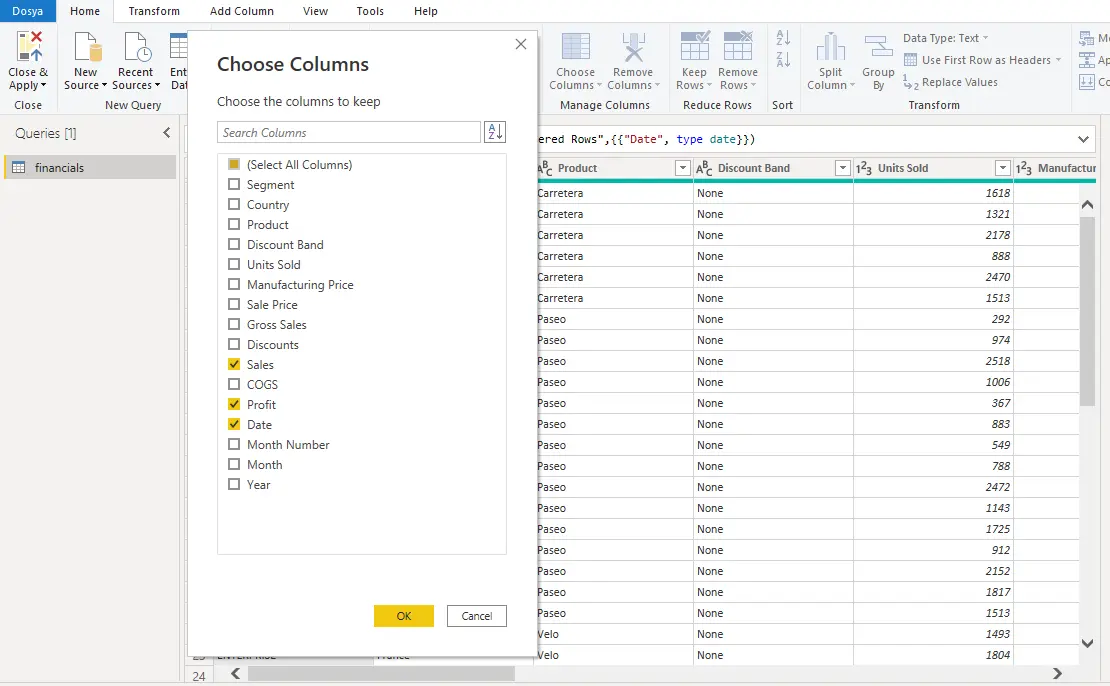
You wish to display the Sales and Profit columns and gather data based on the Date column. Start by choosing the Select Column option under the Home tab. In the window that displays, select the columns you want to include in the aggregation and click OK.
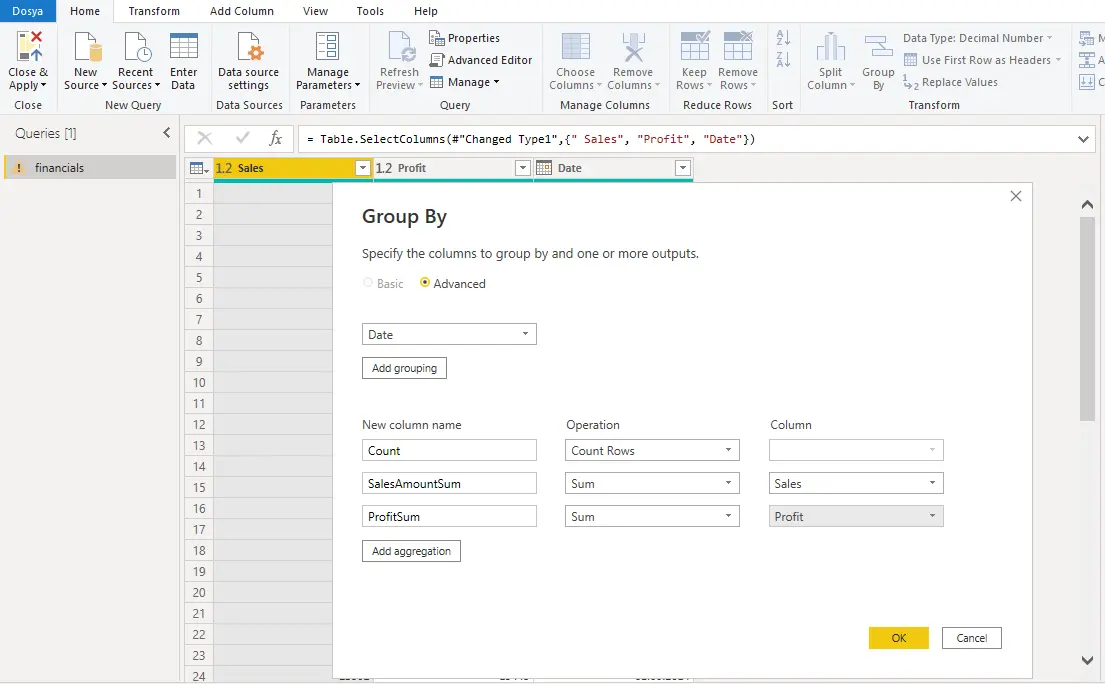
Go to the Home tab and select the "Group By" button once the selected columns are visible on the page.
Select the Advanced option to display to another column row after clicking the Add grouping button. To link aggregation to another column, choose the operation for the aggregation column, then provide a linkable column name. Repeat these steps until all the aggregates have been added, then click OK.
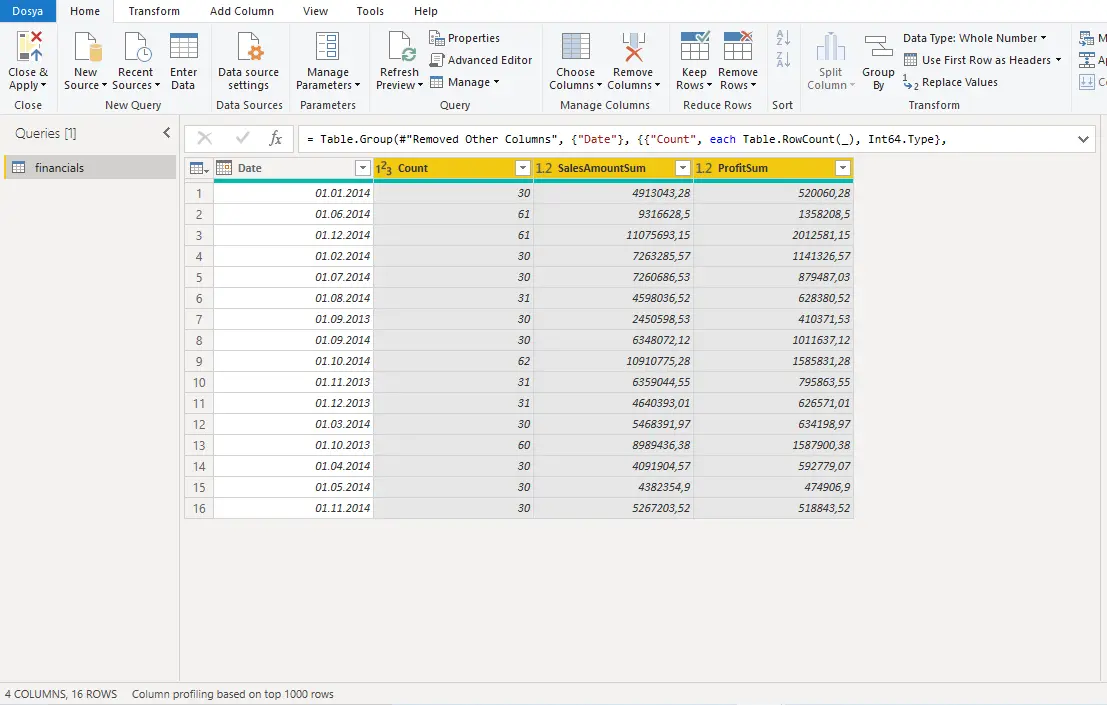
When your total is displayed, you will see how the data transforms. The data is collected within each date, and you can see the number of sales and the corresponding sales and total profit values.
By clicking the Close and Apply button, you can apply and close the changes to your data model in Power Query Editor. to observe the outcomes, Navigate to the Power BI Desktop page and click the Refresh button. Examine the screen to see how many rows your data model now contains. There should be much fewer rows than there were initially. This number is also visible when you reopen Power Query Editor, as shown in the screenshot below. There are now just 16 rows in this illustration.
The aggregation has significantly decreased the number of rows in your dataset, which should improve your model's performance since Power BI will have fewer data to refresh.
How are aggregations managed?
You can manage and modify their behavior when you create aggregations in Power BI Desktop.
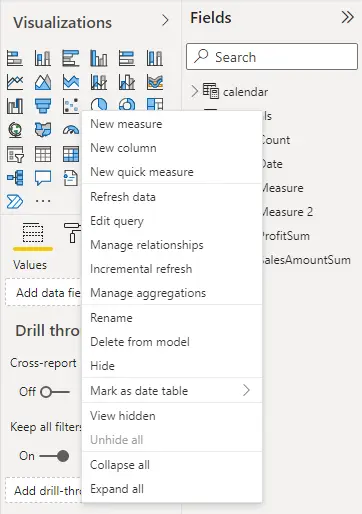
The Manage Aggregations window can be accessed from any view in Power BI Desktop. Select Manage aggregations from the context menu when you right-click the table in the Fields pane.
You can alter the selected detail table and column by choosing an option from the Summarization drop-down list for each aggregation column. Once you've completed the aggregations, click the "Apply All" button.
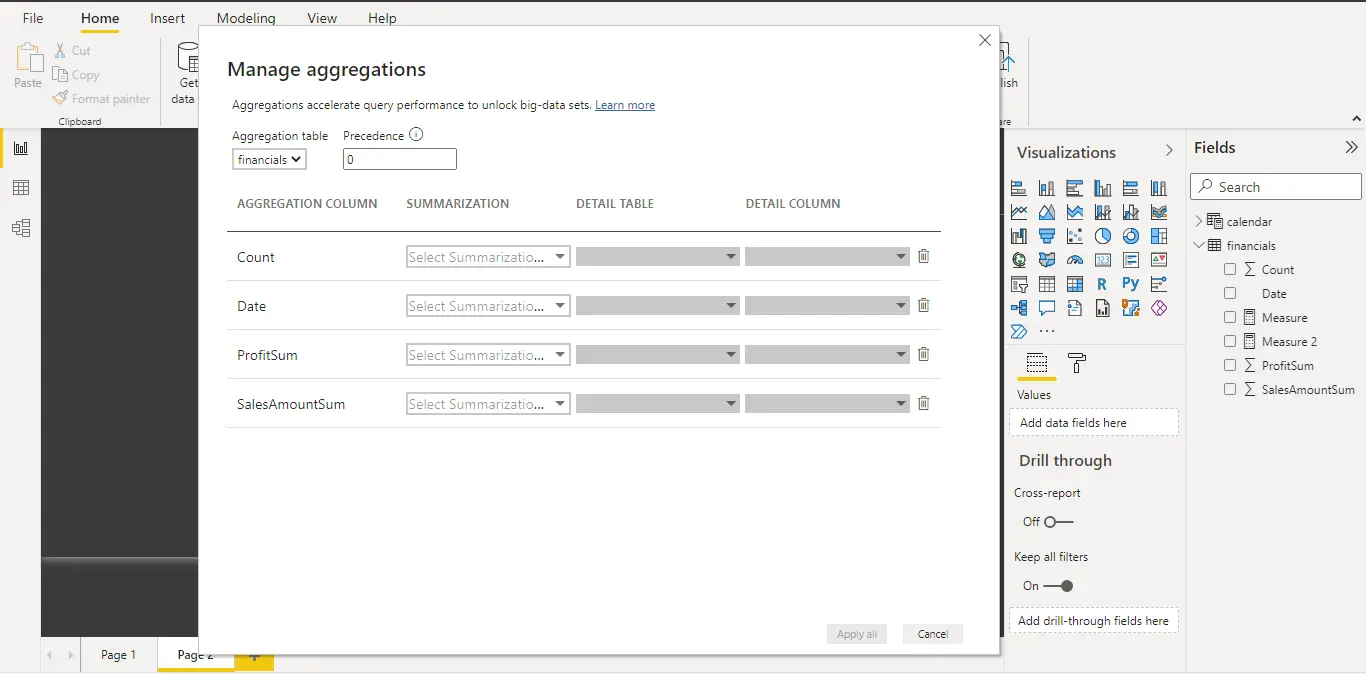
You can alter the selected detail table and column by choosing an option from the Summarization drop-down list for each aggregation column. Once you've completed the aggregations, click the "Apply All" button.


