How to organize data in Power BI Desktop?

We may connect to many different data sources using Power BI. Our data, however, may be incomplete, inaccurate, disjointed, or not in the format we require, or we may wish to combine data from multiple sources.
The Power Query Editor is a Power BI Desktop component that allows you to edit data connected to the Power BI Desktop. You can combine different data types, organize, and prepare data for use with queries in the Power BI Query editor.
You should read my post on data sources and how to connect in Power BI Desktop to learn how to connect to data.
There are three ways to access the Power Query screen in Power BI Desktop:
- While the data is being loaded, click the transform button in the data preview window
- right-click on data and select edit query in the Power BI Desktop Fields field
- clicking transform data in the queries field on the ribbon in the Power BI Desktop Home tab
What fields are there on the Power Query Screen?
1. Ribbon: A multi-tabbed ribbon navigation experience for adding transforms, selecting query settings, and accessing different ribbon buttons to execute various tasks.
2. Queries pane: A list of all the queries.
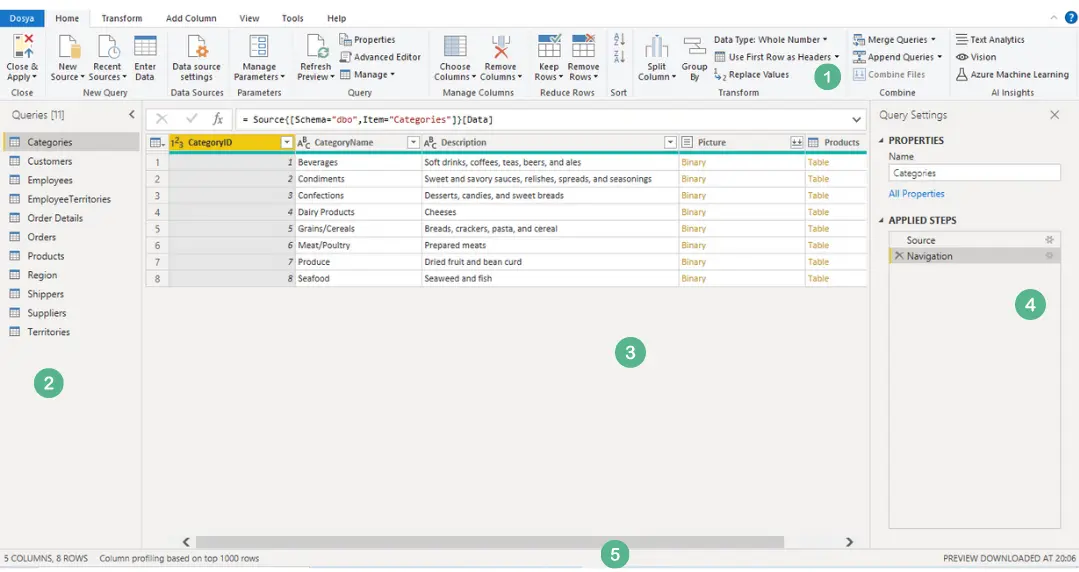
3. Current view: The current view is your primary working view, which by default displays a sample of the data for your query. The diagram view can be made available in addition to the data preview view.
4. Query settings: The query name, query stages, and numerous indications are all shown in this view of the currently selected query.
5. Status bar: A bar that shows key query information such as execution duration, the total number of columns and rows, and processing progress. There are other buttons on this bar to modify your current view.
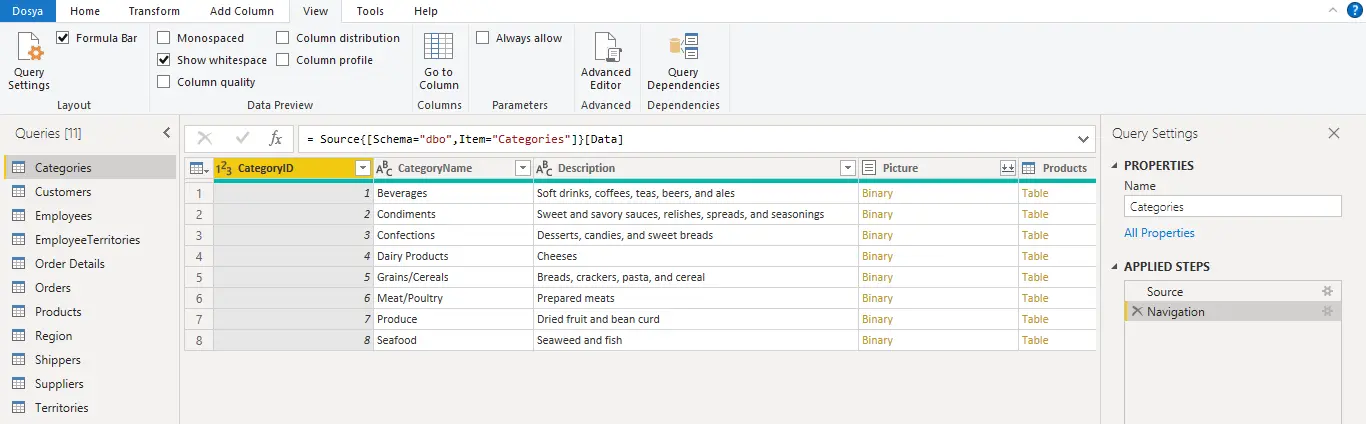
How do I change between views?
When you switch between views by clicking the View tab on the ribbon, the Power Query user interface will look as determined by the Preview and Layout groups.
How do you shape data?
Power Query Editor follows the step-by-step instructions you provide as you shape the data, allowing it to load and present it as you have set it up. No changes are made to the original data source. One single data view has been modified or shaped.
The Power Query Editor records the actions you specify (such as renaming the column, changing the data type, or deleting the column).
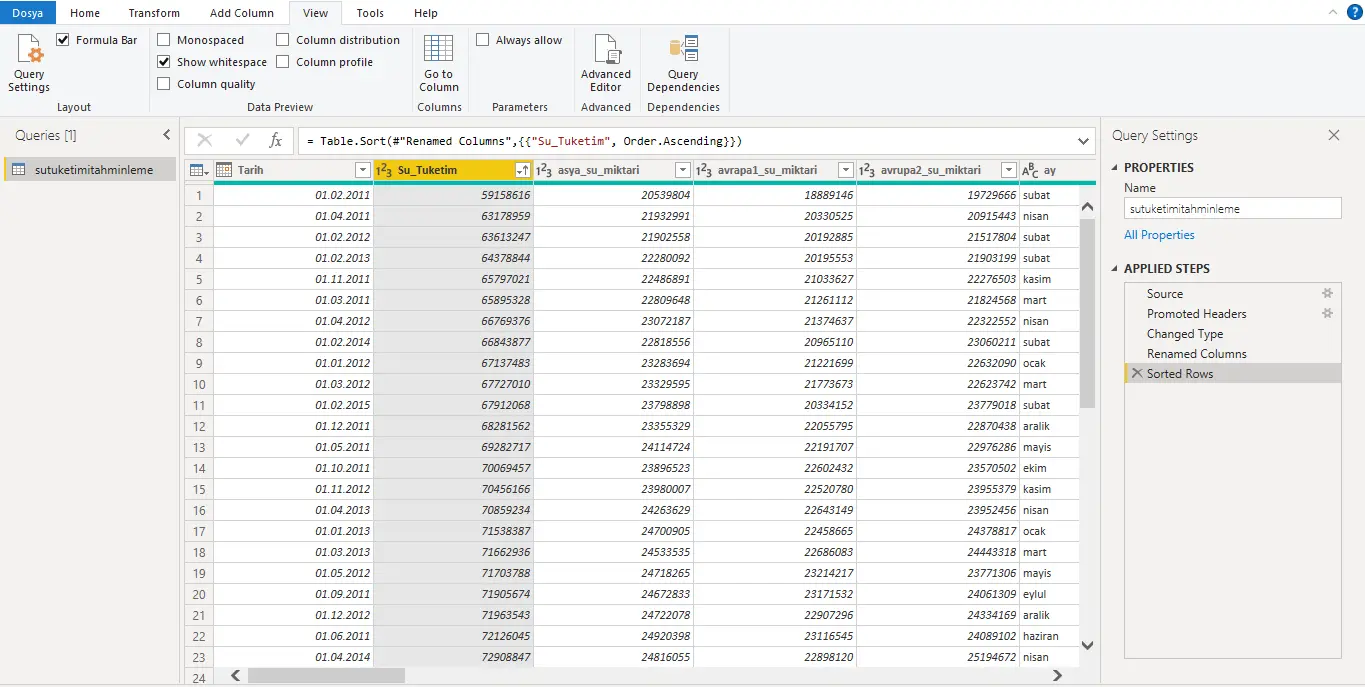
The Power Query Editor carries out these actions each time this query establishes a connection to the data source to help shape the data as you always specify. That happens when you use the Power Query Editor or someone uses your shared query. These actions are listed in the Applied Steps section of the Query Settings window.
The Steps Applied list in Query Settings displays all data shaping steps. To remove a shaping step, click the X icon to its left.
We make our settings from the File tab to apply our modifications and close the Power Query screen once the edits are complete.


