16 Features You Should Know About Power BI

Creating value from data is becoming increasingly important in today's business world. Besides that, for businesses looking to generate value from data, a variety of business intelligence tools are available.
Microsoft has been recognized as a Leader in the March 2022 Gartner® Magic Quadrant™ for Analytics and Business Intelligence Platforms report.

Power BI is an end-to-end business intelligence tool for data analysis and reporting developed by Microsoft.
You can read What is Power BI? to learn more about it.
Power BI has an important place in the business intelligence market. So, what are the features that differentiate Power BI in this market?
1. Affordable Cost
Power BI desktop, used for advanced data analysis and reporting, Power BI service, which stores report in the cloud and can be accessed from anywhere (mobile or web), and Power BI mobile, which allows you to access reports from your mobile device, are all free services provided by Power BI.
Power BI Pro is priced per user and will be used to share data with specific users. Other paid versions are also reasonably priced.
2. Interactive Update
Microsoft updates Power BI regularly. Furthermore, a community has been established in which users can share their ideas and actively participate in community updates.
The most frequently requested update by users may have an impact on the next release. Power BI responds quickly to user requests and is constantly improving with new features thanks to frequent and comprehensive updates.
3. A variety of visualizations

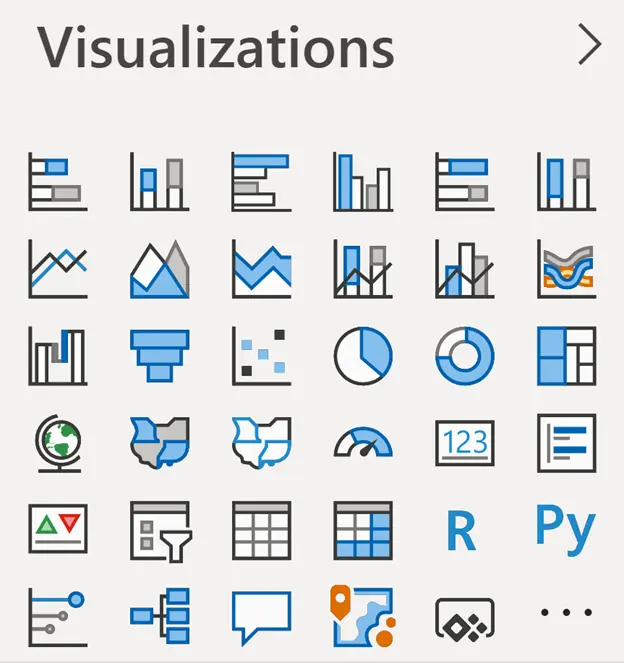
Power BI's general set of visualizations is shown above. Custom visualizations in Power BI in reports and dashboards can be created in addition to the set of visualizations using the custom visualization library.
As you can see in the video below, the visualizations are interactive.
4. Various Data Source
The ability to work with data from a variety of data sources is one of the most significant advantages of using Power BI as a data analysis tool.
It connects data files (such as CSV, XML, JSON, PDF,etc), databases, Azure resources, cloud-based resources, Google resources, Google Analytics, and online services such as Facebook.
It also gives you direct access to large data sources. In other words, it provides users with access to a diverse set of structured, unstructured, and semi-structured resources, all of which are constantly updated.
5. Datasets Filtering
A dataset is a single dataset that is created by combining data from multiple sources. In Power BI, you can select only the most important data from a variety of sources and use that data to create smaller, more relevant datasets.

6. DAX Data Analysis Function
Power BI includes DAX functions for Data Analysis Expressions. These analysis functions are predefined codes that are used to perform specific analytical functions on data. Power BI performs advanced analysis with these functions.
7. Turn Insights Into Action
Using Power BI, Power Apps, and Power Automate, you can easily build business apps and automate workflows by moving from data to insight and from insight to action.
8. Excel Integration
Power BI has the option to load and view data in Excel. Users can view and work with the raw data behind a Power BI visualization using the Excel integration feature in Power BI.
9. Secure Data Analysis
- In the Microsoft 365 experience, use Microsoft Information Protection to apply sensitivity labels to Power BI data.
- By managing sensitive data with your own key, you can better meet privacy and regulatory requirements.
- Use Power BI security with service tags, Azure Private Link, and Azure Virtual Network to better protect your enterprise data.
- Personal Gateway is used by Power BI to authenticate data sources. Cloud instances and data from an on-premises data source can be used after authenticating that data source.
10. Power BI Embedded
used by an application developer to embed or incorporate reports and features into web-based or other applications.
11. Data Accessibility
All data imported and worked on from data sources is stored in a central location. These data can be accessed at any time, place, platform, or number of times.
12. Accelerate Big Data Preparation with Azure
You can analyze and share large amounts of data when you use Power BI with Azure. The Azure data lake can help business analysts, data engineers, and data scientists gain insights faster and collaborate more effectively.
13. Find Results Quickly with Artificial Intelligence
Use Microsoft's most recent artificial intelligence advancements to help non-data scientists with data preparation, machine learning model development, and rapidly gaining insights from both structured and unstructured data, such as text and images
14. Real-Time Flow Analysis
Understand what is going on not only in the past but also in the present. Utilize real-time analytics such as factory detectors and social media sources to ensure that you are always prepared to make timely decisions.
15. Natural Language Q&A Question Box
This built-in feature helps you to explore data by asking questions, and the software responds to you with visualizations. Changes to dashboards and reports can be made using Q&A. Q&A also assists you in locating the correct question and providing the most accurate answer.
16. Combine Self-Service with Enterprise Analytics
Consolidate your self-service and enterprise data analytics requirements into a single platform.
Powerful semantic models, an application lifecycle management (ALM) toolkit, an open link framework, and perfectly paginated hard-layout reports are all available.
You should learn the Power BI components here.


